Normal view

There are new articles available, click to refresh the page.
Before yesterdayMain stream

NASA’s Hubble, Webb Find Far-out Solar System Objects ‘Remember’ Past
8 September 2026 at 10:00
 

5 min read

NASA’s Hubble, Webb Find Far-out Solar System Objects ‘Remember’ Past

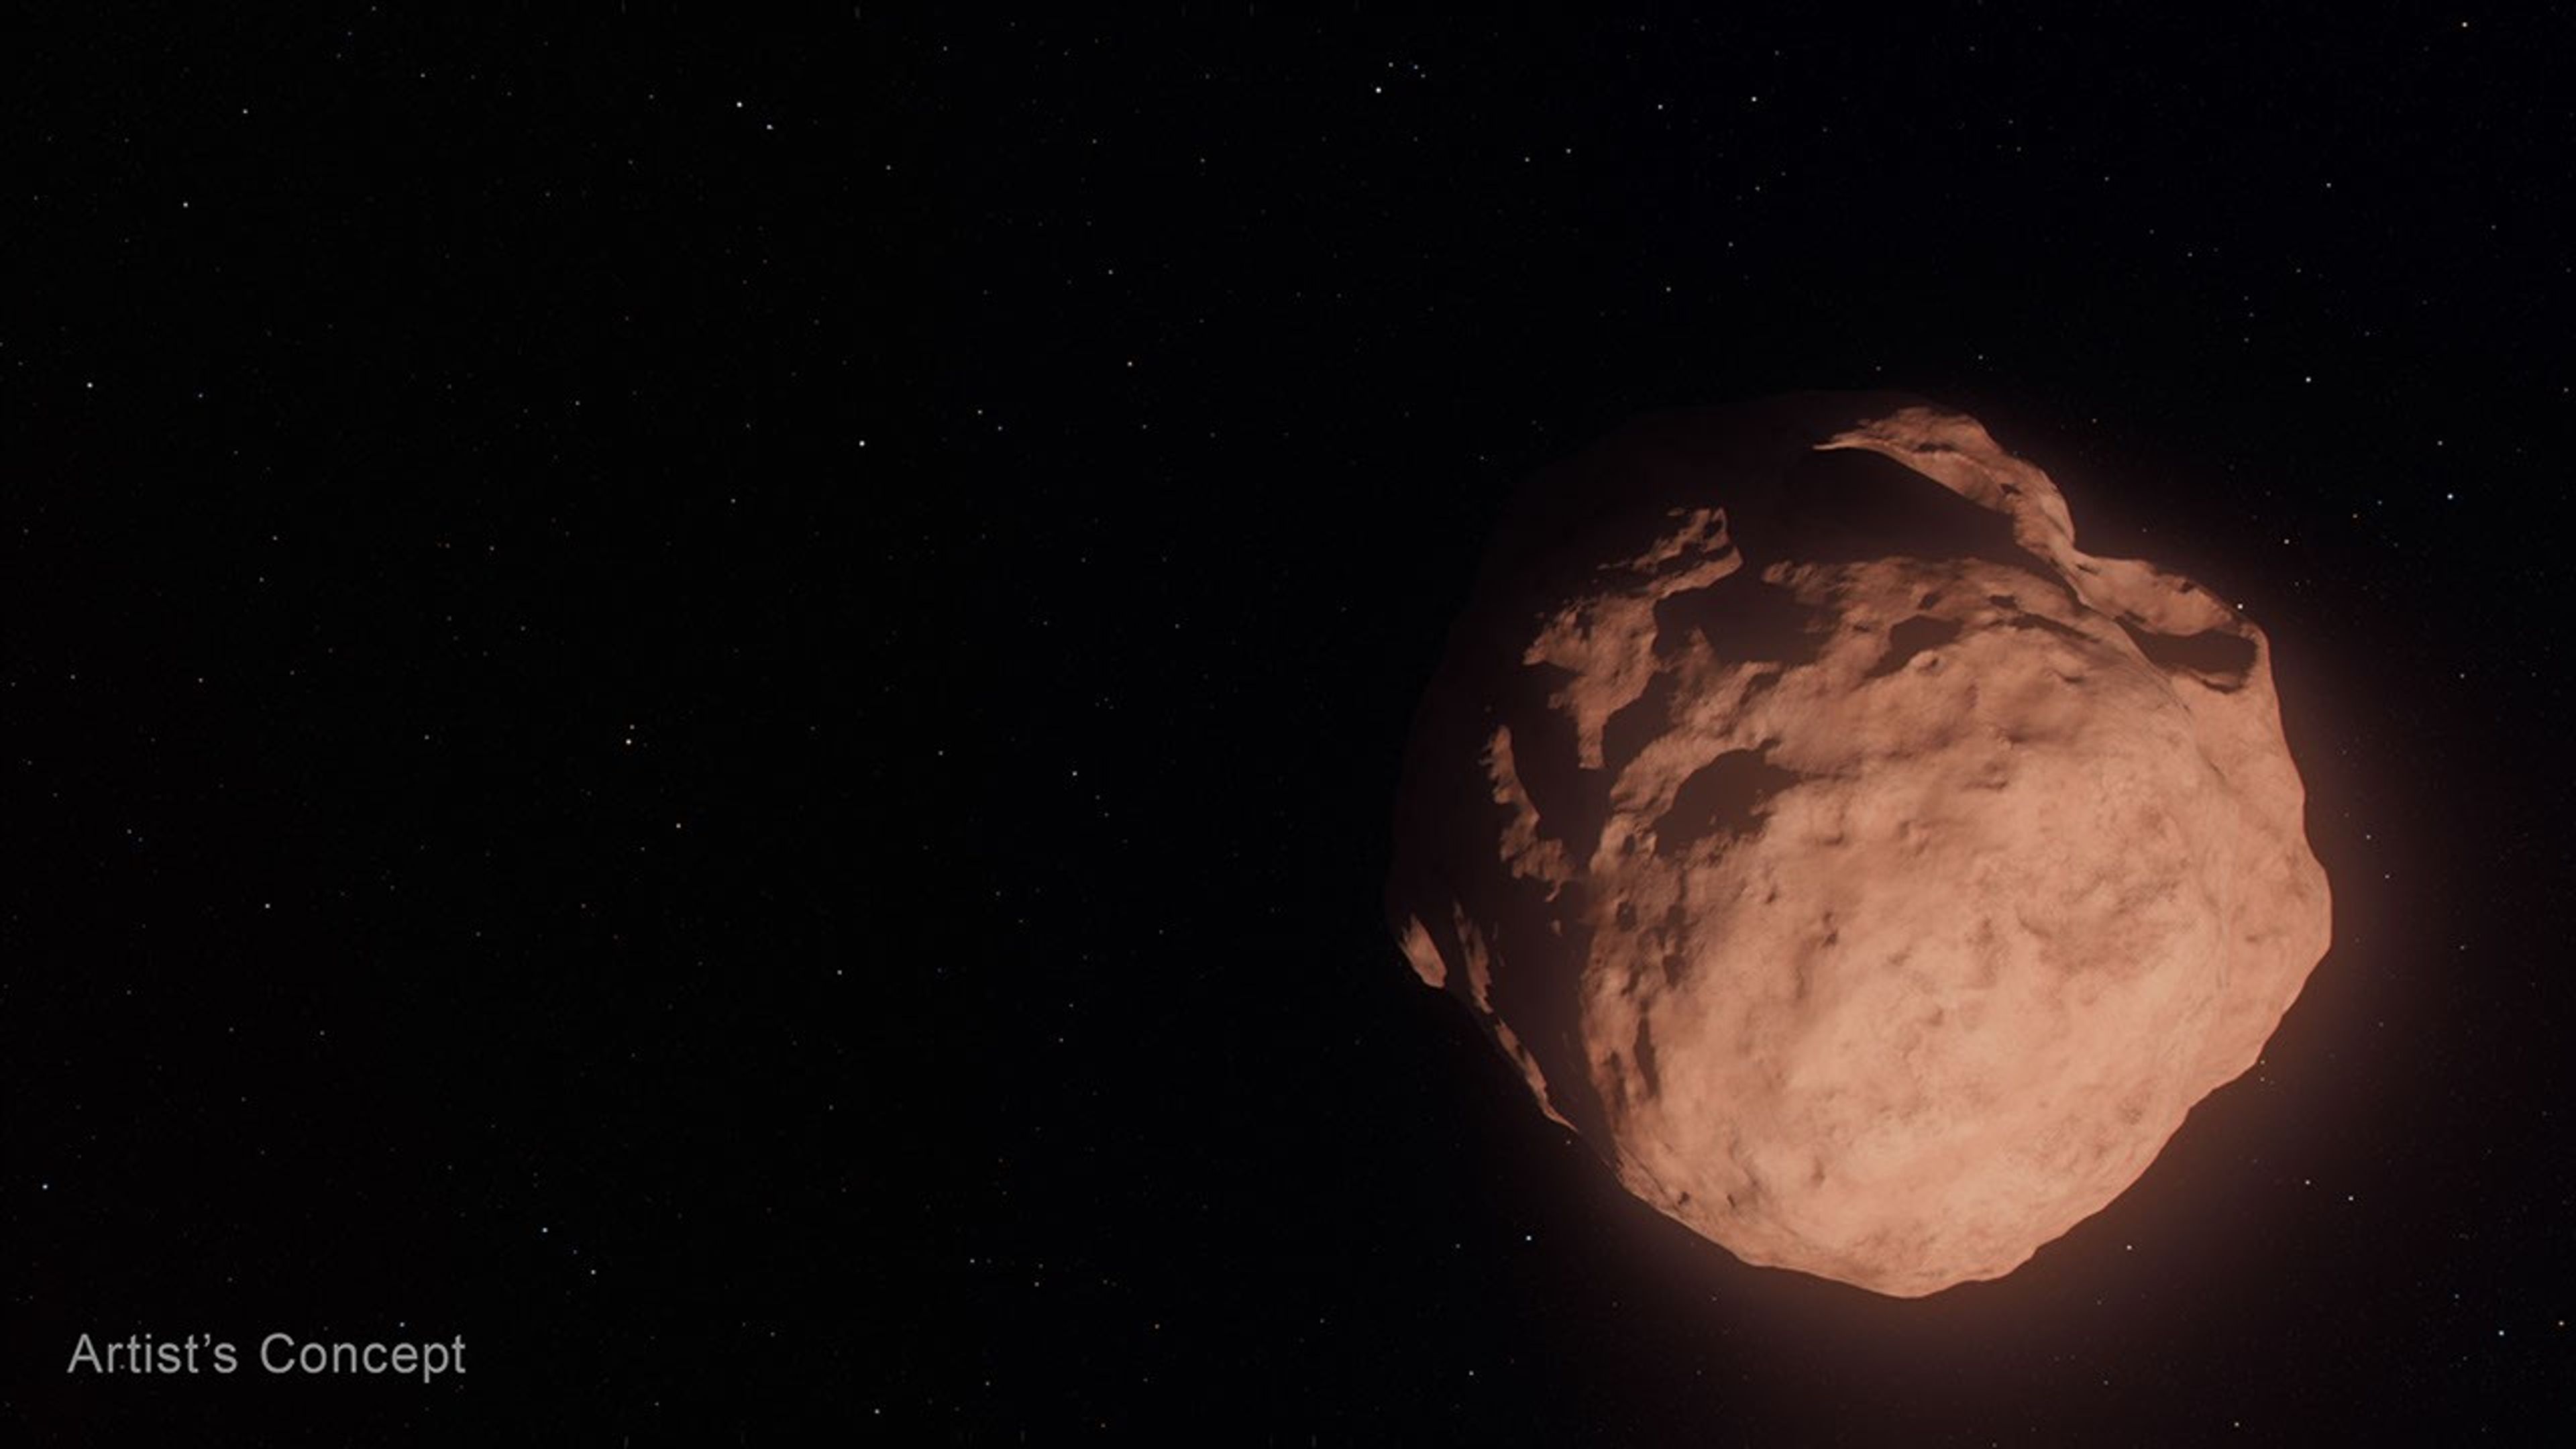
An illustration of a roughly spherical, rocky object against a black background speckled with distant, white stars. The object is the color of red clay and is pockmarked with craters and other geological scars. At the bottom left corner of the illustration in gray lettering is the label “Artist’s Concept.”
This artist’s concept depicts a Trans-Neptunian Object, a small, faint, icy body orbiting the Sun beyond the orbit of Neptune. These objects are so small that even with NASA’s Hubble and Webb space telescopes, they appear only as tiny points of light.
Artwork: NASA, ESA, Leah Hustak (STScI)

For the first time, scientists used the joint power of NASA’s Hubble and James Webb Space Telescopes to study some of the most far-flung bodies in our solar system, Trans-Neptunian Objects (TNOs). Some of these are the smallest and faintest ever directly seen. The researchers unexpectedly found fewer small TNOs than they expected, and that the colors of these bodies followed the same relationships as their larger family members.

These objects are typically small, faint, icy bodies orbiting the Sun beyond the orbit of Neptune. Most are more than 100 million times dimmer than objects visible to the unaided eye. In two complementary papers published Tuesday in The Astronomical Journal, teams analyzed the color, composition, and size distribution of 27 newly discovered tiny, dim TNOs. 

This class of small bodies offers the best view into an early stage of planet-building, when a disk of dust and pebbles in orbit around the Sun coalesced into city-sized “planetesimals” — the solid building blocks that clump together to form planets — but had not yet merged into full-sized worlds.  Beyond Neptune, this second stage never happened, leaving behind a frozen population of planetesimals.

In the deepest TNO survey to date, teams led by PhD candidates from the University of Victoria in Canada, under the guidance of the National Research Council of Canada, and Northern Arizona University in Flagstaff examined a patch of sky simultaneously with Hubble, observing the TNOs’ visible light, and Webb, observing their infrared light. The team of researchers measured the objects’ colors, which are like a fingerprint of the surface composition, as well as their sizes and determined their orbits. 

In the coordinated observations, the teams studied two different types of TNOs. The first, dynamically “cold” TNOs, are on their original, relatively circular orbits around the Sun in the plane of the solar system. The second type, dynamically “hot” TNOs, formed between the current locations of Uranus and Neptune but were pushed outward where they are today when the outer gas giants migrated early in the solar system’s history. Today they reside in highly elliptical orbits and move in and out of the plane of our solar system.

NASA’s Goddard Space Flight Center; Lead Producer: Paul Morris

Prior to these observations, astronomers thought that small TNOs from both hot and cold populations would have undergone many collisions, changing their surfaces compared to larger TNOs. But that’s not what the observations showed. Instead, the small bodies look like their larger counterparts. This implies that collisions are not changing the surfaces significantly—perhaps because there are fewer collisions than expected, or because the TNOs somehow retain their primordial, pre-collision compositions. The teams are still trying to unravel this mystery.

“You could imagine a scenario where getting knocked around and fragmented would change the surface composition, and then you would see a different surface color for tiny TNOs compared to their larger siblings. So it’s really fascinating to see that the smallest objects are somehow ‘remembering’ and preserving the history of how they were made,” said Northern Arizona University PhD candidate Anastasia Morgan, who led the study of color and composition

“These dynamically ‘hot’ TNOs retain a signature of where they were born, even though they’ve been orbitally scrambled since then,” said co-author David Trilling of Northern Arizona University.

Both the “hot” and “cold” populations seem to keep the same colors as when they were formed, with little change since the birth of the solar system. 

The Webb data also allowed researchers to measure the number of objects of each size. They found that the overall size distributions for both populations were surprisingly similar.

“It’s very interesting that the process of planetesimal formation ends up producing the same distribution of sizes for both cold and hot populations, despite forming in different regions of the early solar system. The process seems to be insensitive to disk conditions, producing similar planetesimal sizes whether the disk is hot or cold, and dense or fluffy,” said University of Victoria PhD candidate Marielle Eduardo, who led the study on size distribution

Researchers also found fewer of these very small bodies than they expected based on some planet formation models. Webb discovered 27 new, remarkably dim TNOs, one so faint it is equivalent to standing on Earth and seeing a small swarm of fireflies on the Moon. The smallest one they observed has a diameter of about 3 miles (5 kilometers), which is about five times smaller than what is possible to detect with the most sensitive ground-based telescopes.

This project would not have been possible without Hubble and Webb working together to detect and characterize these TNOs. With Hubble’s sensitivity in visible light and Webb’s in infrared, the space telescopes provide more insights than either can on its own.

The Hubble Space Telescope has been operating for over three decades and continues to make ground-breaking discoveries that shape our fundamental understanding of the universe. Hubble is a project of international cooperation between NASA and ESA (European Space Agency). NASA’s Goddard Space Flight Center in Greenbelt, Maryland, manages the telescope and mission operations. Lockheed Martin Space, based in Denver, also supports mission operations at Goddard. The Space Telescope Science Institute in Baltimore, which is operated by the Association of Universities for Research in Astronomy, conducts Hubble science operations for NASA.

Facebook logo
Instagram logo

The James Webb Space Telescope is the world’s premier space science observatory. Webb is solving mysteries in our solar system, looking beyond to distant worlds around other stars, and probing the mysterious structures and origins of our universe and our place in it. Webb is an international program led by NASA with its partners, ESA (European Space Agency) and CSA (Canadian Space Agency).

Facebook logo
Instagram logo

To learn more about NASA’s space telescopes, visit:
https://science.nasa.gov/universe

Related Images & Videos

An illustration of a roughly spherical, rocky object against a black background speckled with distant, white stars. The object is the color of red clay and is pockmarked with craters and other geological scars. At the bottom left corner of the illustration in gray lettering is the label “Artist’s Concept.”

Trans-Neptunian Object Illustration

This artist’s concept depicts a Trans-Neptunian Object, a small, faint, icy body orbiting the Sun beyond the orbit of Neptune. These objects are so small that even with NASA’s Hubble and Webb space telescopes, they appear only as tiny points of light.

An illustration of a roughly spherical, rocky object against a black background speckled with distant, white stars. The object is the color of red clay and is pockmarked with craters and other geological scars. At the bottom left corner of the illustration in gray lettering is the label “Artist’s Concept.”

Tiny Worlds Discovered by Hubble and Webb

This video explains how Hubble and Webb are giving scientists a new look at some of the solar system’s oldest survivors and revealing new clues about how the building blocks of planets, including Earth, first formed.

Explore More

Illustration of two large, cratered rocks in the foreground right. Another rock is seen in the distance to the left. The black background of space shows the hazy Sun and zodiacal light due to dust in the solar system, as well as scattered distant stars. The words

NASA’s Hubble Finds Kuiper Belt Duo May Be Trio

A team of researchers found a potential three-body system in the Kuiper Belt. The system, known as the Altjira, challenges traditional collision theories by suggesting that these triple systems might form directly from the gravitational collapse of material in the early solar disk.

A rock that looks like a red space snowman

NASA’s Webb Reveals the Ancient Surfaces of Trans-Neptunian Objects

Within the first two years of science operations, Webb took high-quality spectra of over 75 TNOs and provided the first comprehensive look at what they are made of.

A purplish-gray sphere against the backdrop of space, black with countless multicolored stars and the bright disk of the milky way. The right side of the sphere is lit up, showing a pockmarked surface (including three large craters) while the left side is in darkness.

Uncovering Icy Objects in the Kuiper Belt

Hubble observations of the outskirts of our solar system found a moon orbiting Makemake and several new moons around Pluto. These observations played a critical role in helping NASA plan the New Horizons spacecraft’s flyby of Pluto and beyond.

Trans-Neptunian Object

Hubble Harvests Distant Solar System Objects

Astronomers using clever techniques to cull the data archives of NASA’s Hubble Space Telescope have added 14 new TNOs to the catalog. 

A rock that looks like a red space snowman

Kuiper Belt: Exploration

The Kuiper Belt is a doughnut-shaped region of icy objects beyond the orbit of Neptune. It is home to Pluto and most of the known dwarf planets and some comets.


Share

Details

Last Updated
Sep 09, 2026
Editor
Andrea Gianopoulos

Contact
Media

Claire Andreoli
NASA’s Goddard Space Flight Center
Greenbelt, Maryland
claire.andreoli@nasa.gov

Ann Jenkins, Christine Pulliam
Space Telescope Science Institute
Baltimore, Maryland

NASA’s Hubble Spies Superbubble Scene

3 September 2026 at 09:16

3 min read

NASA’s Hubble Spies Superbubble Scene

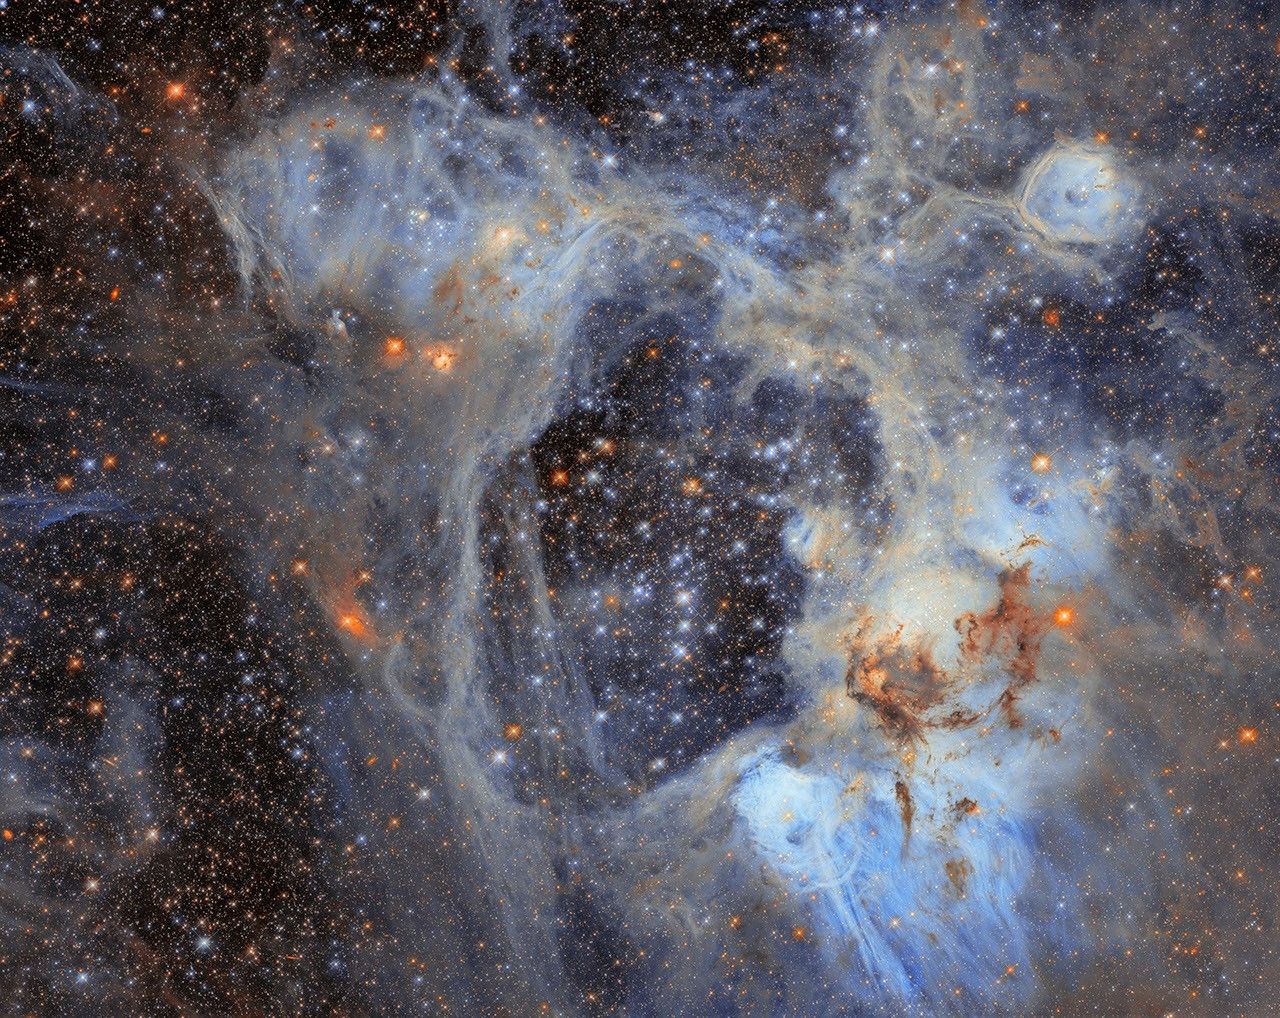
A dense field of stars fills the image, surrounded by wispy clouds of gas and dust. Pale blue and grey nebulosity forms an intricate web across the scene, with darker clouds of dust concentrated towards the lower right. Numerous bright stars appear in shades of blue, white, and orange.
This Hubble Space Telescope image features the picturesque nebula LHA 120-N44, or N44.
NASA, ESA/Hubble, D. Gouliermis

This NASA/ESA Hubble Space Telescope image features a sprawling cosmic vista in the Large Magellanic Cloud, or LMC, the largest of the small galaxies that orbit our Milky Way galaxy. At just 160,000 light-years away, the LMC offers a close look at highly active star birth sites like the one in this image. This photogenic nebula, named LHA 120-N44, or N44, is in the constellation Dorado.

N44 is dominated by two features: a vast central void and a shell of dense, dusty gas. The central void is a ‘superbubble’ spanning roughly 210 by 140 light-years across. The glittering stars at the center of the void are responsible for its creation; through their powerful stellar winds and explosive supernovae, these stars expelled much of the gas from which they were born.

When the stars of N44’s central star cluster swept away this gas, the expelled gas compressed and formed a shell around the superbubble. New stars are forming in this compressed gas shell, making N44 an interesting target for astronomers who are using the nebula to study how stars form in this environment. Their goal is to understand how long it takes from the collapse of cold gas clouds into dense knots to the moment nuclear fusion ignites in the heart of a newborn star.

The data in this image is from an observing program (#14689; PI: Gouliermis) that used Hubble to survey N44 and take a census of its stars, cataloging nearly half a million stars within the cluster as well as interlopers drifting in front of it. Of the stars surveyed, nearly 30,000 are what astronomers call pre-main-sequence stars, which have yet to begin fusing hydrogen into helium in their cores. Astronomers discovered this treasure trove of baby stars thanks to the high sensitivity and fine spatial resolution of Hubble’s instruments that can pick out faint objects in crowded clusters.

The gas shell surrounding the superbubble is energized by ultraviolet radiation from massive stars, causing it to glow and highlighting several distinct features. Each feature within the broader N44 star-forming complex was cataloged by astronomer Karl Henize in the 1950s. One feature is a smaller bubble, cataloged as N44F, that is located near the upper-right corner of this image. N44F is an interstellar bubble blown by the intense stellar winds of a single hot and massive star. As this previously released Hubble closeup shows, the star’s furious winds and radiation have sculpted the surrounding bubble and created pillars of dusty gas.

Hubble’s sensitive observations of the lowest-mass stars in this region open a new window onto star formation in regions that, like the LMC or the galaxies in the early universe, are poor in elements heavier than helium.

Text Credit: ESA/Hubble

Facebook logo
Instagram logo

Media Contact:

Claire Andreoli
NASA’s Goddard Space Flight CenterGreenbelt, MD
claire.andreoli@nasa.gov

Explore More

Download image of N44

Hubble’s Inside The Image: N44 Superbubble

In this YouTube video, Dr. Ken Carpenter takes us on a journey through the Nebula, teaching us some of the interesting science behind this famous Hubble image.

Download image of N44

Hubble Views N44 Superbubble

N44 is a complex nebula filled with glowing hydrogen gas, dark lanes of dust, massive stars, and many populations of stars of different ages. One of its most distinctive features, however, is the dark, starry gap called a “superbubble,” visible in this Hubble image in the upper central region. 

Download image of N44

Large N44 Mosaic Image

Download various sizes of Hubble’s large N44 mosaic, including a high resolution, 14,478 x 19,908 pixel (1.6 GB) image

NASA’s Hubble Tracks New Decagon Encircling Saturn’s South Pole

2 September 2026 at 14:00
 

5 min read

NASA’s Hubble Tracks New Decagon Encircling Saturn’s South Pole

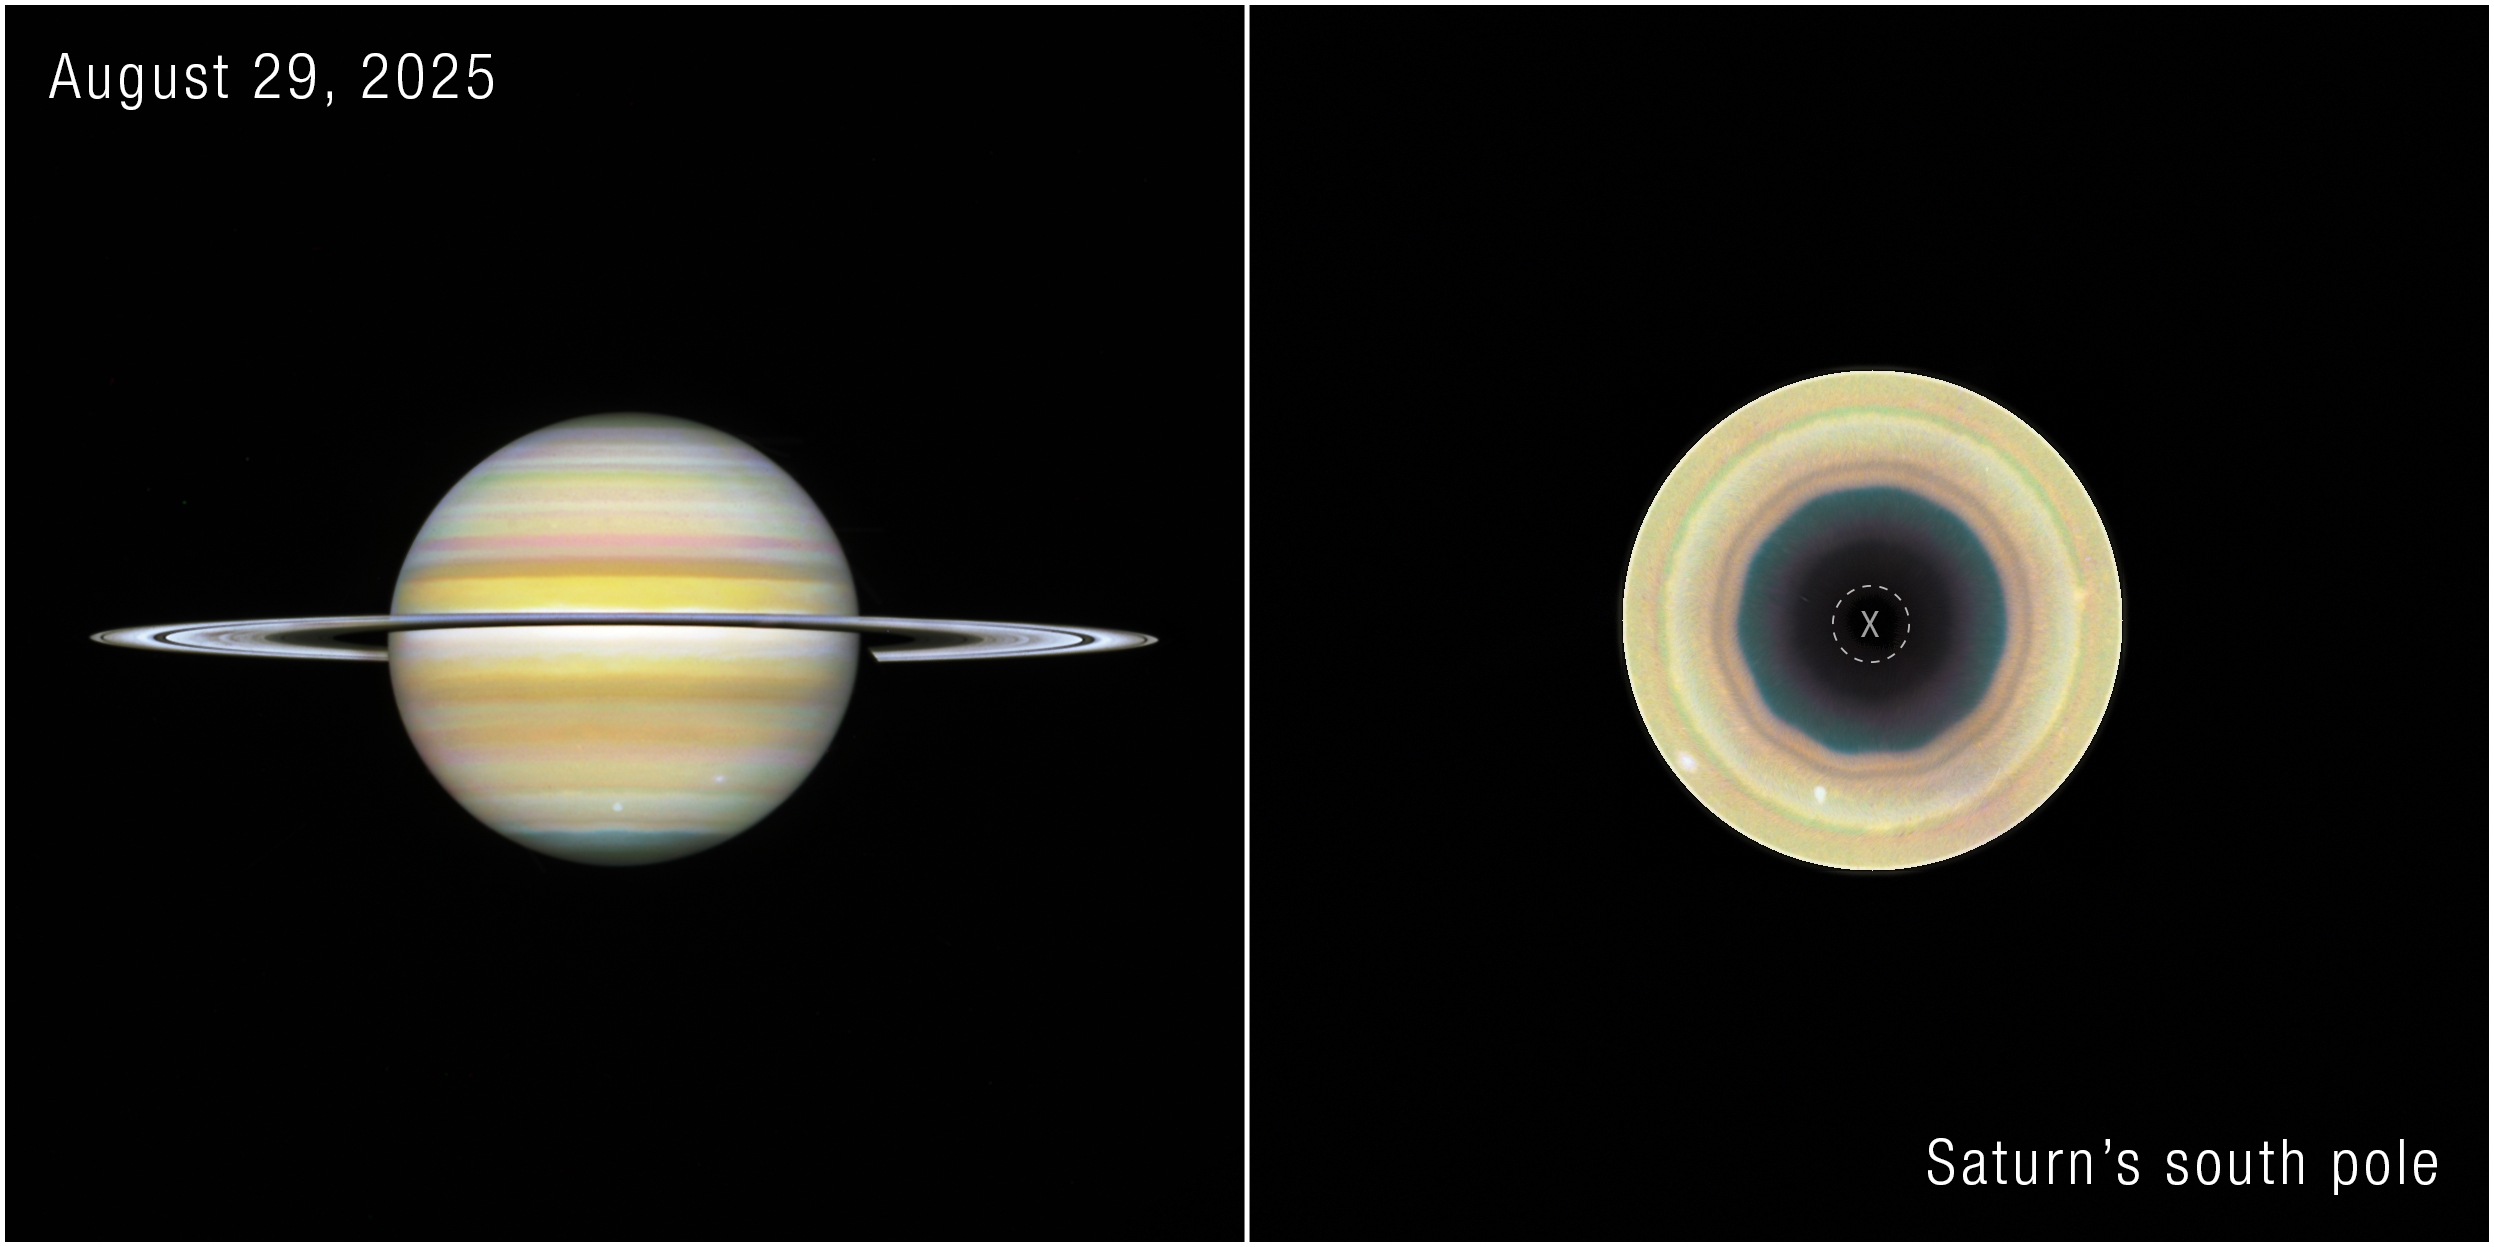
Side-by-side comparison of two views of the gas giant Saturn, labeled “August 29, 2025” at the top left corner. At left is a straight-on view of Saturn, a globe with pale yellow horizontal bands at the equator and orange and pink at the mid-latitudes. Some bands towards the north and south pole have a light blue hue. There are prominent horizontal rings circling at the equator. At right, labeled “Saturn’s south pole,” the south-polar view of Saturn shows concentric bands in its atmosphere, mostly tan and orange, surrounding a dark central region that has a 10-sided outline. A small, dashed circle at the very center of the pole with an “X” inside denotes missing data.
Recent NASA Hubble Space Telescope images show the gas giant Saturn and its southern pole, where astronomers have discovered a 10-sided atmospheric wave. Observations show the decagon extends through multiple layers of Saturn’s atmosphere.
Image: NASA, ESA, STScI, Agustin Sánchez-Lavega (UPV), Amy Simon (NASA-GSFC), Michael Wong (UC Berkeley); Image Processing: Alyssa Pagan

Recent observations with NASA’s Hubble Space Telescope have revealed a giant, evolving, 10-sided atmospheric wave encircling Saturn’s south pole. This discovery marks the first time a large, regular-sided jet pattern has been observed in the planet’s southern hemisphere. The feature appears remarkably similar to Saturn’s famous hexagon at its northern pole, but is also distinctly different, suggesting scientists may be witnessing a new atmospheric phenomenon develop on the iconic gas giant.

The results published Wednesday in the journal Science Advances. 

By piecing together several years of Hubble observations dating back to 2023, researchers found subtle hints of the structure beginning to emerge before it became a clearly defined pattern. Those observations were taken as part of Hubble’s Outer Planet Atmospheres Legacy (OPAL) program, which has photographed the outer planets annually for more than a decade

“We’ve never seen anything quite like this in Saturn’s southern hemisphere,” said Amy Simon, study co-author and OPAL principal investigator, NASA’s Goddard Space Flight Center in Greenbelt, Maryland. “The northern hexagon has been there every time we’ve looked for more than 40 years. This feature is different — it appears to be strengthening, giving us the rare opportunity to watch a giant atmospheric pattern develop.”

The discovery was possible because Saturn’s changing seasons gradually brought the planet’s south pole back into view from Earth, where astronomers who collectively analyze images of Saturn from ground-based observatories first identified it.

Agustín Sánchez-Lavega, lead author of the new study, is a researcher at the University of the Basque Country in Spain. The university manages a website, called Planetary Virtual Observatory Laboratory, that accepts ground-based images of solar system planets contributed by observers all over the world. It was in those images, first in 2024, that Sánchez-Lavega and amateur astronomers Trevor Barry and Jean-Paul Oger noticed a subtle undulating band along the southern pole. Additional 2025 imagery taken from the ground hinted even more strongly toward this decagon structure.

That’s when the Hubble observations come into the picture. Hubble’s view from space offers unmatched image sharpness and spatial resolution over full rotations of Saturn, without smearing by Earth’s atmosphere. 

“Given Saturn’s symmetry in its north-south jet stream system, we have been searching for a counterpart to Saturn’s northern hexagon on the south pole in Hubble images since 1990,” Sánchez-Lavega said. “Images from NASA’s Cassini spacecraft, which orbited Saturn between 2004 and 2017, showed no inkling of a long-lived formation, either. The Hubble data confirmed the feature’s presence back to 2023.”

A black and white view of Saturn’s south pole, labeled “August 29, 2025” and “F763M.” The south-polar view of Saturn shows concentric bands of its atmosphere, transitioning from bright outer bands to a dark central region outlined in a 10-sided pattern. This outline is labeled “decagon.” A small, dashed circle at the very center of the pole with an “X” inside denotes missing data.
A single filter from NASA’s Hubble Space Telescope distinctly shows a 10-sided wave encircling Saturn’s south pole, labeled “decagon”. An “X” denotes where data was not captured.
Image: NASA, ESA, STScI, Agustin Sánchez-Lavega (UPV), Amy Simon (NASA-GSFC), Michael Wong (UC Berkeley); Image Processing: Alyssa Pagan

The wave sits within one of Saturn’s powerful jet streams and extends through multiple layers of the atmosphere, indicating it is not just a cloud-level feature, but a vertically extended atmospheric structure. The decagon’s apparent position shifts slightly, because Hubble captures images from different wavelengths. Those different wavelengths probe different altitudes in Saturn’s atmosphere.

“The most intriguing part to me is that this seems to have just formed recently,” said Simon. “The question is, why did it suddenly form now when we haven’t seen one before?” 

The authors say further study is needed from Hubble and NASA’s James Webb Space Telescope, as well as analysis of computer models, to understand how the decagon formed, how long it may last, and how it compares to the long-lived hexagon in the north.

Hubble’s long duration in operation has allowed astronomers to track changes over time in solar system planets and other astronomical objects as well.

Rather than providing a single snapshot, the OPAL program allows scientists to follow seasonal changes, track short-lived storms, and identify other atmospheric features that evolve slowly over time.

“When we started the OPAL program, we expected compelling surprises, but we didn’t know what to expect specifically,” said Mike Wong, study co-author, University of California, Berkeley. “A lot of the discoveries we see coming from OPAL are not just based on one observation, but on years and years of data. Regular observations over time are enabling a lot of new findings.”

The team plans to continue observing Saturn to determine whether the decagon settles into a long-lived, stable configuration like the northern hexagon or continues to evolve. Future observations also could help scientists determine what drives the wave, what it reveals about the atmospheric dynamics of giant planets throughout the solar system, and how they may relate to those we see here on Earth.

The Hubble Space Telescope has been operating for more than three decades and continues to make ground-breaking discoveries that shape our fundamental understanding of the universe. Hubble is a project of international cooperation between NASA and ESA (European Space Agency). NASA’s Goddard Space Flight Center in Greenbelt, Maryland, manages the telescope and mission operations. Lockheed Martin Space also supports mission operations at Goddard. The Space Telescope Science Institute in Baltimore, which is operated by the Association of Universities for Research in Astronomy, conducts Hubble science operations for NASA.

Facebook logo
Instagram logo

Related Images & Videos

Side-by-side comparison of two views of the gas giant Saturn, labeled “August 29, 2025” at the top left corner. At left is a straight-on view of Saturn, a globe with pale yellow horizontal bands at the equator and orange and pink at the mid-latitudes. Some bands towards the north and south pole have a light blue hue. There are prominent horizontal rings circling at the equator. At right, labeled “Saturn’s south pole,” the south-polar view of Saturn shows concentric bands in its atmosphere, mostly tan and orange, surrounding a dark central region that has a 10-sided outline. A small, dashed circle at the very center of the pole with an “X” inside denotes missing data.

Decagon on Saturn’s South Pole (Color)

Recent NASA Hubble Space Telescope images show the gas giant Saturn and its southern pole, where astronomers have discovered a 10-sided atmospheric wave. Observations show the decagon extends through multiple layers of Saturn’s atmosphere.

A black and white view of Saturn’s south pole, labeled “August 29, 2025” and “F763M.” The south-polar view of Saturn shows concentric bands of its atmosphere, transitioning from bright outer bands to a dark central region outlined in a 10-sided pattern. This outline is labeled “decagon.” A small, dashed circle at the very center of the pole with an “X” inside denotes missing data.

Decagon on Saturn’s South Pole (Single Filter)

A single filter from NASA’s Hubble Space Telescope distinctly shows a 10-sided wave encircling Saturn’s south pole, labeled “decagon”. An “X” denotes where data was not captured.


Share

Details

Last Updated
Sep 02, 2026
Editor
Andrea Gianopoulos
Contact
Media

Claire Andreoli
NASA’s Goddard Space Flight Center
Greenbelt, Maryland
claire.andreoli@nasa.gov

Hannah Braun
Space Telescope Science Institute
Baltimore, Maryland

NASA Rocket Takes First Multi-Point Look Inside Radio-Disrupting Clouds

2 September 2026 at 10:53

High above Earth, thin veils of metallic haze drift through the edge of space. Known as sporadic E layers, these high-altitude “clouds” form from the vaporized dust of burnt-up meteors, earning their name from the unpredictable way they emerge and then dissipate. Now, new results from a NASA sounding rocket — a suborbital research rocket — that flew five detectors through one of these layers simultaneously reveal unexpected complexity in the layer for the first time.

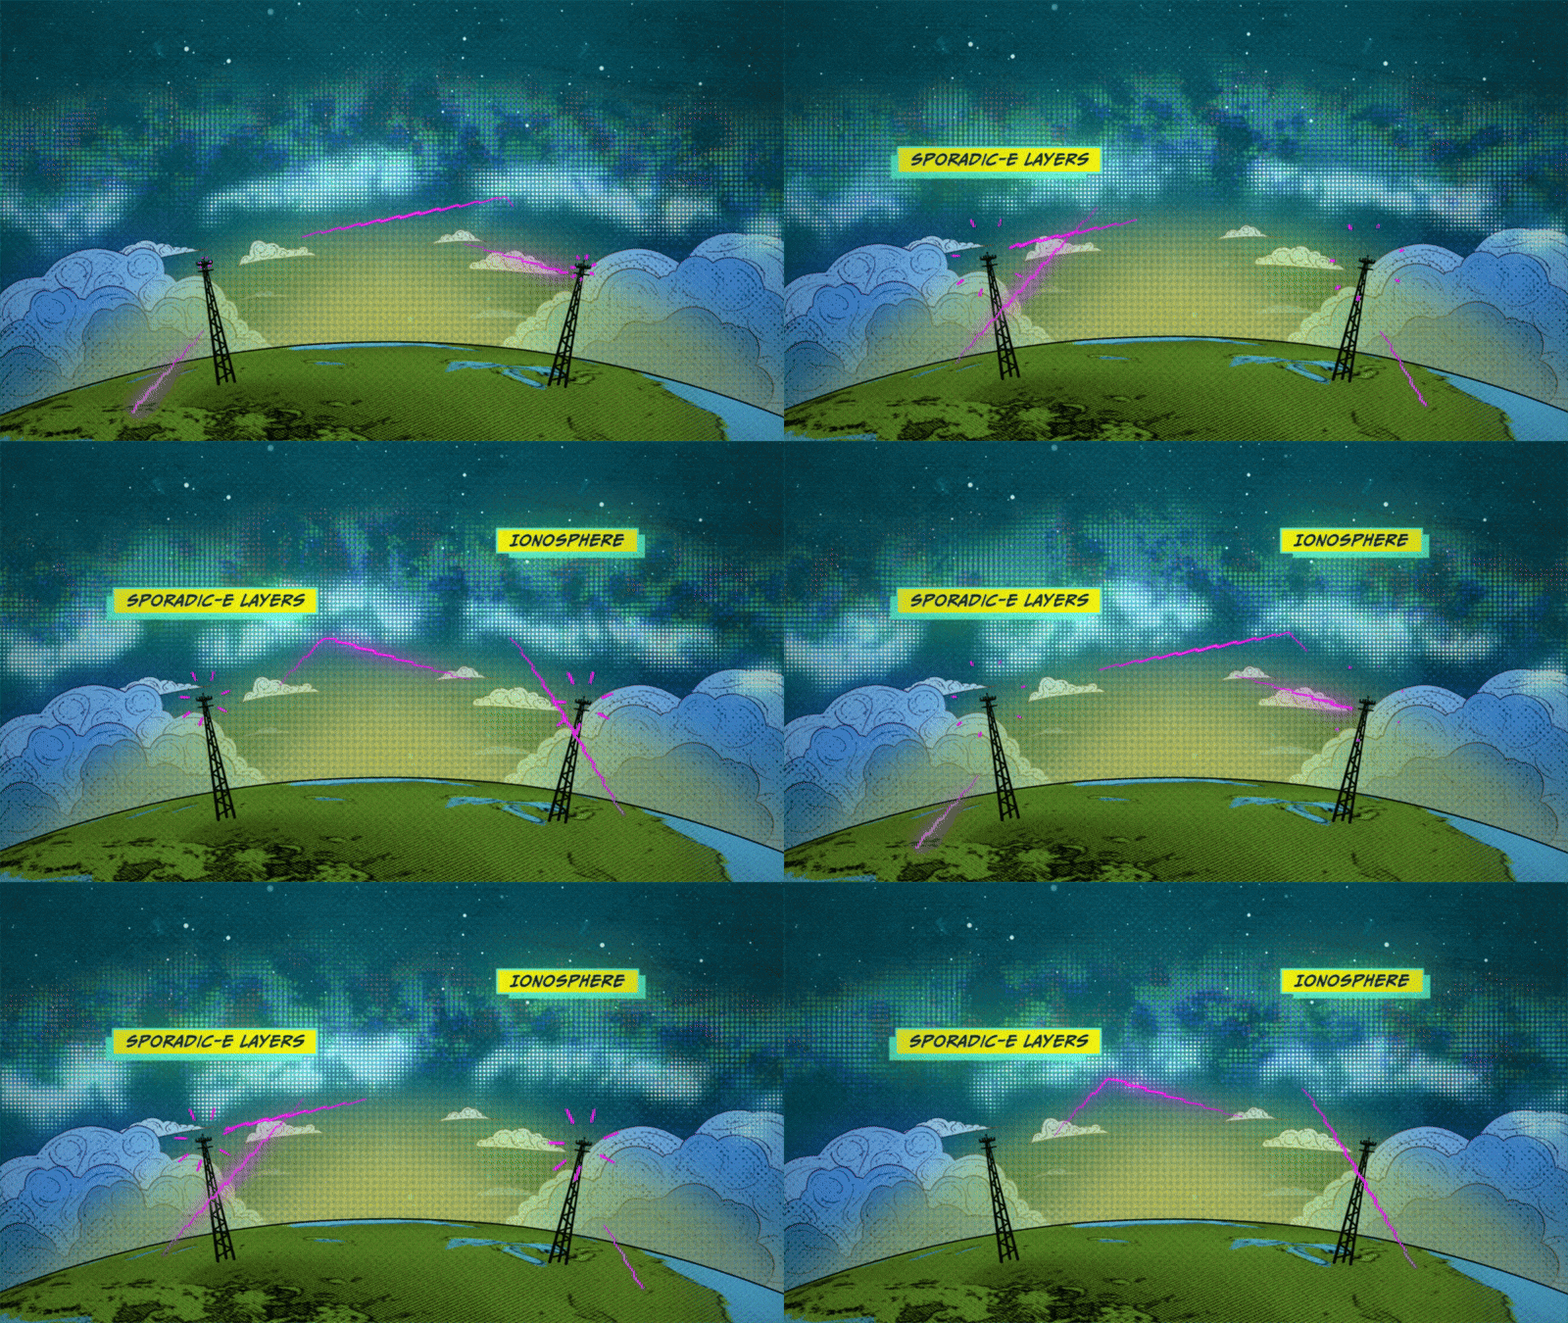
Though invisible to the eye, sporadic E layers make their presence known to the radio signals we rely on for long-distance communication. When present, sporadic E can send those signals ping-ponging off in unexpected directions, rendering the technology temporarily unreliable.

Scientists have long sought a fuller understanding of these radio-disrupting clouds, but until recently, they had only sampled them one narrow slice at a time. The rocket, called the sporadic E Electrodynamics Demonstration, or SpEED Demon for short, launched from NASA’s Wallops Flight Facility in Virginia on Aug. 24, 2022, and demonstrated the first concurrent, multi-point view inside sporadic E.  Its results, from a team led by Embry-Riddle Aeronautical University, are described in a new study in the Journal of Geophysical Research: Space Physics.

Sporadic E layers form in the ionosphere, a region of the upper atmosphere beginning around 40 miles (60 kilometers) up where the neutral gases begin to transform into plasma, or ionized gas. Some of the particles there come from meteors, which burn up and leave behind traces of iron, magnesium, and other metals. These metals occasionally clump into dense, cloud-like sheets — the sporadic E layers — that reflect radio waves.

Digital illustration of a curved Earth with green land and blue clouds representing sporadic E layers. Two communication towers stand on the surface, sending and receiving zig-zagging magenta beams of radio signals against a starry, glowing dark blue nebula sky. Two labels appear, sporadic e layers (on the clouds) and ionosphere, above the clouds, representing the intended target of the radio beams.
An animated illustration depicts Sporadic-E layers forming in the lower portions of the ionosphere, causing radio signals to reflect back to Earth before reaching higher layers of the ionosphere.
NASA’s Goddard Space Flight Center/Conceptual Image Lab

“Sporadic E layers are, in one sense, giant mirrors of radio frequency waves in the sky,” said Aroh Barjatya, the mission’s principal investigator and a professor of engineering physics at Embry-Riddle in Daytona Beach, Florida.

When a sporadic E layer forms, signals meant to travel out to space can ricochet back toward the ground. Air traffic controllers and marine radio users may pick up distant transmissions as though they were nearby, and radars scanning beyond the horizon can register so-called “ghosts,” or false targets. The effects reach everyday technology, too.

“The biggest source of error in the GPS in your phone, for example, is from the plasma in the ionosphere, and sporadic E layers can contribute to this uncertainty,” said Henry Valentine, the study’s lead author, who conducted the work at Embry-Riddle and is now a researcher at the U.S. Naval Research Laboratory.

Because sporadic E layers hover around 60 miles (100 kilometers) up—too high for weather balloons, too low for satellites — and form and dissipate unpredictably, they have long been the province of sounding rockets, which can be launched on short notice to catch one in the act. But a single rocket flies a single path, taking measurements only along a line. Barjatya likens the situation to viewing a scene through a crack in a wall. One can only observe what is happening along that narrow slit, missing out on the crucial context of whatever is occurring to the left or right of one’s view.

The SpEED Demon mission changed that. The mission was the first to deploy ejectable probes, called dropsondes, inside a sporadic E layer. Once inside, the rocket released four dropsondes that flew away from the main payload and from one another, each measuring the plasma along its own track and beaming its measurements back to ground stations. Together with the main payload, the probes sampled the layer in a total of five places at the same moment.

A group of people in blue lab coats stands around a tall, metallic rocket component inside an industrial facility with beige protective curtains.
The SpEED Demon team poses with payload section during testing at NASA’s Wallops Flight Facility.
NASA Wallops/Berit Bland

“Now with multiple sensors, we’ve turned that crack into a picket fence,” Barjatya said.

The data revealed surprising complexity inside the sporadic E layer. Rather than a smooth, dense pancake of metallic particles, the layer that SpEED Demon flew through appeared uneven and structured, shaped by turbulent winds moving through the neutral air around it.

“A lot of times you think of sporadic E as this single sharp density layer, but what we saw in ours is it’s interacting with neutral wind and these swirling atmospheric turbulences,” Valentine said. “Rather than a flat pancake, it’s closer to a cinnamon roll.”

On the way down, the layer even split into two distinct peaks. The team found that shape was consistent with modulation by Kelvin-Helmholtz billows, the curling, wave-like instability that produces breaking-wave patterns in ordinary clouds. Because the flight was unable to measure the local winds and electric fields directly, the researchers are careful to call the billow explanation plausible rather than confirmed.

The SpEED Demon mission was designed as a technology demonstration — a test of whether the dropsonde technique would work at all. It did, and the team was quick to apply it again. Barjatya’s team used a similar multi-probe strategy to launch rockets into the paths of the October 2023 annular eclipse and April 2024 total solar eclipse, studying how the sudden darkness disturbed the upper atmosphere. In June 2025, they flew SpEED Demon’s most direct descendant, Sporadic-E ElectroDynamics, or SEED, into sporadic E layers from Kwajalein Atoll in the Marshall Islands, studying them at lower latitudes. Papers from those missions are in preparation.

A rocket launches at night, surrounded by bright flames and smoke, with a tall supporting structure visible and the dark sky in the background.
A sounding rocket launch testing science instruments for future missions was successfully conducted at 9:16 p.m. EDT, Aug. 23, 2022, from NASA Wallops Flight Facility in Virginia.
NASA

After years of study, sporadic E layers are no longer as unpredictable as they once were. “They have a seasonality to them, with peak occurrence happening in the local summer,” Barjatya said.

Questions about how and when they form are increasingly fine-grained. The new deployable multi-point rocket sensor methodology, along with ground-based measurements, is likely to bring the picture even closer to completion. “The science community as a whole is now in its final stretches of fully understanding these giant radio frequency mirrors in the sky,” Barjatya said.

By Miles Hatfield 
NASA’s Goddard Space Flight Center, Greenbelt, Md. 

About the Author

Miles Hatfield

Miles Hatfield

Keep Exploring

Discover More Topics From NASA

NASA Selects Blue Origin as Mars Telecommunications Network Provider

1 September 2026 at 17:08
NASA insignia.
Credit: NASA

NASA awarded Blue Origin a contract Tuesday to develop the agency’s Mars Telecommunications Network, a next-generation communications system that will enable reliable, high-bandwidth communications and navigation services for current and future Mars missions.

The firm-fixed-price contract has a maximum potential value of approximately $700 million to deliver a high-performance Mars telecommunications orbiter to NASA no later than Dec. 31, 2028.

Blue Origin will design, develop, integrate, launch, and operate the network as a part of the agency’s broader space communications and navigation infrastructure. The architecture will consist of a high-performance telecommunications spacecraft orbiting Mars, transmitting science data, imagery, navigation information, and critical mission communications for spacecraft operating on and around the planet.

The award marks a milestone in NASA’s strategy to expand communications and navigation services beyond Earth and the Moon, establishing the foundation for sustained exploration of Mars in the coming decades.

Under the Artemis program, NASA is sending astronauts to explore the Moon and prepare for missions to Mars. Robotic missions will pave the way for human exploration of the Red Planet, and as these missions expand, demand for data will continue to increase. To meet this need, NASA is pursuing a purpose-built network capable of supporting a growing number of missions while providing greater capacity, reliability, and operational flexibility.

The selection follows NASA’s request for proposal issued in May. As the agency increasingly taps commercial partners for transportation and communications services in Earth orbit and to develop the Moon Base, the Mars Telecommunications Network initiative similarly seeks to harness private-sector capabilities while enabling NASA to focus on exploration and scientific discovery.

The network, managed by NASA’s Space Communications and Navigation program, is expected to be operational at Mars by 2030 and will support both current and future missions to the Red Planet, as NASA ventures deeper into space.

For more information about NASA’s space communications efforts, visit:

https://www.nasa.gov/communicating-with-missions

-end-

Rob Margetta
Headquarters, Washington
202-358-0918
robert.j.margetta@nasa.gov

Rob Garner
Goddard Space Flight Center, Greenbelt, Md.
301-286-5687
rob.garner@nasa.gov

NASA’s Dark Universe-Seeking Nancy Grace Roman Space Telescope Launches

30 August 2026 at 09:18
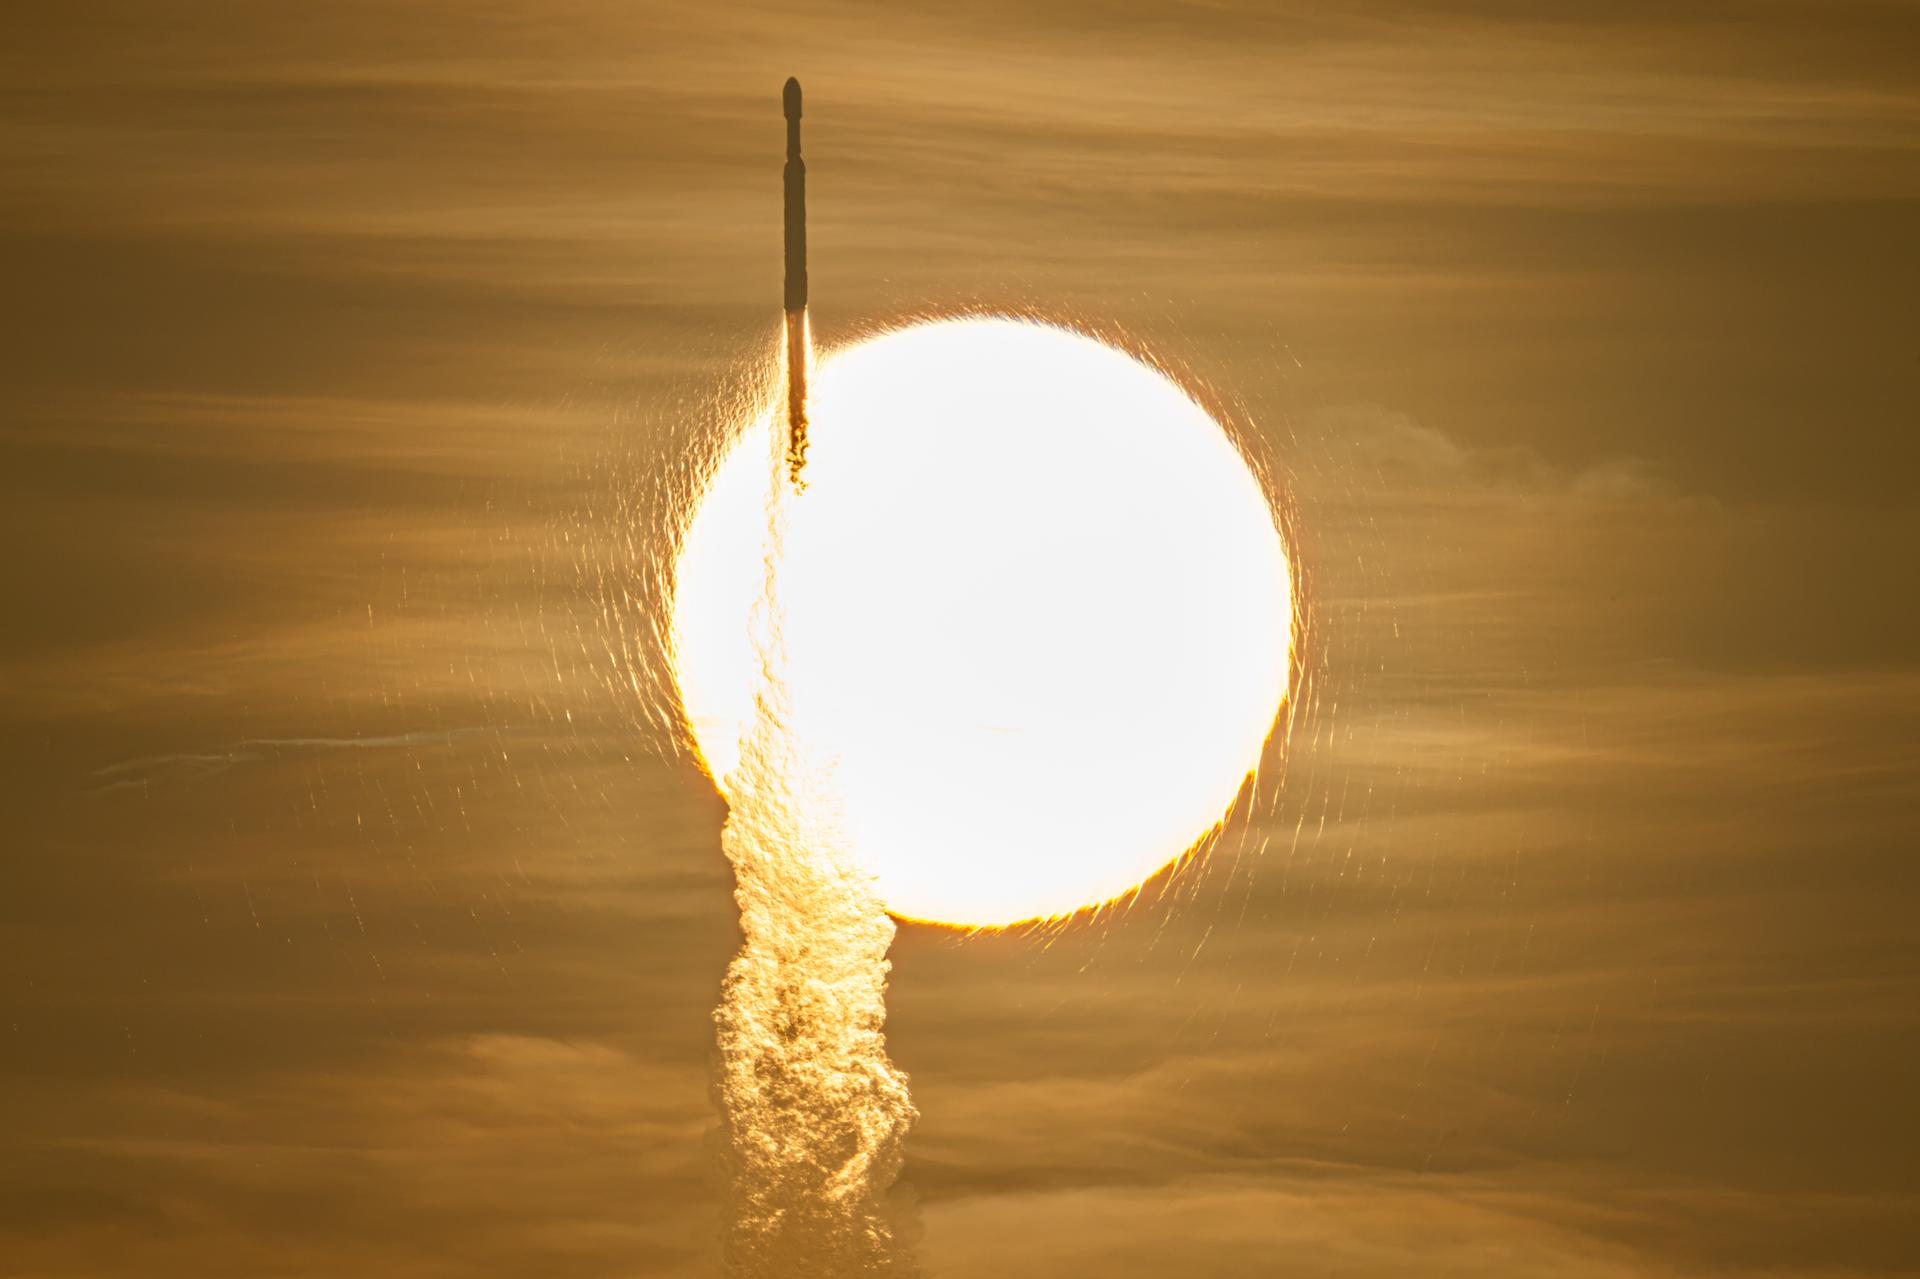
A SpaceX Falcon Heavy rocket with NASA’s Nancy Grace Roman Telescope on board is seen transiting the sun during launch from Launch Complex 39A, Sunday, Aug. 30, 2026, at NASA’s Kennedy Space Center in Florida.
NASA/John Kraus

Now on a three-month, million-mile journey to its final orbit, NASA’s Nancy Grace Roman Space Telescope will soon reveal the universe’s darkest secrets. The mission launched at 7:26 a.m. EDT Sunday aboard a SpaceX Falcon Heavy rocket from Launch Complex 39A at the agency’s Kennedy Space Center in Florida.

Roman pairs a large field of view with crisp infrared vision to explore vast swaths of the sky and probe deeply into cosmic history. This flagship mission will help astronomers explore dark matter, dark energy, and worlds outside of our solar system, known as exoplanets. Its surveys will support a broad range of research extending far beyond the mission’s main science goals.

“Roman is exactly the kind of success story we want to see across NASA,” said NASA Administrator Jared Isaacman. “Delivered ahead of schedule and on budget, this mission reflects more than a decade of dedication from the NASA workforce and our industry partners. Now, Roman will give us a new atlas of the universe, push the boundaries of discovery, and demonstrate what is possible when America’s space program pairs bold ambition with disciplined execution.”

The ground control team at NASA’s Goddard Space Flight Center in Greenbelt, Maryland, began receiving telemetry data from Roman seven minutes after launch. The Falcon Heavy rocket performed as expected, separating from the observatory 31 minutes into the flight. After separating from the center core, the rocket’s boosters safely returned to the launch site for refurbishment.

“Roman will be a discovery machine that will bring us closer than ever before to answering humanity’s most profound questions about our cosmic history,” said Nicky Fox, associate administrator for the Science Mission Directorate at NASA Headquarters in Washington. “With its large field of view and fast survey speeds, Roman will usher us into a new era of discovery and make the invisible visible, setting the foundation for humanity’s search for life beyond our solar system.”

During launch and early orbit, Roman uses the Near Space Network’s ground stations and relay satellites to exchange tracking, telemetry, and command data with ground controllers. About 70 minutes after launch, the Deep Space Network takes over communications and guides Roman toward the second Sun-Earth Lagrange point, or L2, about one million miles from Earth. Roman connects to that network through the Canberra Deep Space Communication Complex in Australia first. Approximately six hours later it will transfer to the Madrid Deep Space Communication Complex in Spain and then to the Goldstone Deep Space Communication Complex in California, ensuring continuous contact with Roman throughout its journey.

The Roman team also confirmed successful deployment of the observatory’s solar panels and lower instrument sun shade an hour and 23 minutes after launch. Within the upcoming days, Roman’s high-gain antenna and visor-like deployable aperture cover will deploy, ground controllers will initiate the first of two-mid-course corrections, and the Coronagraph Instrument will power on. This instrument will demonstrate the technology that future missions like NASA’s Habitable Worlds Observatory concept could use to image Earth-like planets in the search for life in the universe. Roman’s Coronagraph will take a giant step in that direction by snapping pictures of Jupiter-like planets.

A few weeks into Roman’s voyage, its primary instrument, the Wide Field Instrument, will activate. This 300-megapixel infrared camera has 18 4K detectors, each about the size of a saltine cracker. These detectors collect photons of light that will be decoded into crisp cosmic panoramas. Thanks to the observatory’s rigid design and stable optical performance, it will rapidly scan the sky without needing substantial time between separate observations. The Roman telescope is designed to survey the universe a thousand times faster than NASA’s Hubble Space Telescope.

Throughout the rest of Roman’s three-month commissioning period, scientists will run the instruments through a series of calibrations and tests. NASA anticipates releasing Roman’s first images by early 2027.

Roman will send back 1.4 terabytes of data every day, the highest data rate of any NASA astrophysics mission, so far. Machine learning, artificial intelligence, and citizen scientists will help sift through it and flag significant findings, which astronomers can then study.

“We’ve never been able to view the universe with eyes like Roman’s before,” said Julie McEnery, Roman’s senior project scientist at NASA Goddard. “There’s no telling what more we’ll know and have seen by this time next year.”

Roman is the fourth primary mission NASA has launched on a Falcon Heavy rocket. Earlier this year, the agency’s Launch Services Program worked with SpaceX to accelerate the launch date to accommodate the space telescope’s early completion.

The telescope is managed at NASA Goddard with participation by the agency’s Jet Propulsion Laboratory in Southern California; Caltech/IPAC in Pasadena, California; the Space Telescope Science Institute in Baltimore; and a team of scientists from various research institutions. The primary industrial partners are BAE Systems Inc., L3Harris Technologies, and Teledyne Scientific & Imaging. Contributions to Roman also are made by ESA, JAXA, the French space agency CNES (Centre National d’Études Spatiales), and the Max Planck Institute for Astronomy in Germany.

To learn more about the Roman mission, visit:

https://www.nasa.gov/roman

-end-

George Alderman / Alise Fisher
Headquarters, Washington
202-358-1600
george.a.alderman@nasa.gov / alise.m.fisher@nasa.gov

Claire Andreoli
Goddard Space Flight Center, Greenbelt, Md.
202-286-1940
claire.andreoli@nasa.gov

NASA’s Pandora Mission Begins Study of Exoplanets, Host Stars

25 August 2026 at 13:55

5 min read

NASA’s Pandora Mission Begins Study of Exoplanets, Host Stars

Pandora, NASA’s newest exoplanet mission and the first satellite to launch through the agency’s Astrophysics Pioneers program, is now making unique observations of worlds beyond our solar system and the stars they orbit. The mission will determine the atmospheric make-up of at least 20 exoplanets, including the presence of hazes, clouds, and water.

“Pandora’s data will help close a major gap in our knowledge about planets and their host stars because, right now, we can’t be entirely sure how the star’s light affects measurements of what makes up exoplanet atmospheres,” said Elisa Quintana, Pandora’s principal investigator at NASA’s Goddard Space Flight Center in Greenbelt, Maryland. “We designed the Pandora spacecraft and its in-depth observing program to better understand this vexing issue.”

The Pandora spacecraft with an exoplanet and two stars in the background
Artist’s concept of NASA’s Pandora mission, which will help scientists untangle the signals from exoplanets’ atmospheres and their stars.
NASA’s Goddard Space Flight Center/Conceptual Image Lab

The results of the mission will lay a firm foundation for interpreting measurements by NASA’s James Webb Space Telescope, as well as future observatories focused on finding habitable worlds. In fact, Pandora’s near-infrared detector is a spare originally developed for Webb.

“The spacecraft is healthy and all of the instruments are performing as well as we could have hoped,” said Jordan Karburn, Pandora’s deputy project manager at Lawrence Livermore National Laboratory in California. “Our team’s hard work throughout the commissioning process has paid off, and we can now confidently start science.”

Pandora mission explainer infographic
This artist’s concept summarizes NASA’s Pandora mission and its science goals. Pandora will repeatedly observe multiple planets and their host stars in both visible and near-infrared light. These measurements will enable astronomers to separate chemical fingerprints detected in a planet’s atmosphere from potentially misleading signals originating from its host star.
NASA/Sophia Roberts

Launched into low Earth orbit on Jan. 11, Pandora is an ambitious small satellite (SmallSat) funded by NASA’s Astrophysics Pioneers program. Pioneers are designed to explore compelling questions about the universe with fast-paced, low-cost missions that require a higher-than-usual tolerance for failure. 

Three factors make Pandora unique. It carries a novel all-aluminum telescope about 18 inches (45 centimeters) in diameter, it will study planets and their host stars simultaneously in both visible and infrared light, and it will observe targets for a much longer time than flagship observatories like Webb are able to.

Telescopes can sample a planet’s atmosphere in systems where the planet passes in front of its star as seen from our perspective. During this event, called a transit, some starlight skims the planet’s atmosphere before making its way to us. As this light interacts with atmospheric molecules, their chemical fingerprints become embedded in it. For each molecule, astronomers see brightness dips at characteristic wavelengths. 

But our instruments also see light from the whole star, not just what grazes the planet. Stellar surfaces aren’t uniform. They sport hotter, brighter areas called faculae and cooler, darker regions similar to sunspots. Both can grow, shrink, and change position as the star rotates.

“Water is one of the most important molecules we can measure to understand the composition and physical conditions of an exoplanet atmosphere,” said Benjamin Rackham, a team member at the Massachusetts Institute of Technology in Cambridge. “But features on the star can distort the water signal we’re searching for. Pandora is designed to disentangle the signals from the planet and the star, helping us to understand the planets more accurately and laying the groundwork for the eventual study of planets that could harbor life.”

Watch to learn more about NASA’s Pandora mission, which will revolutionize the study of exoplanet atmospheres.
NASA’s Goddard Space Flight Center

Pandora’s telescope, jointly developed by Livermore and Corning Specialty Materials in Keene, New Hampshire, and its detectors make up the mission’s heart. The detectors will capture the star’s brightness in visible light and its near-infrared spectrum at the same time, while also obtaining a near-infrared spectrum from the planet when it transits the star. Over the course of its year-long primary mission, Pandora will observe at least 20 exoplanets 10 times with a long-duration stare covering 24 hours, with a transit included in each observation.

“Pandora’s advantage is its ability to observe targets for extended periods at multiple wavelengths, something high-demand flagship missions like Webb cannot regularly do,” said Knicole Colón, the mission’s project scientist at NASA Goddard. “Combining Pandora and Webb data will uniquely enable scientists to determine the properties of stellar surfaces and cleanly separate star and planetary signals.”

Pandora is led by NASA’s Goddard Space Flight Center. Lawrence Livermore National Laboratory provides the mission’s project management and engineering. Pandora’s telescope was manufactured by Corning and developed collaboratively with Livermore, which also developed the imaging detector assemblies, the mission’s control electronics, and all supporting thermal and mechanical subsystems. The infrared sensor was provided by NASA Goddard. Blue Canyon Technologies provided the bus, performed spacecraft assembly, integration and environmental testing, and is providing mission operations support. NASA’s Ames Research Center in California’s Silicon Valley performs the mission’s data processing. Pandora’s science data is available at the NASA Exoplanet Archive, which is operated by IPAC at the California Institute of Technology in Pasadena. The University of Arizona leads mission operations for Pandora and contributes to its science program. Many additional universities also support the science team.

To learn more about the Pandora mission, please visit:

https://science.nasa.gov/mission/pandora/

Facebook logo
Instagram logo

Share

Details

Last Updated
Aug 25, 2026
Editor
Francis Reddy
Contact

NASA Sets Coverage for Roman Space Telescope Launch from Florida

24 August 2026 at 16:44
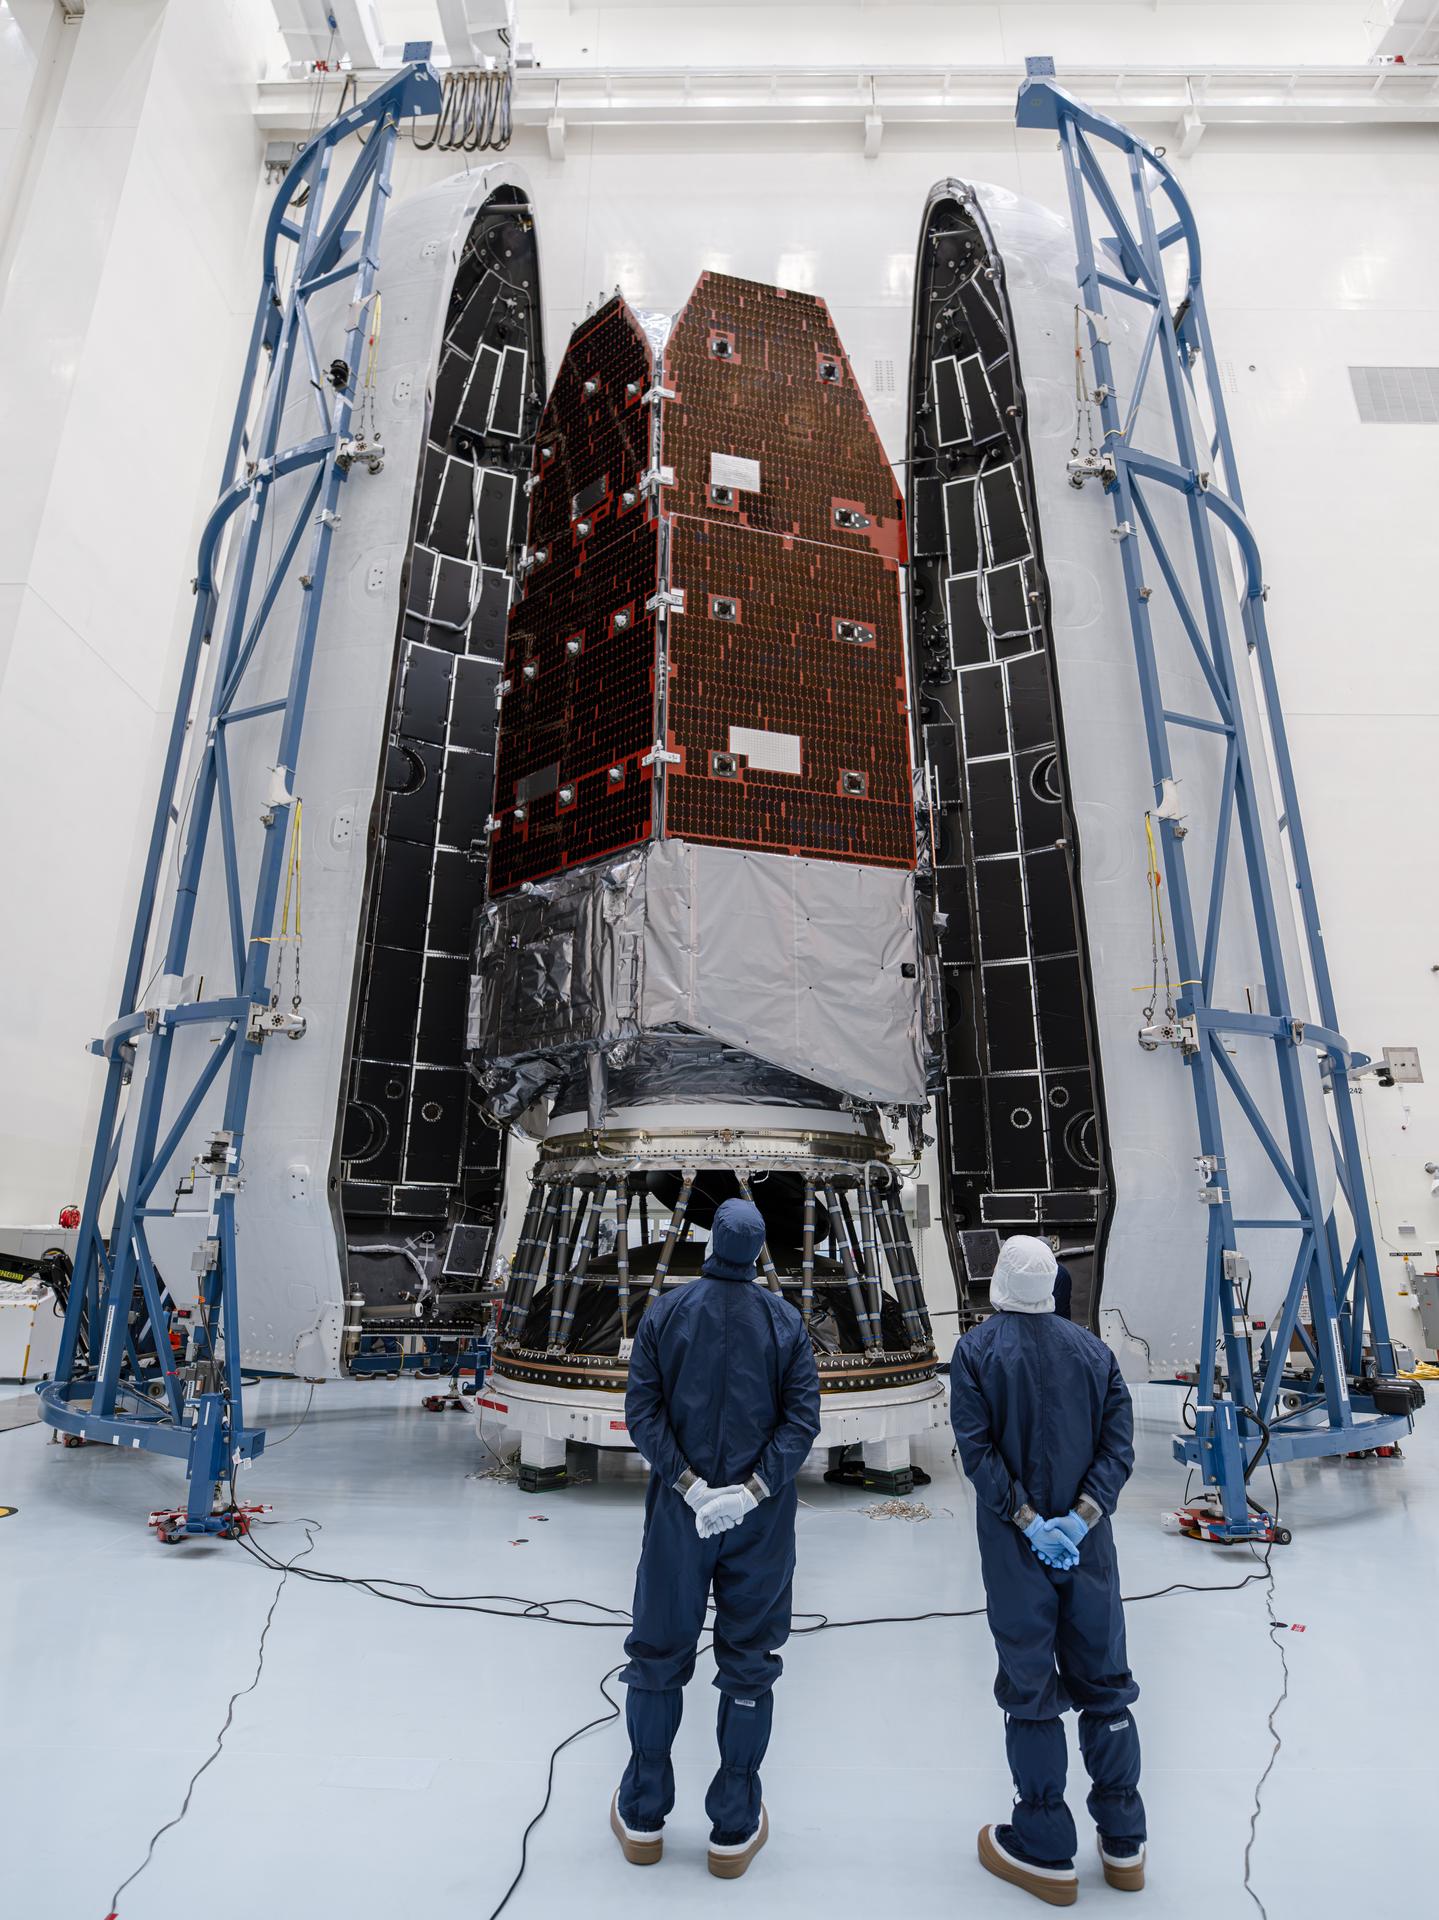
NASA’s Nancy Grace Roman Space Telescope is encapsulated within the payload fairing at the agency’s Kennedy Space Center in Florida, ahead of mating to a SpaceX Falcon Heavy rocket for launch.
Credit: NASA/Sydney Rohde (Rocz)

Coverage plans are ready for NASA’s Nancy Grace Roman Space Telescope prelaunch and launch activities. Roman is NASA’s next-generation observatory designed to explore some of the universe’s biggest mysteries, including dark energy.

NASA and SpaceX are targeting Roman’s liftoff for no earlier than 7:26 a.m. EDT Sunday, Aug. 30, aboard a SpaceX Falcon Heavy rocket from Launch Complex 39A at the agency’s Kennedy Space Center in Florida. Launch coverage begins at 6:20 a.m.

Live coverage of these events will stream through a variety of platforms. Learn where to watch online:

https://www.nasa.gov/live

Named for NASA’s first chief astronomer, the Nancy Grace Roman Space Telescope will pair sharp infrared vision with a field of view at least 100 times larger than the agency’s Hubble Space Telescope. Its crisp, sweeping surveys will help scientists investigate dark energy and dark matter, discover and characterize exoplanets, map billions of galaxies, study black holes, and explore objects from our own solar system to the edge of the observable universe.

After launch and separation from the rocket, Roman will travel to the second Sun-Earth Lagrange point, or L2, about one million miles from Earth. The mission has a five-year primary lifetime with a goal of operating for 10 years, and Roman’s science data will be publicly available after processing.

NASA’s mission coverage is as follows (all times are Eastern and subject to change based on real-time operations):

Saturday, Aug. 29

9 a.m.: NASA’s Roman Space Telescope Mission Science Briefing: The briefing will take place in the NASA Kennedy Press Site auditorium with the following participants:

  • Shawn Domagal-Goldman, director, Astrophysics Division, NASA Headquarters
  • Julie McEnery, Roman telescope senior project scientist, NASA Goddard Space Flight Center
  • Vanessa Bailey, Roman Coronagraph Instrument scientist, NASA Jet Propulsion Laboratory
  • Kristen McQuinn, Roman Science Operations Center lead, Space Telescope Science Institute
  • Lee Armus, Roman Science Support Center lead, Caltech/IPAC

Media may ask questions in person or by phone. Limited auditorium space will be available for in-person participation. For the dial-in number and passcode, media should contact the NASA Kennedy newsroom no later than one hour before the briefing at: ksc-newsroom@mail.nasa.gov.

10:30 a.m.: NASA’s Roman Space Telescope Prelaunch News Conference: The news conference will take place in the NASA Kennedy Press Site auditorium with the following participants:

  • Nicky Fox, associate administrator, Science Mission Directorate, NASA Headquarters
  • Lucas Paganini, Roman telescope program executive, NASA Headquarters
  • Jackie Townsend, Roman telescope project manager, NASA Goddard
  • Denton Gibson, launch director, NASA’s Launch Services Program, NASA Kennedy
  • Julianna Scheiman, director, NASA Science and Dragon Programs, SpaceX
  • Justin McReynolds, launch weather officer, 45th Weather Squadron, U.S. Space Force

Media may ask questions in person or by phone. Limited auditorium space will be available for in-person participation. For the dial-in number and passcode, media should contact the NASA Kennedy newsroom no later than one hour before the briefing at: ksc-newsroom@mail.nasa.gov.

11:45 a.m.: NASA Administrator Jared Isaacman is expected to fly past the Nancy Grace Roman Space Telescope and Falcon Heavy rocket on the launchpad in his jet. The flyby will be shown live on the same stream as the prelaunch news conference, with a view of the launch pad during the transition. The flyby is subject to weather and operational considerations.

12 p.m.: In-person interviews will take place in the NASA Kennedy Press News Center:

  • Nicky Fox, associate administrator, Science Mission Directorate, NASA Headquarters
  • Lucas Paganini, Roman telescope program executive, NASA Headquarters
  • Dalia Kirschbaum, acting director, Sciences and Exploration Directorate, NASA Goddard
  • Josh Schlieder, Roman telescope project scientist, NASA Goddard
  • Jason Hylan, Roman telescope flight segment and observatory manager, NASA Goddard
  • Bertrand Mennesson, Roman Coronagraph Instrument project scientist, NASA JPL
  • Jeff Hanke, president, Space Systems, Space and Mission Systems, L3Harris Technologies 
  • Wendy Minotti, program manager, Exquisite Imaging, Space and Mission Systems, L3Harris Technologies
  • Bonnie Patterson, vice president and general manager, Civil Space, Space and Mission Systems, BAE Systems
  • Sarah Lipscy, director, Strategic Operations, Space and Mission Systems, BAE Systems

Previously credentialed media interested in scheduling an interview should contact the NASA Kennedy newsroom at: ksc-newsroom@mail.nasa.gov.

Sunday, Aug. 30

6:20 a.m.: Launch coverage begins.

7:26 a.m.: Launch

9:30 a.m.: Postlaunch news conference with the following participants:

  • NASA Administrator Jared Isaacman
  • Nicky Fox, associate administrator, Science Mission Directorate, NASA Headquarters
  • Jackie Townsend, Roman telescope project manager, NASA Goddard
  • Julie McEnery, Roman telescope senior project scientist, NASA Goddard
  • Denton Gibson, launch director, NASA’s Launch Services Program, NASA Kennedy

Media may ask questions in person or by phone. Limited auditorium space will be available for in-person participation. For the dial-in number and passcode, media should contact the NASA Kennedy newsroom no later than one hour before the news conference at: ksc-newsroom@mail.nasa.gov.


Audio-only coverage

Audio-only coverage of the launch will be carried on the NASA “V” circuits, accessible by dialing 321-867-1220 or 321-867-1240. On launch day, mission audio countdown activities without NASA broadcast commentary will be carried on 321-867-7135.

Launch audio also will be available on Launch Information Service and Amateur Television System’s VHF radio frequency 146.940 MHz and KSC Amateur Radio Club’s UHF radio frequency 444.925 MHz, FM mode, heard within Brevard County on the Space Coast.

NASA website launch coverage

Launch day coverage will be available on the NASA website, including the livestream and blog updates as countdown milestones occur. On-demand streaming video and launch photos will be available shortly after liftoff. Follow mission updates on the Roman launch blog.

Attend launch virtually

Members of the public may register to attend the Roman launch virtually. NASA’s Virtual Guest Program includes curated launch resources, notifications about related opportunities or schedule changes, and a stamp for the NASA virtual guest passport following launch.

Watch, engage on social media

Let people know you’re watching the mission on X, Facebook, and Instagram by following and tagging these accounts:


The Roman telescope is managed at NASA Goddard with participation by the agency’s Jet Propulsion Laboratory in Southern California; Caltech/IPAC in Pasadena, California; the Space Telescope Science Institute in Baltimore; and a team of scientists from various research institutions. The primary industrial partners are BAE Systems Inc., L3Harris Technologies, and Teledyne Scientific & Imaging. Contributions to Roman also are made by ESA (European Space Agency), JAXA (Japan Aerospace Exploration Agency), the French space agency CNES (Centre National d’Études Spatiales), and the Max Planck Institute for Astronomy in Germany. NASA’s Launch Services Program, based at Kennedy, manages the launch service for the Roman mission.

For more information about NASA’s Roman telescope, visit:

https://www.nasa.gov/roman

-end-

Alise Fisher
NASA Headquarters, Washington
202-385-1287
alise.m.fisher@nasa.gov

Leejay Lockhart
Kennedy Space Center, Fla.
321-747-8310
leejay.lockhart@nasa.gov

Claire Andreoli
Goddard Space Flight Center, Greenbelt, Md.
301-286-1940
claire.andreoli@nasa.gov

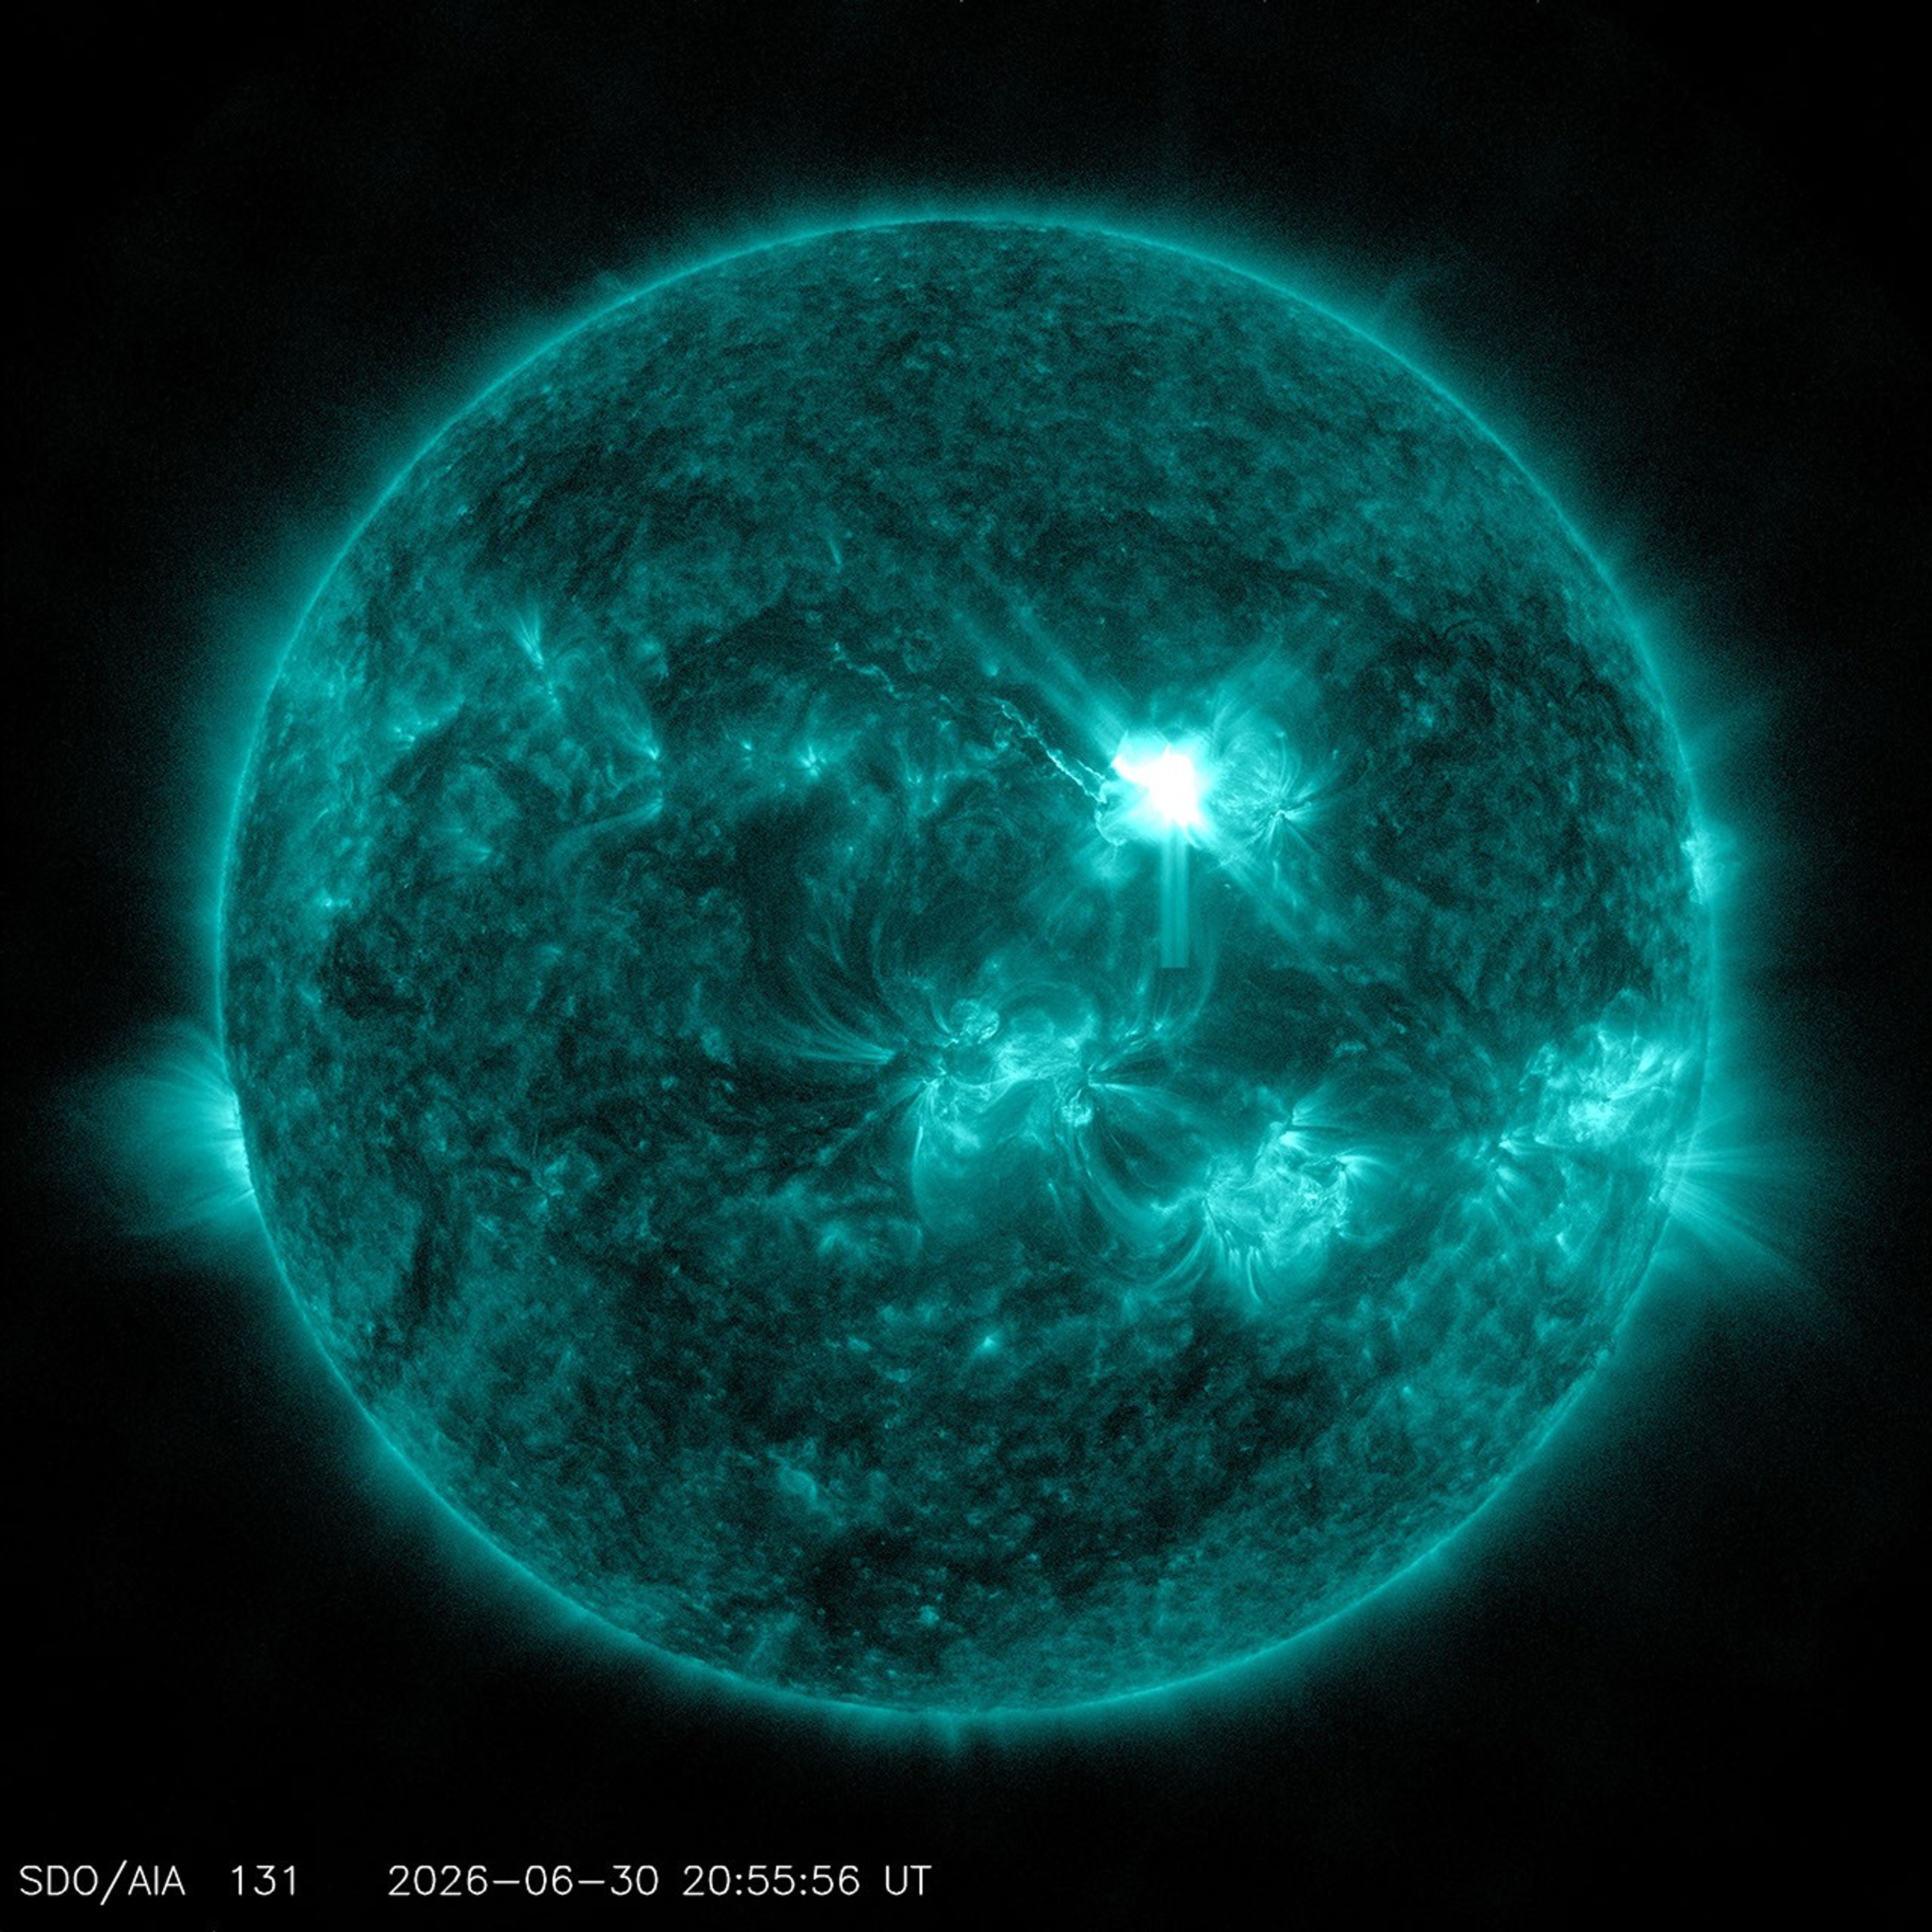
Starstruck: NASA Research Shows How Sun’s Ancient History Shaped Earth

24 August 2026 at 13:53
6 Min Read

Starstruck: NASA Research Shows How Sun’s Ancient History Shaped Earth

At the center of our solar system, the Sun influences every planet that orbits it. In two recent NASA-funded studies, scientists uncovered how ancient events in the Sun’s history may have helped create Earth’s unique climate and driven previously unexplained climatic shifts.  

In new research, scientists at NASA’s SHIELD (Solar Wind with Hydrogen Ion charge Exchange and Large-Scale Dynamics) center — one of NASA’s DRIVE (Diversify, Realize, Integrate, Venture, Educate) Science Centers — trace the trajectory of the heliosphere, the massive bubble created by our Sun that envelops our solar system, as it moved through our galaxy and influenced Earth’s climate along the way. In another paper, a NASA scientist and coauthors investigate how the younger, dimmer Sun managed to heat Earth by seeding the production of potent greenhouse gases.

A Sun on the move 

Over the last tens of millions of years, Earth’s climate has undergone significant shifts, including notable ice ages in which the global average temperature temporarily dropped by several degrees. During these periods, more frequent climate swings led Earth to warm and cool. To explain these periods of warming and cooling, scientists looked to factors internal to Earth, including orbital changes, greenhouse gases, and ice. But new research suggests changes to the Sun’s environment may be key to understanding Earth’s temperature swings. 

Just as our planet is encased by an atmosphere, so our entire solar system is encased inside a kind of “atmosphere” created by the Sun. This protective bubble, known as the heliosphere, is formed by a continuous solar wind of charged particles streaming out from the Sun in all directions. 

This conceptual animation begins with a view of the Milky Way Galaxy. As we zoom in, we travel to the Local Interstellar Cloud, and then to the heliosphere, the protective bubble that surrounds our solar system. The heliosphere is formed by a continuous stream of charged particles from the Sun, called the solar wind.
NASA’s Goddard Space Flight Center Conceptual Image Lab

Our heliosphere orbits around the center of our galaxy, the Milky Way. Throughout the Sun’s 4.6-billion-year existence, our heliosphere has traversed various regions within our galaxy. In a paper published on Aug. 21 in Annual Review of Astronomy and Astrophysics, researchers at NASA’s SHIELD used computer modeling to reverse-engineer the path of the heliosphere through our galaxy, revealing that the environments it passed through may have triggered changes on Earth.   

Merav Opher, SHIELD’s principal investigator at Boston University, and her team ran simulations that showed the Sun has encountered frigid expanses of gas and dust at least three different times in the past few million years. In these instances, massive interstellar “cold clouds” pushed against the heliosphere to such an extent that it shrank to smaller than Earth’s orbit, stranding our planet outside the Sun’s protective shield. 

These exposures — approximately 2 to 3 million years, 6 to 7 million years, and 13 to 14 million years ago — would have exposed Earth’s atmosphere to totally different surroundings. The simulation results match geologic evidence: Elements prevalent in interstellar dust appear in deep-sea sediment core samples, Antarctic snow, and lunar samples during these timelines. 

This animated illustration shows Earth and the Sun protected by the heliosphere, the massive bubble created by our Sun. As our solar system traverses through the galaxy, encounters with massive interstellar “cold clouds” pushed against the heliosphere and caused the heliosphere to shrink past Earth, exposing the planet to cosmic radiation and elements from interstellar space.
NASA’s SHIELD DRIVE Science Center/Merav Opher/Harvard Radcliffe Institute

These heliosphere collapse events may also explain ancient climatic patterns on Earth. In the simulations, when Earth’s atmosphere was exposed to a cold, dense galactic hydrogen cloud, it increased water vapor content and shifted upper-atmospheric dynamics, ultimately altering the conditions at the surface. In summary, our heliosphere’s trips through colder regions in our galaxy may be a key factor in driving some of Earth’s ancient changes in climate, including possible ice ages.  

Next frontier in studying heliophysics 

The SHIELD center is one of several that NASA funds to unlock the next generation of heliospheric research. As a DRIVE Science Center, SHIELD builds a team of researchers with differing expertise, approaches, and opinions to develop a model, or “digital twin,” of the heliosphere that helps reveal how the heliosphere interacts with its surroundings, including dense interstellar clouds. Understanding our unique, habitable solar system will help unravel the mysteries of life’s evolution on Earth and potentially uncover other habitable star systems. 

Young Sun 

In another paper, Vladimir Airapetian, a scientist at NASA’s Goddard Space Flight Center in Greenbelt, Maryland, focuses on a long-standing mystery of how the ancient Sun warmed early Earth enough to sustain life. Three billion years ago, the young Sun was 70% as bright as it is today. Under these dimmer conditions, Earth should have been frozen solid. Yet geological evidence shows stable liquid water already existed long before that. This puzzle — a balmy Earth under a cooler, dimmer Sun — is known as the Faint Young Sun paradox.  

One clue to resolving the paradox comes from young Sun-like stars elsewhere in the galaxy. These “toddler” stars are prone to throwing fits. Specifically, data from NASA’s retired Kepler space telescope shows that young Sun-like stars regularly erupt with massive superflares, flinging high-energy particles in all directions on a daily basis. If our young Sun was like these other stars, Airapetian proposes, the barrage of high-energy solar particles could have triggered chemical reactions that were key to warming early Earth. 

Airapetian’s team simulated early Earth’s atmosphere in a sealed chamber, mixing molecular nitrogen, ammonia, carbon dioxide, and carbon monoxide. They then fired protons into the mixture, simulating the onslaught of particles from superflares. This proton bombardment triggered several changes including the production of nitrous oxide, a greenhouse gas 300 times more potent than carbon dioxide. The research was published in Astrophysical Journal Letters.

This nitrous oxide could help Earth hold onto heat. But not all the nitrous oxide would last. The young Sun’s intense ultraviolet radiation would break some of it down, splitting the molecule back into nitrogen and oxygen. But even if only 10% of the nitrous observed in the experiment survived, Airapetian’s team’s computer simulations confirmed, it would still warm Earth’s equatorial regions to about 41 degrees Fahrenheit (5 degrees Celsius), above water’s freezing point. This smaller amount of nitrous could even accelerate prebiotic synthesis: just-above-freezing temperatures have been found to be more efficient for building complex chains of amino acids than warmer temperatures. 

Unearthing secrets of our star-planet system 

Together, these two studies show that the Sun can lead to surprising implications for Earth. While our planet stands alone in many ways, it was formed and has always existed as part of a star-planet system. Understanding that unique relationship promises new insights about both Earth and the star that sustains it.  

By Desiree Apodaca and Miles Hatfield 
NASA’s Goddard Space Flight Center, Greenbelt, Md. 

Keep Exploring

Discover More Topics From NASA

NASA Data Feeds River Forecasts as Snow Drought Effects Linger

20 August 2026 at 10:12
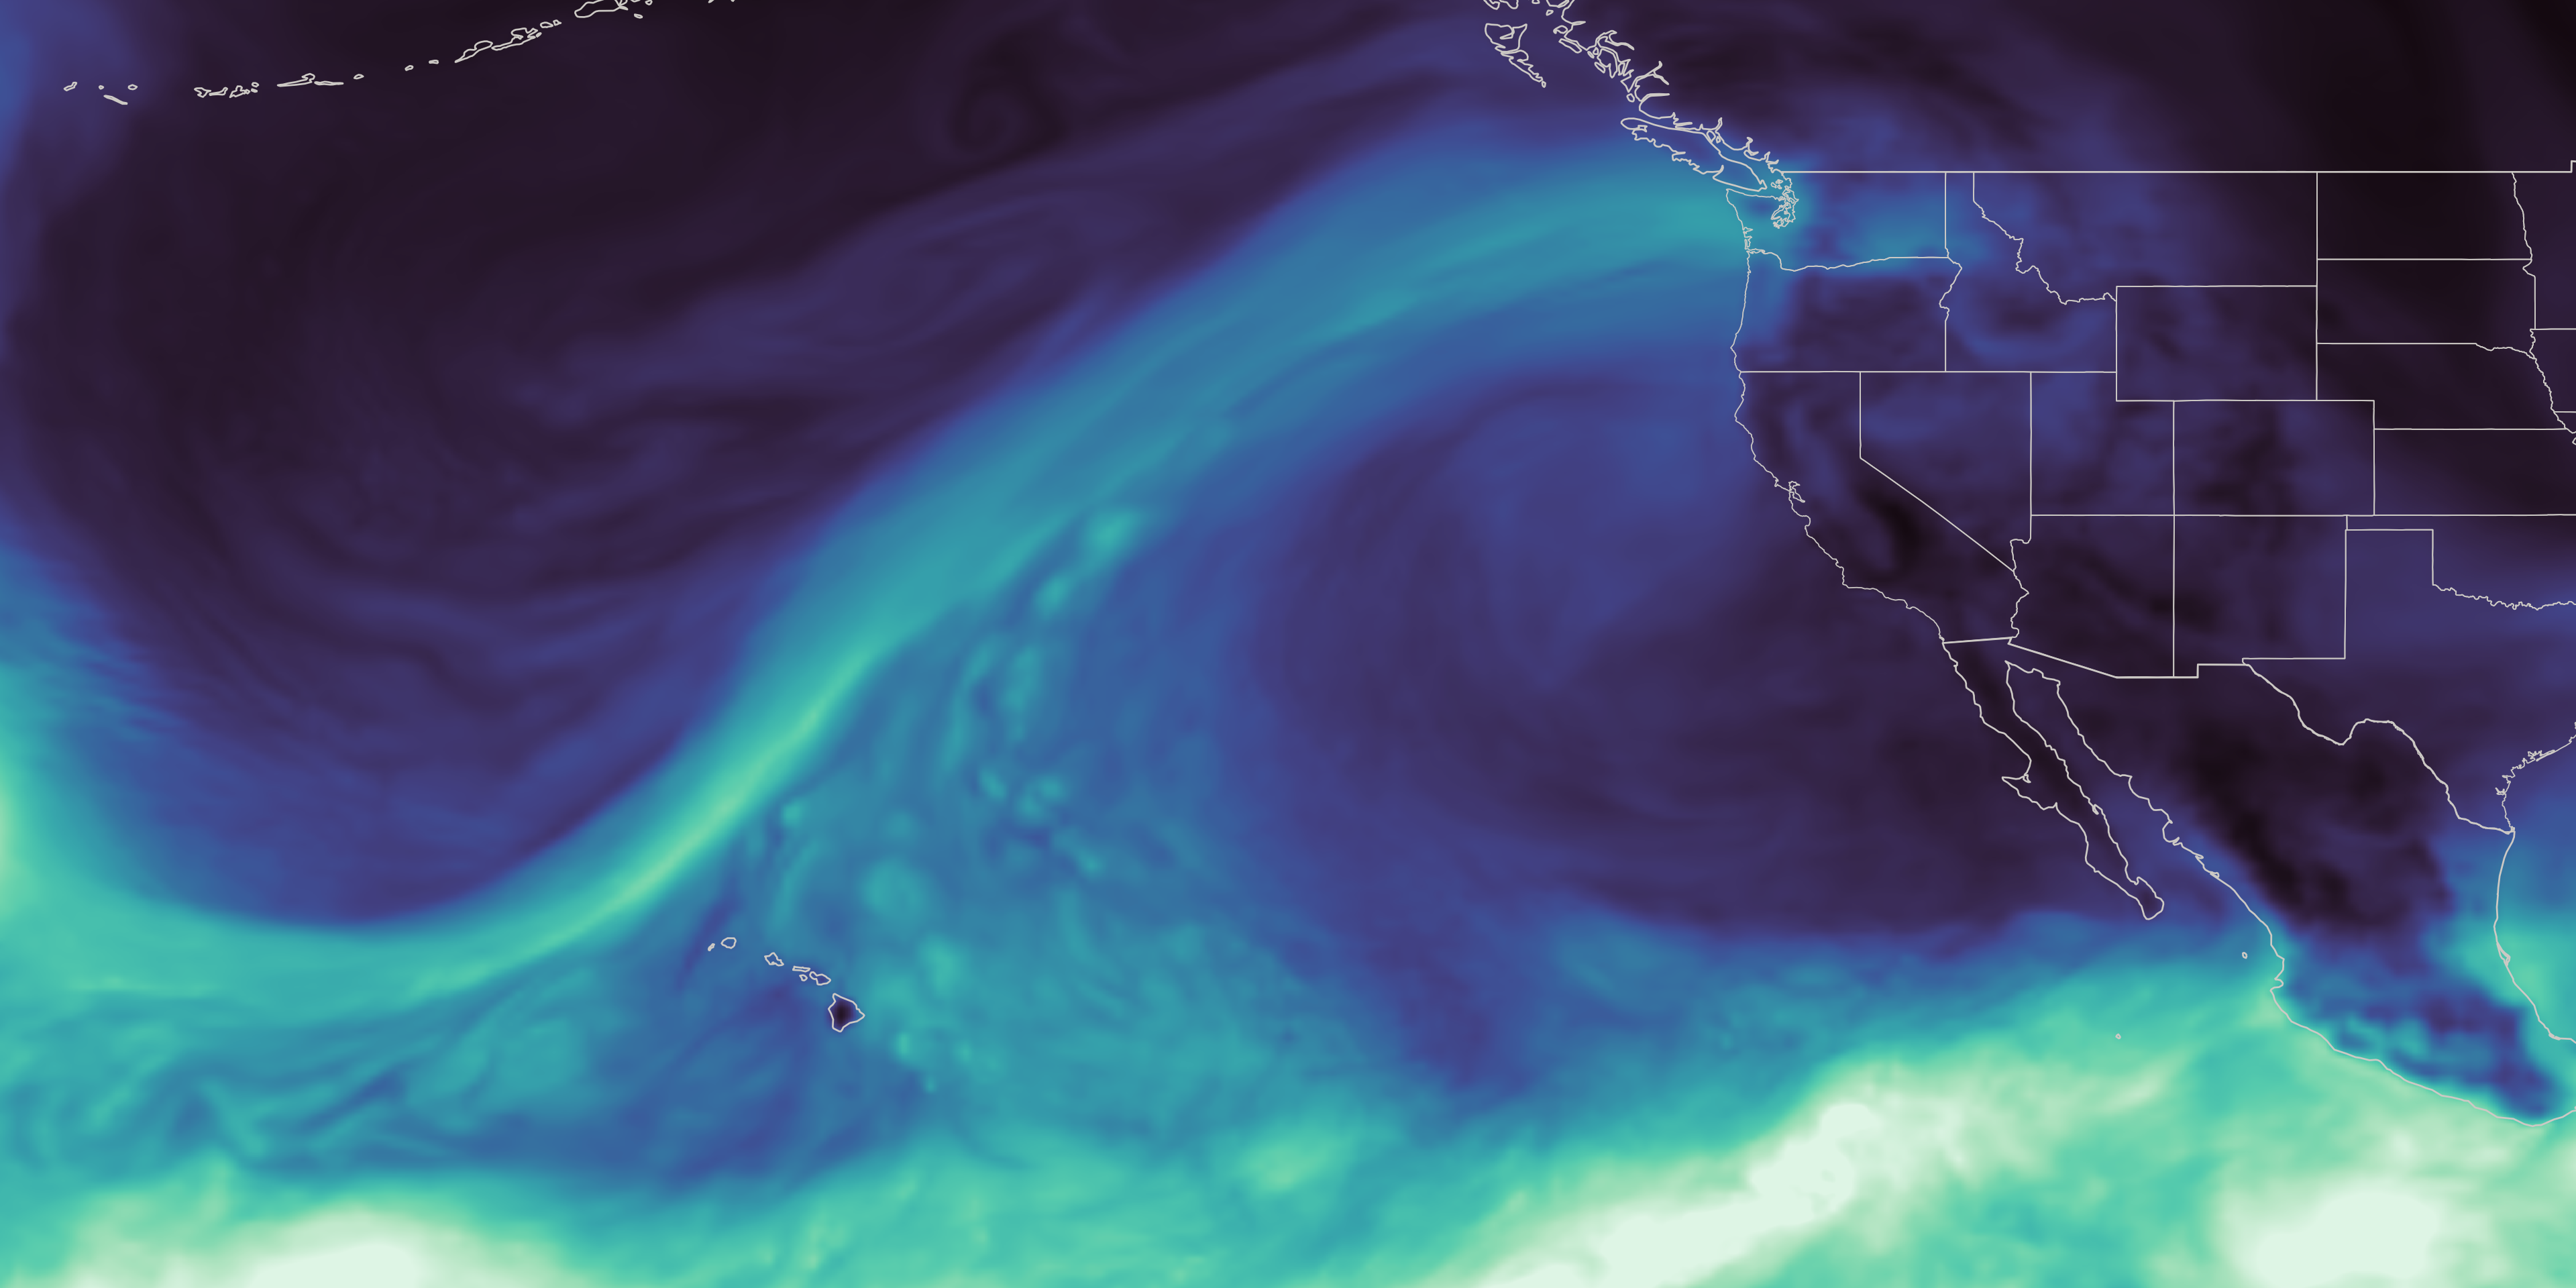
This map, derived from NASA’s GEOS (Goddard Earth Observing System), shows an atmospheric river reaching Washington state in December 2025, during a winter marked by extreme rainfall and too little mountain snow.
NASA’s Scientific Visualization Studio

As the effects of the 2026 snow drought in the western United States carry into summer, NASA Earth data is feeding machine-learning forecasts that inform decisions about water, power, and public safety in Washington state.  

Tacoma Power, a Washington public utility, is using a U.S. technology company’s river-flow forecasts during a year of water extremes on the Cowlitz River. The utility’s largest hydroelectric project uses water stored behind Mayfield and Mossyrock dams to generate enough electricity to serve more than 151,000 homes each year.

Upstream Tech’s HydroForecast combines weather forecasts and river measurements with NASA-produced satellite data on snow cover and vegetation conditions to predict river flow from hours to days ahead. Updated every two hours, the forecasts are used by reservoir managers, hydropower producers, water utilities, and government agencies to prepare for storms, plan reservoir water releases, and navigate dry periods.

“Part of NASA’s mission is to make the view from space useful on the ground,” said Erin Urquhart, manager for NASA’s Water Resources program at the agency’s headquarters in Washington, D.C. “When an American company incorporates NASA’s freely available data into forecasts that help water managers prepare for floods, generate power, and steward water supplies, that’s NASA delivering practical value to the nation.”

Year of water extremes

During the winter of 2025-26, unusual warmth meant a larger share of precipitation fell as rain instead of snow across much of the West, while below-normal precipitation deepened deficits in some areas. January, February, and March each had the lowest Western snow cover for that month in the NASA MODIS (Moderate Resolution Imaging Spectroradiometer) satellite record since 2001.

On the Cowlitz, those conditions produced a season of extremes. In December 2025, a powerful atmospheric river brought a long, narrow band of Pacific moisture into the region, causing one of the largest one-day inflow surges ever recorded at Tacoma Power’s hydroelectric project. Across the season, that rain-heavy pattern sent water downstream quickly instead of building mountain snowpack that would melt and release water steadily into summer. Snowpack remained at just 20% to 50% of normal levels.

As winter became spring, the rain tapered off, and on April 8, Washington state placed every watershed, including the Cowlitz, under a drought emergency. From April through June, peak daily inflow into the project was among the lowest on record, leaving Tacoma Power with less incoming water to replenish its reservoirs ahead of summer demand, said Saul Villarreal, Tacoma Power’s senior hydro operations manager.

Tacoma Power’s Mayfield Dam and powerhouse sit on the Cowlitz River in southwest Washington, where forecasts using NASA data support reservoir operations and hydropower generation.
Tacoma Power, used with permission

Turning satellite data into river forecasts

NASA turns observations collected by the VIIRS (Visible Infrared Imaging Radiometer Suite) instrument on the Suomi-NPP (Suomi National Polar-orbiting Partnership) satellite into data products that provide information about snow cover and vegetation greenness across entire watersheds, including where ground monitors are sparse.

To train HydroForecast, Upstream Tech collects and archives years of those NASA products alongside weather forecast data and actual river-flow measurements. Using records from hundreds of watersheds, the models learn common patterns in how water moves through the landscape and apply them in new locations.

Tests across multiple basins found that including snow and vegetation observations increased forecast skill, said Dr. Laura Read, director of technical and federal partnerships for HydroForecast at Upstream Tech. “NASA’s data gives us the reliability, global coverage, and consistency we need,” said Read. “Our short-term models run every two hours, so those inputs have to show up when we need them. Though we have stopgaps in place, any interruption to our operational pipeline is a huge deal.”

Tacoma Power uses HydroForecast alongside stream gauges, snow stations, and operator judgment. During the December storm, the NASA-informed, short-term forecast helped the utility anticipate how much water would reach the project and prepare for dynamic river conditions, while meeting operating requirements and keeping public safety at the forefront, Villarreal said.

NASA’s GEOS (Goddard Earth Observing System) maps an atmospheric river, a ribbon of water vapor, before Washington’s January-April 2026 snow cover is compared with a historical median.
NASA’s Scientific Visualization Studio

As spring approached, the operational challenge reversed. Tacoma Power used HydroForecast’s seasonal model to track the growing risk of weak runoff and began keeping its reservoirs higher than usual to preserve water for summer. That left less space to contain another large storm, so operators continued checking the short-term forecast “to play defense,” and remained ready to adjust operations if another atmospheric river developed.

“The earlier we understand how conditions might change, the more effective planning we can do to manage our reservoir and balance the many demands of our system throughout the season,” said Villarreal.

Tacoma Power entered summer 2026 with reservoir levels near average despite the dry spring. The stored water supports reliable hydropower, required river flows to support fish and aquatic habitat, and public recreation. It also gives the utility more flexibility to meet electricity demand during heat waves or unexpected outages and, when possible, support the wider regional power system.

From forecasts to drought assessments

Tacoma Public Utilities’ Cowlitz Hydro Project is just one example of NASA science supporting water decisions across the West.

NASA also has partnered with the U.S. Department of Agriculture’s Natural Resources Conservation Service to bring satellite-based snow and groundwater information into machine-learning water-supply forecasts.

The National Oceanic and Atmospheric Administration’s Colorado Basin River Forecast Center uses MODIS and VIIRS data to adjust snowmelt rates in its model. The Bureau of Reclamation uses NASA and NASA-derived snow data, alongside other sources, for reservoir operations in California’s San Joaquin Basin.

NASA data and research have long informed the U.S. Drought Monitor, the weekly assessment used by farmers, water managers, and public agencies. NASA became a formal partner in 2026, expanding its role from providing information to helping produce the assessment. The agency took its first turn authoring the Drought Monitor during the week of Aug. 17.

About the Author

Emily DeMarco

Emily DeMarco

Writer/Editor (IV), Earth Science Division

Emily is a science writer and editor with NASA’s Earth Science Division, with more than 10 years of experience in science journalism and communication. A former deputy news editor at the magazine Science News, she holds a master’s in environmental science and management from UC Santa Barbara’s Bren School, where she specialized in water resources management and science communication.

NASA Updates Next Steps for Commercial Swift Boost Mission

19 August 2026 at 14:08
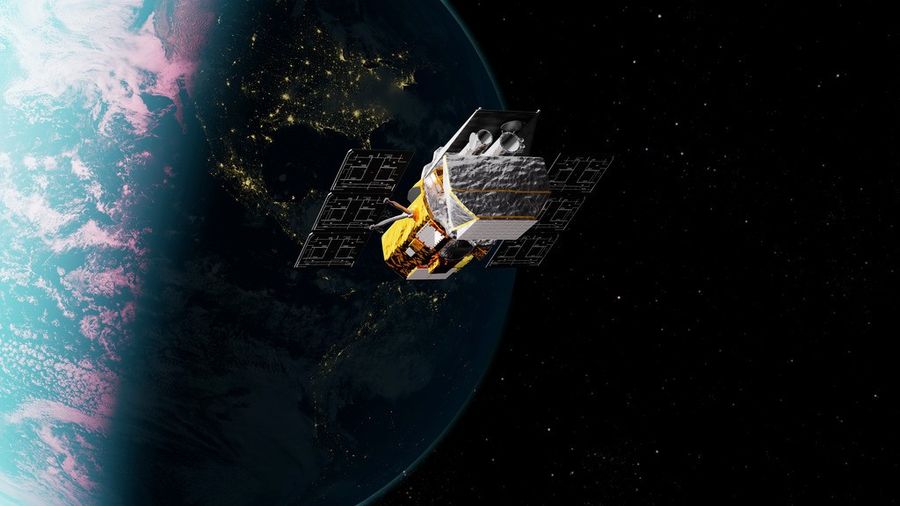
NASA’s Neil Gehrels Swift Observatory, shown in this artist’s concept, has orbited Earth for more than 20 years, studying the ever-changing universe.
Credit: NASA’s Goddard Space Flight Center Conceptual Image Lab

Due to an ongoing commercial spacecraft attitude control issue, NASA and Katalyst Space announced Wednesday the LINK spacecraft will not capture or boost an agency satellite to a higher altitude to extend its science mission as planned. However, LINK still will attempt to conduct rendezvous and proximity operations with NASA’s Neil Gehrels Swift Observatory to demonstrate key capabilities for the future of space exploration.

“NASA should be willing to move quickly and take smart risks when the potential return is worth it, and that is exactly what we did with this mission,” said NASA Administrator Jared Isaacman. “This is not the outcome we were working toward, but it does not change why this mission was worth attempting. The team moved with extraordinary speed to give Swift a chance to carry out more science while advancing capabilities America will need for satellite servicing in the future. We are going to learn everything we can from LINK’s rendezvous attempt and put those lessons to work on the missions that follow.”

NASA and Katalyst are working closely to assess next steps for rendezvous and gather as much data as possible to inform future satellite servicing operations.

“We knew this was a high-risk, high-reward mission – a first-of-its kind attempt, developed on an unprecedented timeline driven by the Sun’s activity,” said Shawn Domagal-Goldman, director, Astrophysics Division, NASA Headquarters in Washington. “We were all hoping for more science from Swift. But we knew the takeaways from this mission would be worthwhile either way, and we have gained so much through the series of accomplishments up to this point.”

Without intervention, NASA anticipates Swift is likely to re-enter Earth’s atmosphere later this year. As part of the agency’s previous planning for Swift’s end of life, NASA will continue to prioritize finding new options to react rapidly to cosmic events, using current missions to help fill the gap in the meantime.

“Building, testing, and operating this mission has already strengthened America’s space industry pipeline, advancing in-space servicing capabilities in completely new ways,” Domagal-Goldman said. “NASA is committed to supporting our commercial vendors as they take on difficult tasks with the agency, to push the boundaries of what’s possible. We’re so proud of this team for: getting to the launch pad in record time, in a record-setting year for NASA astrophysics launches; its innovative problem-solving up to this point; and the dedication to the exciting capabilities this mission will attempt to demonstrate next.”

Swift was launched in 2004 to study gamma-ray bursts, the most powerful explosions in the universe, and other cosmic objects and events. It was designed for a two-year prime mission. After 21 years of science operations, Swift’s low Earth orbit began to rapidly decay because of increased solar activity. NASA used this opportunity to advance U.S. spacecraft servicing technology, awarding a contract to Katalyst in September 2025 to mount a robotic servicing mission for Swift in less than a year.

The LINK spacecraft launched July 3 on a Northrop Grumman Pegasus XL rocket from Kwajalein Atoll in the South Pacific Ocean. Teams established communications with LINK and conducted in-orbit checkouts over the following weeks, before the spacecraft experienced attitude control issues.

Learn more from Katalyst, and monitor NASA’s Swift blog for continued updates throughout rendezvous:  

https://science.nasa.gov/blogs/swift

-end-

Alise Fisher
Headquarters, Washington
202-358-2546
alise.m.fisher@nasa.gov

Human-Related Microbes May Survive Moon’s South Pole, NASA Finds

19 August 2026 at 14:02
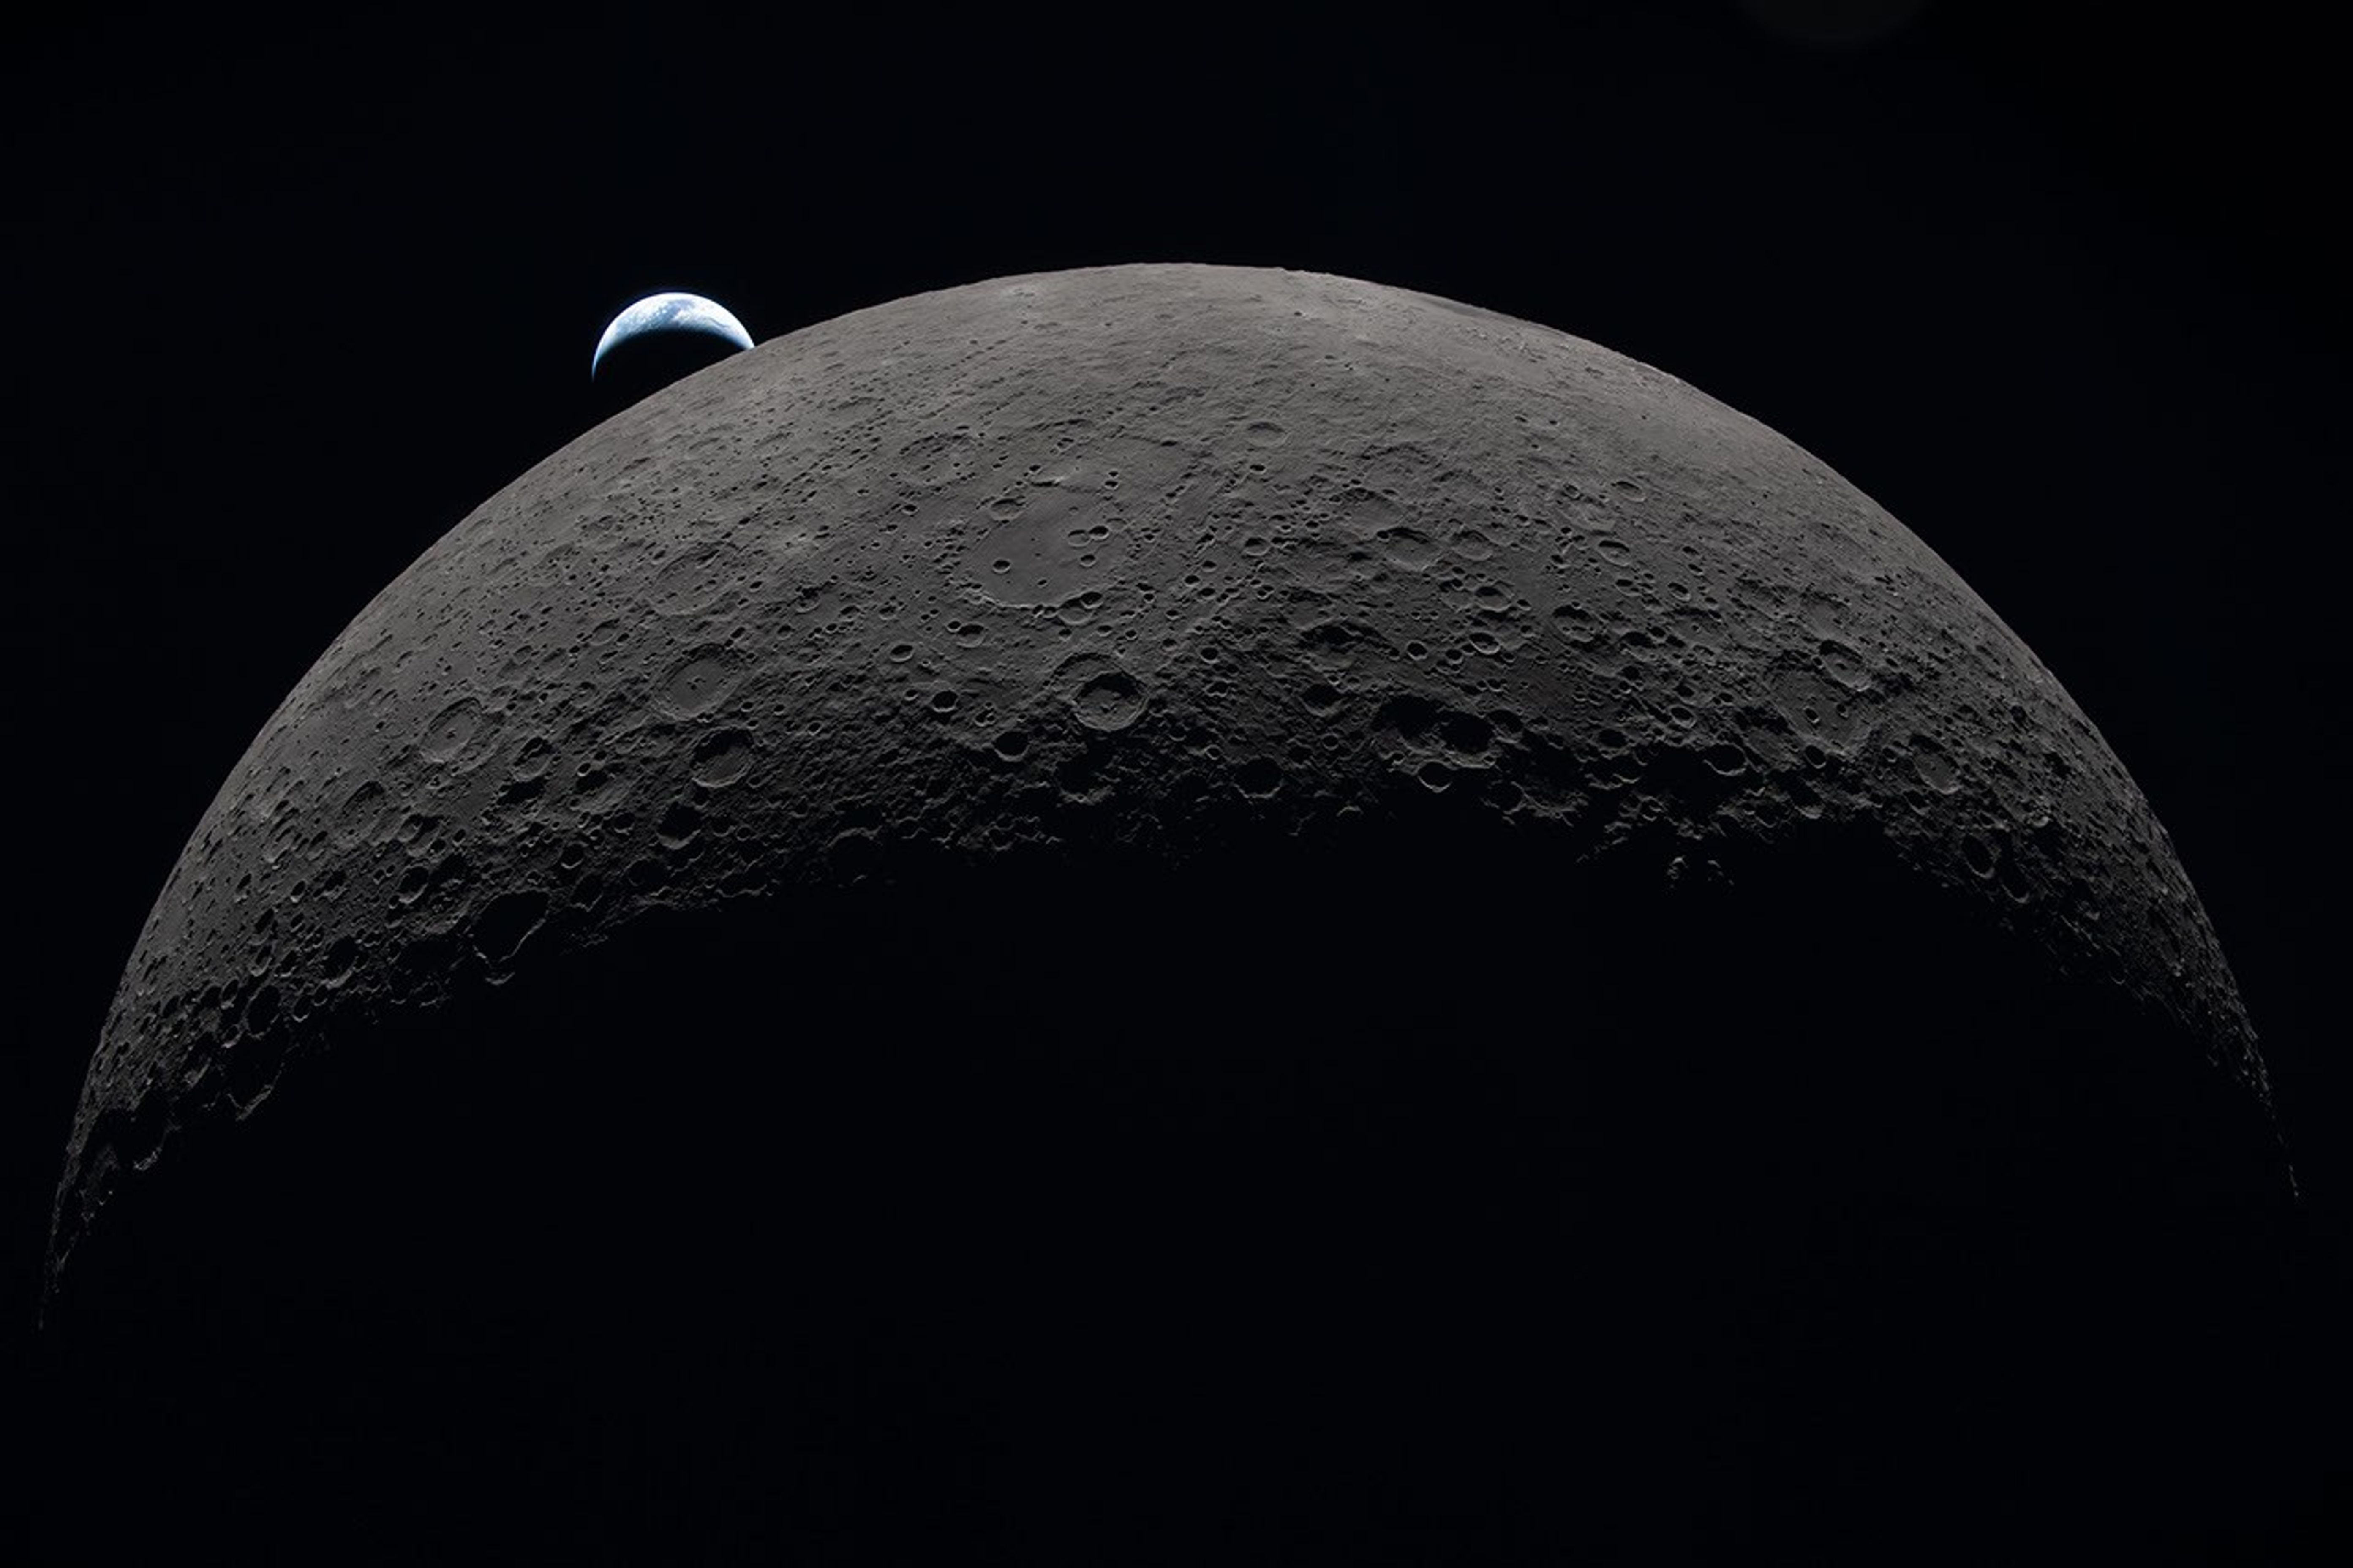
The gray-brown, heavily cratered Moon dominates the frame against black space, with a partially lit crescent Earth setting behind its upper-left edge.
This image was taken by an Artemis II astronaut from the Orion capsule in April 2026, as the spacecraft traveled past the Moon and back over 10 days. The gray-brown, heavily cratered Moon dominates the frame against black space, with a partially lit crescent Earth setting behind its upper-left edge.
NASA

Lee esta historia en español aquí.

Some of Earth’s microbes likely to hitch a ride to space with human explorers could survive in the shaded nooks and crannies of the Moon’s South Pole region, NASA scientists say. 

Published on Aug. 19, 2026, in Science Advances, these findings highlight a need to better understand microbial persistence in extreme lunar environments. As humans build a permanent presence on the Moon, it may become difficult to distinguish ancient lunar chemistry from contamination delivered by visiting astronauts. The concern extends beyond the Moon and on to Mars, scientists say. 

“Humans are natural explorers, and with them come their voices, their memories … and their microbes,” said Prabal Saxena, a planetary scientist who led the study from NASA’s Goddard Space Flight Center in Greenbelt, Maryland. “For some scientists, myself included, that reality can be unsettling. But it also creates an opportunity to turn an imperfect situation into a useful experiment.”

Bringing microbes along is unavoidable: Humans have, on average, 1 million bacteria living on each patch of skin the size of a pencil eraser, for example. These bacteria vent from spacesuits and habitats. Though the paper’s authors worry about contamination interfering with the search for chemical clues to ancient geology or biology, they also argue that the Moon should be used as a natural lab. In shaded areas around the South Pole, scientists could carefully test the real-life limits of microbial survival in an environment that can’t easily be reproduced on Earth. 

The Apollo program landed six pairs of astronauts on the Moon between 1969 and 1972. All six landing sites are near the lunar equator. In this visualization, the Apollo sites are contrasted with the South Pole, an area with enormous potential for future exploration. Time passes as we zoom toward Shackleton crater at the South Pole, revealing illumination conditions quite different from those near the equator. While many craters remain in permanent shadow, some nearby mountains and ridges are in persistent sunshine, making them attractive candidates for solar power and long-term habitation.
NASA’s Scientific Visualization Studio/Ernie Wright

Before any surface science can happen, scientists need a baseline measurement of what contaminants humans bring, the authors say.

“We need to understand what was there before us, because when we go to Mars to search for signs of life beyond our planet, we will want to make sure it’s not stuff we brought,” said Andrew Needham, a NASA Goddard-based paper co-author who is an Artemis contamination‑control scientist for lunar samples.

Even with strict sterilization procedures, some organisms are stubbornly resilient. A good example is Aspergillus niger, which is a fungus that thrives in warm, damp places like household bathrooms and heating, ventilation, and air conditioning systems. Astronauts have sampled it inside the International Space Station, and experiments demonstrate that the fungus can survive outside the station as well. Aspergillus niger was one of five microbes, including bacteria and fungi, selected for this study because of its known toughness in spaceflight environments. 

That microbes survived on the space station’s exterior surprised scientists. These species are typically not considered “extremophiles” that can withstand harsh conditions, such as the vacuum of space, according to Aaron Regberg, a geomicrobiologist at NASA’s Johnson Space Center in Houston.

“I would have expected these microbes to have dried out,” said Regberg, who studies space station bacteria and was a co-author on the paper.

Astronaut conducts scientific work aboard the International Space Station, floating in microgravity surrounded by equipment and research tools.
NASA astronaut Kate Rubins on Oct. 14, 2016, collecting microbes in the Japanese Experiment Module aboard the International Space Station.
JAXA/Takuya Onishi

He pointed out that NASA often bakes robotic spacecraft at temperatures above 400 degrees Fahrenheit to reduce the number of living organisms on them. But that’s not possible with astronauts, so contamination concerns take on new meaning in crewed exploration of the Moon’s south polar environment.

A clearer picture of where microbes might survive comes from understanding how sunlight behaves at the poles. Survival in this study means the microbe can stay alive for at least one Earth day, which does not mean that it can grow and reproduce.

Because the Moon has a very small tilt on its axis, the view from its poles is of a Sun that appears to hover just above the horizon, skimming the surface like a flashlight laying on a table. As a result, elevated parts of the surface, including crater ridges, mountains, and even small bumps, block light from reaching low-lying terrain. This produces pockets of shadowed areas that can remain cold and preserve water, as well as shield fragile molecules and possible microorganisms from lethal radiation.

With that scientific context in mind, the team set out to test which Earth microbes could survive extreme polar conditions. They focused on organisms commonly found in spaceflight environments and those common on human skin. Besides Aspergillus niger, these included Bacillus subtilis, Staphylococcus aureus, Deinococcus radiodurans, and several species of Fusarium. Based on an analysis of previous studies, the scientists noted the maximum amount of heat and ultraviolet (UV) radiation each organism can withstand.

Then, the organisms were tested in simulations of three regions near the lunar South Pole — Nobile Rim, Connecting Ridge, and De Gerlache Rim. Those simulations used detailed environmental maps built from elevation and temperature data collected by instruments aboard NASA’s Lunar Reconnaissance Orbiter, combined with models of how radiation strikes the surface.

The models showed maps of “survivable niches” that range in size from a miles-wide crater floor to an astronaut’s boot print. Aspergillus niger, which was most resistant to UV radiation, was able to survive even in areas with some sunlight exposure. UV radiation is so deadly to most microbes that it’s used for sterilization in hospitals. 

“When we think of the Moon, we don’t typically think of biology,” said Heather Graham, a paper co-author at NASA Goddard who helps develop tools and techniques for detecting biology that may look nothing like Earth’s. “But the Moon is a place where a cell can survive, so our first exploration of these sites should pay extra attention to our microbial hitchhikers and work hard to characterize lunar chemistry before our visits change what we will find.”

The authors note that while some microbes can survive in a dormant state in regions around the South Pole, and thereby confuse some future scientific investigations, there is no evidence the Moon has key ingredients to sustain growth and replication. Such ingredients include liquid water, which typically requires an atmosphere and moderate temperatures.  

For more information, visit:

https://science.nasa.gov/astrobiology

Learn More and Get Involved

International Observe the Moon Night, Sept. 19, 2026

Each year, observers around the world come together to celebrate Earth’s Moon through direct observations, hands-on activities, lunar-themed music, artwork, readings, and more.

A black background with a thin white crescent on the left representing the Earth, and a thin off-white crescent on the right represents the Moon.

The Moon

From lighting up our skies to preserving evidence of our solar system’s history, Earth’s closest neighbor plays a pivotal role in the study of our planet and beyond.

About the Author

Lonnie Shekhtman

Lonnie Shekhtman

Senior Science Writer

Shekhtman helps communicate NASA planetary science to the world through news and feature stories on NASA.gov, videos for NASA+ and YouTube, and by working with the media. She reports on lunar and Mars science and exploration; NASA’s search for life; missions to Venus, Titan, and Jupiter’s Trojan asteroids; and many other topics related to NASA’s exploration of our solar system and beyond.

NASA’s LRO Images Falcon 9 Crater on Moon, Learns New Details

18 August 2026 at 14:49

3 min read

NASA’s LRO Images Falcon 9 Crater on Moon, Learns New Details

Two-frame animation showing a new crater, with ejecta rays extending outward, appearing on the Moon.
This is an animated before-and-after view of the crater formed after a Falcon 9 upper stage struck the Moon’s surface on Aug. 5, 2026. These images were taken between Aug. 11 and 12 by the Narrow-Angle Camera on NASA’s Lunar Reconnaissance Orbiter. These images are enlarged three times from the original, with north facing up, and they cover an area about a quarter of a mile wide.
NASA Goddard/Intuitive Machines

Between Aug. 11 and 12, NASA’s Lunar Reconnaissance Orbiter (LRO) captured a series of images of a new crater on the Moon. The crater formed on Aug. 5, when a SpaceX Falcon 9 upper stage impacted the surface following its January 2025 launch of the Firefly Blue Ghost 1 mission.

To capture imagery of the impact, engineers tilted the spacecraft so its cameras would point toward the crater each time LRO passed about 60 miles above the Moon, traveling 1 mile per second. The orbiter circles the Moon from pole to pole every two hours, while the Moon slowly rotates underneath it. To photograph a specific spot, the spacecraft must wait until that location turns into view, which took six days in this case.

Getting the pointing right was only half the challenge; timing had to be accurate as well. If the camera snapped even 10 seconds too early or too late, the target would drift off-center by 10 miles.

An artist concept video showing NASA’s Lunar Reconnaissance Orbiter circling the Moon.
NASA’s Goddard Space Flight Center Conceptual Image Lab

Because of the variety of viewing angles, scientists could see the crater under multiple lighting conditions that revealed unique features. In images where the crater rim stood out, scientists measured its 60‑foot width. Scientists also determined the crater is less than 10 feet deep based on the length of its shadow.

To capture these details, LRO used its Narrow-Angle Camera, which can spot features as small as 3 feet wide.

Four black-and-white views of the same cratered lunar surface, each taken from a different angle. A small, bright boulder or mound near the center casts shadows that change direction across the images. The panels are labeled 105°, 90°, 53°, and 37°.
Collected between Aug. 11 and 12 by NASA’s Lunar Reconnaissance Orbiter, six days after a Falcon 9 upper-stage booster impacted the Moon, these images were taken from different viewing angles, bringing out different features. The darker area that fans around the crater in the upper-left image is rougher than the surroundings, as this surface material has been altered over a long time by solar wind, galactic cosmic rays, and micrometeorite impacts. The brighter rays and splotch above the crater in the lower-right image is fresher material that was excavated from deeper below the surface. The pictures are arranged in the order they were taken, starting at the top left and moving toward the bottom right, with the lighting angle from the Sun gradually changing from one image to the next. Each image is enlarged two times and shows an area of the Moon about 1,000 feet wide.
NASA Goddard/Intuitive Machines

The images above show bright and dark rays stretching out from the crater. The darker streaks are made of surface dust and rocks altered over a long time by solar wind, galactic cosmic rays, and micrometeorite impacts. This weathered material was excavated by the collision from 1.5 feet into the lunar surface. The brighter streaks near the crater rim are made of fresh material excavated from deeper underground.

Grayscale view of a cratered surface with two overlapping, vertical translucent shapes—one red and one blue, and three small colored dots.
This image from NASA’s Lunar Reconnaissance Orbiter shows two oval regions where the Falcon 9 upper stage was likely to impact the Moon, based on calculations by engineers with NASA’s Center for Near Earth Object Studies. Both ellipses are 2.1 miles long and 0.4 miles wide. Both predictions use the same booster-trajectory calculations, but only the blue ellipse takes into account the lunar terrain. The red and blue dots show predicted impact locations, whereas the cyan dot shows the actual impact site.
NASA/JPL-Caltech

Finding the impact site took global coordination among experts and hobbyists. Independent astronomers first identified the rocket’s trajectory using publicly available data. NASA’s Center for Near Earth Object Studies, which tracks natural objects that could pose hazards to Earth for the agency’s Planetary Defense program, used this opportunity to test and validate tools and techniques for predicting impacts.

Based at NASA’s Jet Propulsion Laboratory in Southern California, the center incrementally refined the trajectory until identifying the location of impact, which it provided to the Republic of Korea for their Korea Pathfinder Lunar Orbiter (Danuri) team. The team used the high-resolution LUTI camera on Danuri a few hours later to image the crater, finding the prediction was accurate to about 0.6 miles. 

After capturing images of the crater, the Danuri mission sent coordinates to NASA’s LRO team to help refine their follow-up imaging sequence. Comparing their new crater images with the pre-impact images, the LRO team updated the crater center coordinates: 19.4759°N, 266.7138°E, 511 meters elevation.

About the Author

NASA Science Editorial Team

NASA Science Editorial Team

Keep Exploring

Discover More Topics From NASA

Hubble Solves Merger Mystery From Milky Way’s Early Years

17 August 2026 at 11:00

5 min read

Hubble Solves Merger Mystery From Milky Way’s Early Years

An illustration of two galaxies in the midst of a collision against a dark, star-filled background.  The collision takes up the middle third of the illustration. On the right, a larger galaxy is viewed at an angle from 11 ou2019clock to 4 ou2019clock, with a white-yellow core surrounded by mottled brown dust lanes and faint bluish spiral arms. To the left, a smaller, bright blue-white galaxy is stretched into a curved, hook-like shape as gravity distorts it. A broad, glowing bridge of pale blue gas and stars extends off the galaxy at the left, while wispy streams extend above and below the larger galaxy at the right. The words u201cArtistu2019s Conceptu201d appear in the lower left corner.
About 12 billion years ago, a dwarf galaxy known as LKH collided with a young Milky Way and merged with it. This artist’s concept portrays that collision. NASA’s Hubble Space Telescope uncovered definitive evidence of this collision by studying globular star clusters.
Illustration: NASA, ESA, Joseph Olmsted (STScI)

Our home galaxy, the Milky Way, grew to its current size in part by consuming smaller galaxies. Now, new data from NASA’s Hubble Space Telescope shows definitive evidence of a dwarf galaxy merging with the young Milky Way galaxy in the earliest phases of its evolution. This finding extends our knowledge of our galaxy’s history 1.8 billion years farther back in time than before.

The results published Monday in the journal Nature Astronomy.

The Milky Way today is a massive spiral galaxy home to hundreds of billions of stars. However, our galaxy wasn’t always so large; it has grown by forming new stars from its gas clouds as well as collecting stars, gas, and dark matter from other galaxies through mergers.

The most recent massive merger in our galaxy’s history took place with the Sagittarius dwarf galaxy, beginning over 6 billion years ago and still ongoing today. Looking back into the even more distant past, researchers learned that the Milky Way galaxy consumed another dwarf galaxy called Gaia-Sausage-Enceladus 10 billion years ago. This ancient merger greatly affected the structure of our galaxy’s disk of stars. Other, smaller mergers occurred between these two.

But our galaxy’s history doesn’t stop there. Both observations and simulations have suggested that another large merger preceded these two, though the specifics of the event have been heavily debated. Now, Hubble has uncovered definitive evidence of an earlier merger that occurred about 11.8 billion years ago, or just 2 billion years after the big bang.

“Our home is the Milky Way galaxy, but we do not know how our house was built,” said Davide Massari, lead author, Astrophysics and Space Science Observatory of Bologna in Italy. “In this paper we discover where the first significant batch of bricks came from: a dwarf galaxy that we call LKH.”

Cosmic archaeological sites

Immense astronomical surveys and precision data from spacecraft like ESA’s (European Space Agency’s) Gaia mission have been instrumental in piecing together the history of our galaxy. The farther back into our galaxy’s history that scientists attempt to look, the more difficult it becomes to tell what happened. When our galaxy was young, it was smaller and much closer in size to the galaxies it clashed with. It was also more chaotic, and it’s possible that the signs of mergers have been erased over billions of years.

It’s into this murky past that Hubble peered. Researchers used Hubble to study some of the Milky Way galaxy’s globular clusters: immense, roughly spherical collections of tens of thousands to a few million stars. Globular clusters contain some of the oldest stars in our galaxy, and they can act as cosmic archaeological sites that preserve stars from other galaxies the Milky Way galaxy has collected.

“Thanks to the high resolution and depth of Hubble imaging, we could measure the age and the metal content of these clusters with unprecedented precision,” said Chiara Zerbinati, study co-author, University of Bologna in Italy. “Coupled with measurements from Gaia, this made it possible to distinguish a population of globular clusters that are different from the others. These are the clusters that were born in LKH, and they tell us when that galaxy was devoured by ours, and how massive it was.”

The team analyzed Hubble observations of 39 globular clusters in the inner 20,000 light-years of our galaxy, where evidence of the most ancient mergers should be preserved. They expected this sample to contain globular clusters that formed within the young Milky Way galaxy as well as those collected from the Gaia-Sausage-Enceladus dwarf galaxy about 10 billion years ago.

Using Hubble’s sensitive observations to determine each cluster’s precise age and associated metallicity — the abundance of elements heavier than helium — they determined there was a third population of globular clusters in the inner regions of our galaxy. The team found that these clusters are older than the group collected in the Gaia-Sausage-Enceladus merger, but younger than those born in the Milky Way, regardless of their metal content. These  clusters, therefore, came from a separate and even earlier merger — in which the Milky Way galaxy absorbed a dwarf galaxy containing roughly 500 million times the mass of the Sun in stars, a significant fraction of our galaxy’s mass at the time. They named this dwarf galaxy Low-energy-Kraken-Heracles, or LKH, in honor of three earlier research papers that championed the idea of a merger early in our galaxy’s history.

Such a large merger so early in the Milky Way galaxy’s formation has profound implications for the evolution of our galaxy.

“Some past studies have argued that the earliest phases of our galaxy’s evolution were defined by stars born only in our galaxy,” says Massari. “Here, we have shown that stars born in external galaxies also need to be considered.”

The team plans to continue their work to unravel the history of the Milky Way galaxy by studying its globular clusters, aiming to characterize all the massive mergers that our galaxy has experienced across cosmic history.

“Hubble is observing globular clusters that have never been studied before, and this will help us characterize the merger events that are far back in time in the Milky Way galaxy’s history,” said Fernando Aguado-Agelet, co-author, University of Vigo and the University of La Laguna in Spain.

The Hubble Space Telescope has been operating for more than three decades and continues to make ground-breaking discoveries that shape our fundamental understanding of the universe. Hubble is a project of international cooperation between NASA and ESA (European Space Agency). NASA’s Goddard Space Flight Center in Greenbelt, Maryland, manages the telescope and mission operations. Lockheed Martin Space also supports mission operations at Goddard. The Space Telescope Science Institute in Baltimore, which is operated by the Association of Universities for Research in Astronomy, conducts Hubble science operations for NASA.

Facebook logo
Instagram logo

Related Images & Videos

An illustration of two galaxies in the midst of a collision against a dark, star-filled background.  The collision takes up the middle third of the illustration. On the right, a larger galaxy is viewed at an angle from 11 ou2019clock to 4 ou2019clock, with a white-yellow core surrounded by mottled brown dust lanes and faint bluish spiral arms. To the left, a smaller, bright blue-white galaxy is stretched into a curved, hook-like shape as gravity distorts it. A broad, glowing bridge of pale blue gas and stars extends off the galaxy at the left, while wispy streams extend above and below the larger galaxy at the right. The words u201cArtistu2019s Conceptu201d appear in the lower left corner.

LKH Milky Way Merger Illustration

About 12 billion years ago, a dwarf galaxy known as LKH collided with a young Milky Way and merged with it. This artist’s concept portrays that collision. NASA’s Hubble Space Telescope uncovered definitive evidence of this collision by studying globular star clusters.

Share

Details

Last Updated
Aug 18, 2026
Editor
Andrea Gianopoulos
Contact
Media

Claire Andreoli
NASA’s Goddard Space Flight Center
Greenbelt, Maryland
claire.andreoli@nasa.gov

Bethany Downer
ESA/Hubble
Baltimore, US

Christine Pulliam
Space Telescope Science Institute
Baltimore, Maryland

NASA’s COFFIES Uses AI to Predict Storm-Causing Active Regions on Sun 

14 August 2026 at 13:00

5 min read

NASA’s COFFIES Uses AI to Predict Storm-Causing Active Regions on Sun 

As humanity looks to the Moon and stars for future exploration, predicting space weather — conditions in space primarily driven by the Sun — is more important than ever. 

Now, a team of astrophysicists and data scientists with NASA’s COFFIES (Consequence Of Fields and Flows in the Interior and Exterior of the Sun) has developed a novel machine-learning model capable of predicting the emergence of active regions on the Sun up to 12 hours before they appear. 

The Sun is constantly churning. Intense concentrations of localized magnetic fields can suddenly break through the solar surface, forming sunspots. Space weather forecasters then collectively number and track sunspots since they are visible manifestations of active regions, which serve as the main engines behind severe space weather events such as solar flares and coronal mass ejections. These eruptions send waves of high-energy radiation and charged particles across space, creating storms that can threaten astronauts, disable satellites, and disrupt radio communications on Earth. 

The Sun appears in shades of teal with some brighter and darker regions, set against a black background. In the upper right part of the Sun is a bright flash of white, a solar flare.
NASA’s Solar Dynamics Observatory captured this image of a solar flare — seen as the bright flash in the upper right — on June 30, 2026. The image shows a subset of extreme ultraviolet light that highlights the extremely hot material in flares and which is colorized in teal.
NASA’s Goddard Space Flight Center/SDO 

By bridging expertise across different scientific institutions, COFFIES, a NASA DRIVE (Diversify, Realize, Integrate, Venture, Educate) Science Center, brought together a team of researchers from New Jersey Institute of Technology (NJIT), Princeton University, and NASA’s Ames Research Center in California’s Silicon Valley. The team turned to advanced artificial intelligence architectures — which dictate how data is processed and used to produce reliable predictions or actions — to capture subtle, time-based pattern changes on the solar surface before an active region took shape. By analyzing data captured by the agency’s Solar Dynamics Observatory and using NASA Ames’ supercomputing resources, this new approach, published in the Journal of Geophysical Research: Machine Learning and Computation, looks at fluctuations in acoustic waves caused by sunspot regions when the regions form beneath the solar surface and begin the journey upward to emerge on the surface. 

“We cannot directly see the magnetic structure while it is still rising through the solar interior. Instead, we must look for indirect effects — very small changes in the magnetic field and in the pattern of acoustic waves continually traveling through the Sun,” said Alexander Kosovichev, a COFFIES co-investigator at NJIT. “The developed technique identifies precursors associated with an emerging active region in slight changes of the Sun’s acoustic power — more like a slight change in rhythm within a very noisy orchestra.” 

This video is an example of what scientists use when analyzing the solar surface. This particular time frame tracks the magnetic field on the Sun’s surface during the emergence of active region AR11158 in February 2011. The blue square grid highlights a target area on the Sun. The squares on the right side translates the data from the target grid area to show opposing magnetic polarities, indicated by the warm and cool-colored tones. The first column of blocks shows targeted areas at original resolution, the middle column displays data as 2D maps, and the right column plots changes in magnetic polarity over time as 1D curves. By watching these blocks, scientists can see signs of active region emergence, such as drops in acoustic waves and rises in magnetic fields.
NASA’s COFFIES DRIVE Science Center/Irina Kitiashvili and Spiridon Kasapis

To develop current operational forecasts, the National Oceanic and Atmospheric Administration’s Space Weather Prediction Center and the United States Air Force monitor active regions that are already visible on the Sun to analyze the regions’ characteristics and estimate the probability of solar flares.

The COFFIES team aims to revolutionize this process. The AI model the team developed a specialized early detection system to handle very long sequences of data — called sliding-window transformer architecture — to use observations to find tiny reductions in the Sun’s acoustic activity and magnetic field, signals that scientists struggled to capture until now. These reductions form patterns that the AI model uses to predict active regions several hours before they become visible on the solar surface. Instead of looking at all activity on the solar surface at once, like earlier deep learning approaches have done, this new model moves a fixed-size “viewing window” across a long timeline of the Sun’s activity to focus on recent data while remembering overall patterns. This method allows forecasters the ability to predict approximate locations of emerging sunspots, rather than relying on counting already visible sunspots. 

This promising AI architecture shows how deep machine learning can contribute to heliophysics — the field studying the nature of the Sun and how it influences the very nature of space and the planets that exist there. While the model is not ready for operational real-time forecasting, the team plans to validate the approach across many more known solar events to fine-tune the model. 

NASA’s real-time space weather monitoring 

As NASA focuses on sending humans to explore the Moon with the Artemis missions and sending the first crewed missions to Mars, monitoring and forecasting space weather is important for ensuring the safety of our astronauts and the equipment they rely on. This predictive leap from the COFFIES team could prove vital for safeguarding technology and deep-space explorers from the volatile environment of our solar system.

NASA’s Moon to Mars Space Weather Analysis Office monitors space weather 7 days a week. This important work helps decision makers not only protect people and equipment but maintain the services our modern society relies on every day. NASA’s space weather monitoring is also critical for safeguarding astronauts as they journey to the Moon and onward to Mars.
NASA/Lacey Young

Teams across NASA and NOAA collaborate to transition research capabilities into actual 360-degree space weather monitoring operational tools — including NASA’s Space Radiation Analysis Group, Moon to Mars Space Weather Analysis Office (M2M SWAO), and Community Coordinated Modeling Center as well as NOAA’s Space Weather Prediction Center. Sunspot region emergence prediction capabilities, especially of the Sun’s far side, could provide new information that supplements current models used by these teams.  

“The COFFIES AI model is exciting to our team because it could provide us with new capabilities towards predicting potential flaring locations ahead of time,” said Michelangelo Romano, M2M SWAO deputy director. “With this heads up, we can provide additional support to NASA missions.”

NASA’s COFFIES is one of three DRIVE Science Centers created to encourage collaborative science by establishing centers that are made of multidisciplinary teams from several institutions across the U.S. These pioneering facilities employ modelers, theoreticians, computer scientists, and observers to study important mysteries of our star and its influence, a branch of science known as heliophysics.  

The COFFIES team focuses on the interconnected processes behind the Sun’s activity. Understanding the Sun’s interior and magnetic variability is key to advancing our understanding of the Sun’s 11-year activity cycle and fine-tuning space weather forecasting tools.  

About the Author

Desiree Apodaca

Desiree Apodaca

NASA’s Heliophysics Missions Communications Lead

Keep Exploring

Discover More Topics From NASA

For West Virginia Engineer, Home Is Where the Heart Is… and NASA, Too

13 August 2026 at 15:03
New civil servants pose together.
NASA’s Katherine Johnson Independent Verification and Validation Facility (IV&V) held a swearing-in ceremony for civil servants on Monday, Aug. 10, 2026, at the facility in Fairmont, West Virginia. In total, 51 new employees were hired at IV&V as part of NASA Administrator Jared Isaacman’s directive to strengthen NASA’s technical core competencies.

Growing up in Grafton, West Virginia, engrossed in Star Wars and all things science fiction, Fletcher Newell had an early interest in space exploration. That interest only grew when, in 2013, his fourth-grade class took a field trip to a nearby NASA facility he had not yet heard of – NASA’s Katherine Johnson Independent Verification & Validation Facility, located in Fairmont, West Virginia. Thirteen years later, Newell and 48 of his colleagues at the facility were sworn in as NASA civil servants during a ceremony on Aug. 10.

“I had always admired NASA from afar,” said Newell, who started working at IV&V as a systems engineer contractor in early 2025. “To my surprise, the agency was doing impactful work in my backyard.”
 
During high school, he began cultivating programming skills that would lay the foundation for his future. A self-professed computer aficionado, Newell taught himself how to code. In algebra class, he discovered that his graphing calculator was programmable, leading him to create basic scripts. He quickly moved to popular software applications, learning how they were built in order to develop his own programs. Artificial intelligence was still on the brink of becoming mainstream, but he was already asking himself, “What are the more interesting things we can teach computers to do?” As a junior in 2019, the precocious programmer merged his talents with his passion for space after being accepted into IV&V’s high school internship program.
Newell created a database for engineering methods, processing hundreds of documents to facilitate the work of his colleagues from a procedural aspect.

“Working as a high school intern really elevated my fascination for NASA,” he said.
 
Following graduation in 2020, Newell headed west to Stanford University in Palo Alto, California, majoring in, naturally, computer science, with a focus on AI and machine learning when both were scaling rapidly across industries and in everyday usage.
 
Instead of pursuing internships in the neighboring Silicon Valley – widely considered the global center for technological innovation – he returned to West Virginia for three consecutive summers, cutting his teeth at the Fairmont facility.

Fletcher Newell stands in front of a sounding rocket.
Fletcher Newell stands in front of the Katherine Johnson Independent Verification & Validation Facility in Fairmont, West Virginia, as a high school intern in 2019.
Photo courtesy: Fletcher Newell

He began researching AI safety as engineers learned how to give spacecraft more onboard autonomy and have them learn on their own. Later, he was on a team responsible for assessing the safety of Terrain Relative Navigation, a vision-based guidance technology that could enable spacecraft to land on planetary surfaces without GPS. During his final internship, generative AI – which creates content based on user prompts – was becoming widespread, and he worked on teams exploring how to responsibly integrate it into mission assurance.
 
Newell also performed research about autonomous space docking at Stanford’s Center for AI Safety, resulting in two publications. Following his undergraduate education, he remained at Stanford to earn a master’s in computer science.
 
When it came time to enter the workforce, one organization was atop his list. A contractor opportunity opened up at IV&V, and he leapt at the chance.
 
“I enjoyed the work at IV&V back in high school and college,” he said. “There’s nothing better than pursuing what aligns with your interests.”
 
As a systems engineer, he has worked primarily on mission safety and security, identifying and resolving system defects and vulnerabilities for such spacecraft as Space Reactor-1 (SR-1) Freedom, Orion, Gateway, and the Human Landing System, all while helping guide NASA’s responsible adoption and development of AI systems.
 
His colleagues took notice of their junior member’s contributions, resulting in Newell being named IV&V Engineer of the Year in 2025 less than a year into the job after identifying more than 70 issues in Gateway – and later SR-1 Freedom – with clear mission impact and, as noted in his award citation, developing a reputation for clearly articulating their implications.
 
“During his internships and now as a full-time engineer, Fletcher has consistently demonstrated exceptional talent, curiosity, and a passion for our mission,” said Wes Deadrick, IV&V director. “He could have gone almost anywhere after Stanford. The fact that he chose to come home to build his career supporting NASA through the IV&V Program makes me incredibly proud.”
 
The Aug. 10 ceremony for Newell and his colleagues was part of NASA’s workforce directive to bring core, mission-critical positions into the civil service, from early-career professionals to seasoned technical experts.
 
“It’s an investment in NASA’s future, giving us the opportunity to bring exceptionally talented people into the civil service while strengthening long-term technical capabilities that support our nation’s most challenging missions,” said Deadrick. “At IV&V, initiatives like this help ensure we continue providing independent expertise and mission assurance that our customers depend on.”
 
For Newell, as he takes this next step in his professional progression as a civil servant computer engineer, he looks forward to expanding on his responsibilities, especially to help NASA return to the Moon. He is currently helping identify safety and security issues, including ones that could impact crew safety and lead to the loss of spacecraft control, related to the agency’s lunar endeavors.
 
“At IV&V, teams are ensuring every major lunar vehicle and system will be ready to safely embark on their missions, not just for flying around the Moon, but also for putting American boots on the surface and eventually establishing and working on a Moon Base,” he said.
 
More than a decade after taking that field trip and now working on some of NASA’s high-priority missions, Newell readily admits he didn’t always envision staying in West Virginia.
 
“It was a little strange coming back, but I was continually getting to do amazing things at an amazing organization in a place I already know,” Newell said. “And that’s really cool.”

NASA Completes Astronaut-Deployed Science Instrument for Lunar Surface

11 August 2026 at 15:41
Rectangular box-shaped device resting on a metal table. The front face is covered with a grid of many small black rectangular panels bordered in white. Metal components, brackets, and small box units are mounted along the top. The background shows a large windowed wall with a blurred American flag and an Artemis flag visible behind the device.
The fully-integrated LEMS (Lunar Environment Monitoring Station) ready for environmental testing. A small suitcase-size instrument suite built at NASA Goddard, LEMS is designed to carry out continuous, long-term monitoring of the seismic environment at the Moon, including surface motion caused by moonquakes and meteorite impacts in the lunar south polar region.
NASA Goddard/Mike Guinto

NASA has declared “wrenches down” on the first completed payload designed for Artemis astronauts to deploy on the Moon’s surface. Engineers working on NASA’s Lunar Environment Monitoring Station, or LEMS, have completed hardware development and testing and the payload is ready for its permanent home near the lunar South Pole. With the hardware complete, LEMS is ready to support one of the Artemis program’s core goals: enabling sustained lunar science and exploration.

The LEMS instrument package contains two highly sensitive seismometers that will monitor ground vibrations from moonquakes and meteorite impacts, providing scientists with insights into the Moon’s interior and the seismic hazards astronauts might encounter at the surface. Its modular design allows the system to be adapted or expanded to host new instruments in the future, creating a reusable platform that can evolve as scientific priorities grow.

The payload will remain in a clean room at NASA’s Goddard Space Flight Center in Greenbelt, Maryland, where it was built, until it is assigned to an Artemis mission for deployment to the lunar surface.

“The completion of the LEMS scientific instrument is a major step in a new era of lunar surface science. Innovative science experiments will uncover, measure, and reveal the Moon’s secrets while astronauts open new frontiers for discovery,” said Joel Kearns, deputy associate administrator for exploration, Science Mission Directorate, NASA Headquarters in Washington. “And, behind the scenes, countless teams across NASA and our partners are pushing the boundaries of what surface instruments can do, building the tools that will make future exploration possible and safer.”

An astronaut in a white spacesuit kneels in simulated lunar soil while working with scientific equipment in a large testing facility. Staff members and support structures are visible in the background.
A scientist wearing NASA’s xEMU prototype space suit is testing the handling of a mockup version of NASA’s Lunar Environment Monitoring Station, or LEMS. The testing took place at the Active Response Gravity Offload System, a simulated reduced gravity environment at NASA’s Johnson Space Center in Houston.
NASA Johnson

The LEMS payload builds on a legacy of lunar seismic tracking. Apollo astronauts deployed a network of seismometers on the Moon’s nearside equatorial region between 1969 and 1972. Those instruments operated until 1977, recording about 13,000 moonquakes and other ground vibrations that helped scientists begin to understand the composition of the Moon’s interior. For decades, researchers have hoped to spread more seismometers, updated with new technologies, across the lunar surface.

Now, LEMS will carry the first seismometers to be deployed by future astronauts to listen for faint ground vibrations, collecting new clues to the Moon’s internal structure and ongoing seismic activity. The sensors will be the most compact, sensitive, and energy-efficient seismometers ever built for planetary exploration.

LEMS itself is about the size of a small suitcase, weighing 11 pounds in the Moon’s low-gravity environment. It will carry not just these seismic sensors, but everything it needs to function independently of humans after deployment. LEMS is built to manage its own power production via a lightweight, flexible solar array that conforms to the shape of the LEMS unit. It also will manage its operational activities to ensure continuous data collection based on a preset plan, and monthly data transmission to Earth. The payload will do all this while maintaining a stable internal temperature throughout the massive day-to-night temperature swings of the South Pole region.

A technician in a white clean-room suit and blue gloves uses a small flashlight to inspect a spacecraft instrument inside a dark testing chamber. Colorful wires and metallic components surround the instrument.
Mechanical Engineer Brie Ludwig inspects the Lunar Environment Monitoring Station (LEMS) in preparation for testing in a thermal vacuum chamber at Goddard Space Flight Center in Greenbelt, Maryland, on March 31, 2026. LEMS is a compact, autonomous, and self-sustaining seismometer suite designed to carry out continuous, long-term monitoring of the lunar seismic environment at the South Polar region.
NASA/Denny Henry

“When we conceived of LEMS, we weren’t just thinking about the next mission, we were thinking about the next generation of lunar exploration,” said Mehdi Benna, a University of Maryland Baltimore County scientist who leads LEMS from NASA Goddard. “Our vision was to create a scientific buoy for the Moon. Like an ocean buoy on Earth, LEMS is designed to be easy to build, adaptable to different scientific objectives, and capable of operating independently for years.”

Before any surface science could happen, Benna and his team had to ensure that LEMS could survive the trip to the Moon and the harsh environment of its surface. Over the past five months, LEMS and its components have been subjected to a demanding series of environmental and operational tests. Engineers verified LEMS can endure the violent shaking of launch, the journey to the lunar surface, and the Moon’s temperature and radiation environment. The team also showed that the instrument package’s mechanical and electrical design is safe for astronaut handling.

The LEMS payload was built to operate through the lunar night, which lasts two Earth weeks, without external power assistance or a heat source. Past lunar surface instruments relied on radioisotope heaters for warmth and power. But LEMS instead will withstand temperatures that dip to minus 400 degrees Fahrenheit in some areas by using advanced insulation materials, low-thermal-conductivity cables that minimize heat loss, and a thermal regulator that conducts heat away during the day to prevent overheating and helps retain heat at night.

These innovations reduce mass and power needs, setting the stage for lighter, energy-efficient instruments that can operate continuously at future Artemis landing sites and the NASA-led Moon Base.

The LEMS payload is led by University of Maryland Baltimore County and University of Maryland College Park. Technical implementation is led by NASA Goddard. The University of Arizona, in partnership with Silicon Audio, Inc., supplied LEMS’ two state-of-the-art seismometers. Morehead State University in Kentucky provided LEMS’ telecommunication system and will operate the instrument on the surface. Washington University in St. Louis will manage the instrument’s data processing and dissemination to the larger scientific community.

Lion Nebula Roars to Life With NASA’s Webb

10 August 2026 at 10:00
 
4 Min Read

Lion Nebula Roars to Life With NASA’s Webb

JWST’s Near Infrared Camera and Mid Infrared Instrument combined image of planetary nebula NGC 2392, the Lion Nebula, against the black background of space. The nebula is at center, circular in shape, and looks like a male lion’s head. In the center is a small, pinkish-white circle with eight-point diffraction spikes, a white dwarf star. Surrounding the star are purple-pink cavernous bubbles and shell-like rings. The bubbles and shells collectively form an oval with two small, wide arcs near the top, reminiscent of a lion’s face and its ears. What appears to be extended outward from the lion’s face is a thick ring of purple-blue material. The width of the ring is consistent throughout and resembles a mane. The area closest to the lion’s face looks cloudy, while the edges of the mane look like there are clumps of dust with comet-like tails. In the background are distant galaxies and stars. Some galaxies are yellow and orange points of light and others have spiral structures. Some stars have diffraction spikes.
NASA’s James Webb Space Telescope imaged the planetary nebula NGC 2392, the Lion Nebula, using the observatory’s NIRCam and MIRI instruments. The central star’s remains are responsible for the nebula’s structure, including a lion face-shaped bubble of ionized gas and dust “mane.”
Credits:
Image: NASA, ESA, CSA, STScI; Image Processing: Alyssa Pagan (STScI)

Observing across the starry “plains” of space, NASA’s James Webb Space Telescope has taken new images of NGC 2392, nicknamed the Lion Nebula. NASA’s Hubble Space Telescope previously viewed this planetary nebula in 2000, imaging the lion face-shaped target in visible light and revealing features such as the “mane” of hazy, comet-shaped objects. Now Webb has captured a clearer, more detailed view of the Lion Nebula due to its high-resolution imaging.

Lion Nebula (NIRCam and MIRI Image)

JWSTu2019s Near Infrared Camera and Mid Infrared Instrument combined image of planetary nebula NGC 2392, the Lion Nebula, against the black background of space. The nebula is at center, circular in shape, and looks like a male lionu2019s head. In the center is a small, pinkish-white circle with eight-point diffraction spikes, a white dwarf star. Surrounding the star are purple-pink cavernous bubbles and shell-like rings. The bubbles and shells collectively form an oval with two small, wide arcs near the top, reminiscent of a lionu2019s face and its ears. What appears to be extended outward from the lionu2019s face is a thick ring of purple-blue material. The width of the ring is consistent throughout and resembles a mane. The area closest to the lionu2019s face looks cloudy, while the edges of the mane look like there are clumps of dust with comet-like tails. In the background are distant galaxies and stars. Some galaxies are yellow and orange points of light and others have spiral structures. Some stars have diffraction spikes.
NASA’s James Webb Space Telescope imaged the planetary nebula NGC 2392, the Lion Nebula, using the observatory’s NIRCam and MIRI instruments. The central star’s remains are responsible for the nebula’s structure, including a lion face-shaped bubble of ionized gas and dust “mane.”
Image: NASA, ESA, CSA, STScI; Image Processing: Alyssa Pagan (STScI)

At first glance the nebula’s overall structure in Webb’s infrared images, with both the NIRCam (Near Infrared Camera) and MIRI (Mid Infrared Instrument) instruments, may look quite similar to Hubble’s earlier visible-light view. However, Webb’s infrared vision highlights features like compact clumps of dust and a haze of ionized gas. It’s taken several thousand years for this collection of gas and dust to reach its current shape, and the nebula’s components continue to be altered.

The source of these constant changes and the reason for the Lion Nebula’s distinct appearance is located at the center: the remains of a dying star. Though it looks like the button nose of the lion, its energy and radiation are powering the intricate structures seen here.

Lion Nebula (MIRI Image)

Planetary nebula NGC 2392, also called the Lion Nebula, against the black background of space. The nebula is in the center, circular in shape, and looks like a male lion’s head. In the very center is a small, bluish-white circle with eight-point diffraction spikes, a white dwarf star. Surrounding the star are light purple-red cavernous bubbles and shell-like rings. The bubbles and shells collectively form an oval with two small, wide arcs near the top, reminiscent of a lion’s face and its ears. What appears to be extended outward from the lion’s face is a thick ring of cyan material. The width of the ring is consistent throughout and resembles a mane. The area closest to the lion’s face looks cloudy, while the edges of the mane look like there are purple clumps of dust with comet-like tails and strands. In the background are distant galaxies and stars. Some galaxies appear as small purple points of light and others with visible blue spiral structures. A couple of the stars have diffraction spikes.
NASA’s James Webb Space Telescope’s mid-infrared image of planetary nebula NGC 2392, nicknamed the Lion Nebula, highlights the varying dust structures. Some dust is being destroyed by the dying central star’s radiation, while some dust filaments manage to survive.
Image: NASA, ESA, CSA, STScI; Image Processing: Alyssa Pagan (STScI)

Massive stars undergo supernova explosions at the end of their lives, but these kinds of events are few and far in between. Most of the universe’s stars have lower masses, like the one belonging to NGC 2392. When a lower-mass star can no longer sustain itself with nuclear reactions in its core, the star becomes unstable and pulsates, losing its mass by shedding its outer layers, which then turn into shells of gas and dust called a planetary nebula. (Stars at this life stage are responsible for producing much of the universe’s observable dust.) The star’s radiation drives the ejected material away, leaving behind the very hot stellar core, also known as a white dwarf.

In the Lion Nebula’s case, the death of the oxygen-rich central star has left behind a white dwarf that is “cooking” everything from the inside and producing a bubble of ionized gas as it does. The gas bubble, which forms the lion’s face, is expanding over time and destroying dust that is in its path. Understanding why the swept-up gas has a complex structure of rings and shells, a common feature in planetary nebulae, is an ongoing endeavor.

The mane of the lion is the interior of a dust shell that is being illuminated by the white dwarf at the center. The tufts of hair, which look like cometary tails of material, are compact clumps of dust that have survived the stellar core’s radiation and protect the material that lies behind them.

Webb’s imagery “freezes” this planetary nebula in time, though the star’s death, and its tumultuous effects, go on. NGC 2392 will continue to undergo changes as its gas and dust migrate away from the stellar core. Astronomers estimate the lion will eventually disperse in approximately 10,000 years — a relatively short period in astronomical terms.

The James Webb Space Telescope is the world’s premier space science observatory. Webb is solving mysteries in our solar system, looking beyond to distant worlds around other stars, and probing the mysterious structures and origins of our universe and our place in it. Webb is an international program led by NASA with its partners, ESA (European Space Agency) and CSA (Canadian Space Agency).

To learn more about Webb, visit:

https://science.nasa.gov/webb

Downloads & Related Information

The following sections contain links to download this article’s images and videos in all available resolutions followed by related information links, media contacts, and if available, research paper and Spanish translation links.

Related Images & Videos

JWSTu2019s Near Infrared Camera and Mid Infrared Instrument combined image of planetary nebula NGC 2392, the Lion Nebula, against the black background of space. The nebula is at center, circular in shape, and looks like a male lionu2019s head. In the center is a small, pinkish-white circle with eight-point diffraction spikes, a white dwarf star. Surrounding the star are purple-pink cavernous bubbles and shell-like rings. The bubbles and shells collectively form an oval with two small, wide arcs near the top, reminiscent of a lionu2019s face and its ears. What appears to be extended outward from the lionu2019s face is a thick ring of purple-blue material. The width of the ring is consistent throughout and resembles a mane. The area closest to the lionu2019s face looks cloudy, while the edges of the mane look like there are clumps of dust with comet-like tails. In the background are distant galaxies and stars. Some galaxies are yellow and orange points of light and others have spiral structures. Some stars have diffraction spikes.

Lion Nebula (NIRCam and MIRI Image)

NASA’s James Webb Space Telescope imaged the planetary nebula NGC 2392, the Lion Nebula, using the observatory’s NIRCam and MIRI instruments. The central star’s remains are responsible for the nebula’s structure, including a lion face-shaped bubble of ionized gas and dust “mane.”

Planetary nebula NGC 2392, also called the Lion Nebula, against the black background of space. The nebula is in the center, circular in shape, and looks like a male lionu2019s head. In the very center is a small, bluish-white circle with eight-point diffraction spikes, a white dwarf star. Surrounding the star are light purple-red cavernous bubbles and shell-like rings. The bubbles and shells collectively form an oval with two small, wide arcs near the top, reminiscent of a lionu2019s face and its ears. What appears to be extended outward from the lionu2019s face is a thick ring of cyan material. The width of the ring is consistent throughout and resembles a mane. The area closest to the lionu2019s face looks cloudy, while the edges of the mane look like there are purple clumps of dust with comet-like tails and strands. In the background are distant galaxies and stars. Some galaxies appear as small purple points of light and others with visible blue spiral structures. A couple of the stars have diffraction spikes.

Lion Nebula (MIRI Image)

NASA’s James Webb Space Telescope’s mid-infrared image of planetary nebula NGC 2392, nicknamed the Lion Nebula, highlights the varying dust structures. Some dust is being destroyed by the dying central star’s radiation, while some dust filaments manage to survive.

Related Links

Explore more: Sonification of NGC 2392

View more: Hubble Image of NGC 2392

View more: Chandra X-ray Observatory Image of NGC 2392

More Webb: News | Images | Science | Home Page


Share

Details

Last Updated
Aug 10, 2026

Contact
Media

Laura Betz
NASA’s Goddard Space Flight Center
Greenbelt, Maryland
laura.e.betz@nasa.gov

Abigail Major
Space Telescope Science Institute
Baltimore, Maryland

Christine Pulliam
Space Telescope Science Institute
Baltimore, Maryland

NASA Will Attempt to Observe Rocket Part’s Lunar Impact

By: jjrussel
4 August 2026 at 16:00
The Moon's rugged surface is on display in this image. Most of the Moon is visible, with the bottom of the sphere disappearing into the darkness. This line between light and dark is called the terminator. The terminator is lined with many craters.
The Moon’s rocky, uneven, and otherworldly surface features are highlighted by the terminator – the difference between light and darkness.
NASA

Using ground-based telescopes and space-based assets, NASA and SpaceX are tracking a used Falcon 9 upper stage from a commercial mission expected to impact the Moon on Wednesday, Aug. 5, near the Einstein and Bell craters. The impact poses no danger to Earth and NASA scientists are planning to collect lunar data from the event and refine techniques for tracking objects in space. 

On Jan. 15, 2025, SpaceX launched the Falcon 9 rocket and successfully deployed Firefly Aerospace’s Blue Ghost 1 lunar lander to the Moon under NASA’s CLPS (Commercial Lunar Payload Services) initiative. Solar activity and gravitational forces caused the stage’s unplanned return to the Moon. NASA and SpaceX remain in communication about the upper stage and its flight path.

Independent astronomers first identified the trajectory using publicly available data. NASA’s Center for Near Earth Object Studies at the agency’s Jet Propulsion Laboratory in Southern California, which tracks natural objects that could pose hazards to Earth, later confirmed the stage has a 100% chance of impacting the Moon. NASA will continue tracking it as part of training operations.

Because the Moon has no atmosphere to slow incoming objects, it is struck by meteoroids daily. Human‑made object impacts are far less common but do occur. The rocket stage is expected to create a crater about 60 feet wide and 12 feet deep and throw dust and rock outward as ejecta. For comparison, a meteoroid with the same energy as the upper stage hits the Moon about every six days, so the lunar surface is constantly absorbing impacts with the same force. Despite the disturbance, observing impacts gives scientists valuable insight by revealing how ejecta plumes behave, helping to understand the Moon’s geology and refine models that guide future exploration and science missions.

The impact will not be visible to the naked eye on Earth, but NASA will attempt to observe it in real time. The Meteoroid Environments Office at the agency’s Marshall Space Flight Center in Huntsville, will use ground‑based telescopes to image the impact; however, weather and lighting conditions may make viewing difficult.

Additionally, NASA’s Lunar Reconnaissance Orbiter and the ShadowCam instrument aboard South Korea’s Korea Pathfinder Lunar Orbiter will look for chances to image the site before and after the impact. Image availability will depend on lighting, orbital timing, and spacecraft position, and it may take several days to receive imagery. Any data collected will help scientists better understand artificial impacts and their exploration implications.

Although unplanned in this instance, disposing of upper stages on the lunar surface is a technically accepted and safe method and, in some cases, can be the only practical option for missions in low lunar orbit. Many operators choose controlled impacts because they provide predictable and trackable end of life outcomes.

NASA is committed to debris mitigation and demonstrating responsible disposal practices that safeguard Earth, its orbital environment, and other planetary bodies while enabling discoveries that deepen our understanding of the solar system and benefit humanity.

❌
❌