Two new highly requested iCloud plugins just got added to ChatGPT, giving people who rely on Apple’s Mail and Calendar services a way to search emails, check appointments, and manage their schedules directly through the chatbot. The integration is rolling out to all ChatGPT plans, including the free tier. You can access it on the […]
A map depicts vegetated parts of Earth’s land surfaces from September 29 to October 4. Vegetation color is depicted on a spectrum ranging from dark green to light yellow to dark red. The largest patches of red vegetation appear in Alaska, northern Canada, Mongolia, and Russia. Smaller patches of red are visible in Australia.
NASA Earth Observatory / Lauren Dauphin
A similar global map depicts the redness of vegetation from October 5 to 11. The reddest areas have shifted equatorward, with more color visible in the Mid-Atlantic, the U.S. Southeast, southern Russia, China, and Mongolia.
NASA Earth Observatory / Lauren Dauphin
September 29 to October 4
October 5 to 11
These maps show the redness of vegetation as measured by the OCI (Ocean Color Instrument) on the PACE (Plankton, Aerosol, Cloud, ocean Ecosystem) satellite in September and October 2026. Red foliage appears to peak in New England, northern Canada, and northern Russia from September 29 to October 4, then spreads southward into the Mid-Atlantic, Mongolia, and northern China from October 5 to 11 (right).
The Japanese tradition of momijigari, or “red leaf hunting,” stretches back more than a millennium, as evidenced by ancient poems describing journeys to admire fall foliage. In America, mentions of foliage trips began appearing in the historical record in the 19th century, around the time artists and poets such as Frederic Church and Emily Dickinson celebrated autumn color in depictions of the Northeast.
Modern-day leaf peepers have a new way to track and savor the seasonal phenomenon. The hyperspectral OCI (Ocean Color Instrument) on NASA’s PACE (Plankton, Aerosol, Cloud, ocean Ecosystem) satellite observes the planet’s oceans and vegetation daily at 286 spectral bands. Among this array are a few groups of wavelengths that allow scientists to track subtle changes in leaf pigments key to fall foliage displays, including anthocyanins (reds), carotenoids (yellows and oranges), and chlorophylls (greens).
NASA scientists can track fall color by measuring how much red, orange, and yellow forests show compared with green. Tracking the ratio over time reveals where leaves are changing and when color peaks. The maps above show vegetation “redness” from September 29 to October 4 (left) and October 5 to 11 (right). Areas shown in green have values near 1, meaning the satellite detects about as much red as green, and most leaves have not yet turned. Areas shown in light yellow and red have higher values, indicating progressively more red pigment relative to green.
The satellite detected particularly high levels of redness in parts of northern and eastern Russia, northern Alaska, and northern Canada from September 29 to October 4. In New England and upstate New York, redness began to fade during the week of October 5 to 11, even as it spread across much of the Midwest and the Mid-Atlantic. (Not all the yellows and reds on the maps represent fall colors. Crops in some agricultural areas, for instance, show high anthocyanin levels as they age and after they are harvested. Also, in some regions, clouds produce what appear to be gaps in the vegetation.)
Seeing Red in Vermont
Many of the reddest areas—such as the Adirondacks in New York, the Green Mountains in Vermont, and the White Mountains in New Hampshire—have large numbers of sugar maples (Acer saccharum) and red maples (Acer rubrum), deciduous trees that turn a brilliant shade of crimson in the fall. Blueberries, bilberries, sedges, mosses, and grasses likely contribute to the intense reds detected in marshy tundra areas in northern Alaska, Canada, and Russia.
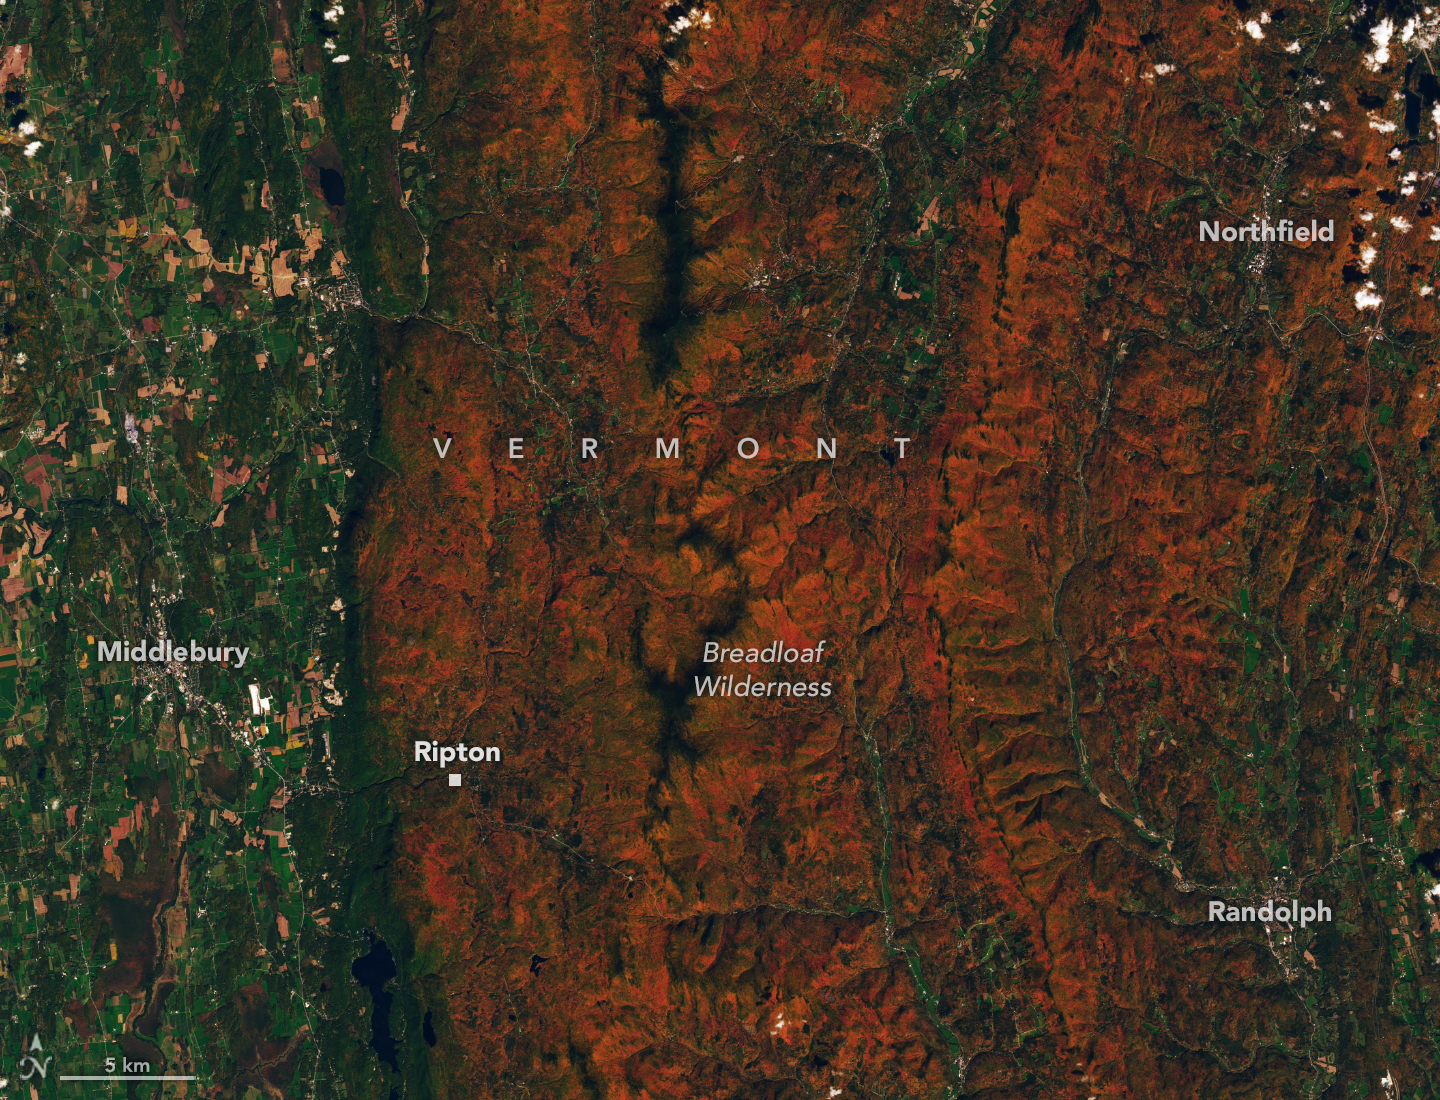
Red and orange hues cover the forested ridges of central Vermont, while river valleys and lower-elevation areas are still green. The OLI (Operational Land Imager) on Landsat 9 captured this image on October 3, 2026.
NASA Earth Observatory / Lauren Dauphin
The OLI (Operational Land Imager) on Landsat 9 captured an image (above) of intensely red foliage around Ripton, Vermont, on October 3, 2026, around the peak of redness in the region. Poet Robert Frost, author of “October,” “The Road Not Taken,” “Nothing Gold Can Stay,” and several other poems that evoke fall foliage, kept a summer home and farm in Ripton and taught at Middlebury’s Bread Loaf School of English.
Some other satellites with hyperspectral sensors can measure fall foliage pigments in a way that is similar to PACE, but only in more localized areas and less frequently. PACE is the first satellite capable of measuring all three key leaf pigments—anthocyanins, carotenoids, and chlorophylls—across the entire planet every day or two.
“It’s the ability to collect time-series data of anthocyanins and carotenoids everywhere on Earth repeatedly that is game-changing,” said Karl Huemmrich, a vegetation scientist with the Goddard Earth Sciences Technology and Research II center at the University of Maryland, Baltimore County. Huemmrich, who is also a member of the PACE science team, was eager to work with the satellite because of OCI’s broad swath and short revisit time. “The time-series data allow us to determine peak redness and yellowness anywhere on Earth,” he said.
In the fall, leaves change colors as they lose chlorophyll, a green molecule that plants use to synthesize food. Since chlorophyll is not a stable compound, plants must continuously synthesize it, a process that requires ample sunlight and warm temperatures. As temperatures decrease and days shorten in autumn, levels of chlorophyll drop, causing greens to fade and presenting an opportunity for carotenoids and anthocyanins to show their colors.
Observing Leaves in a Canopy Near You
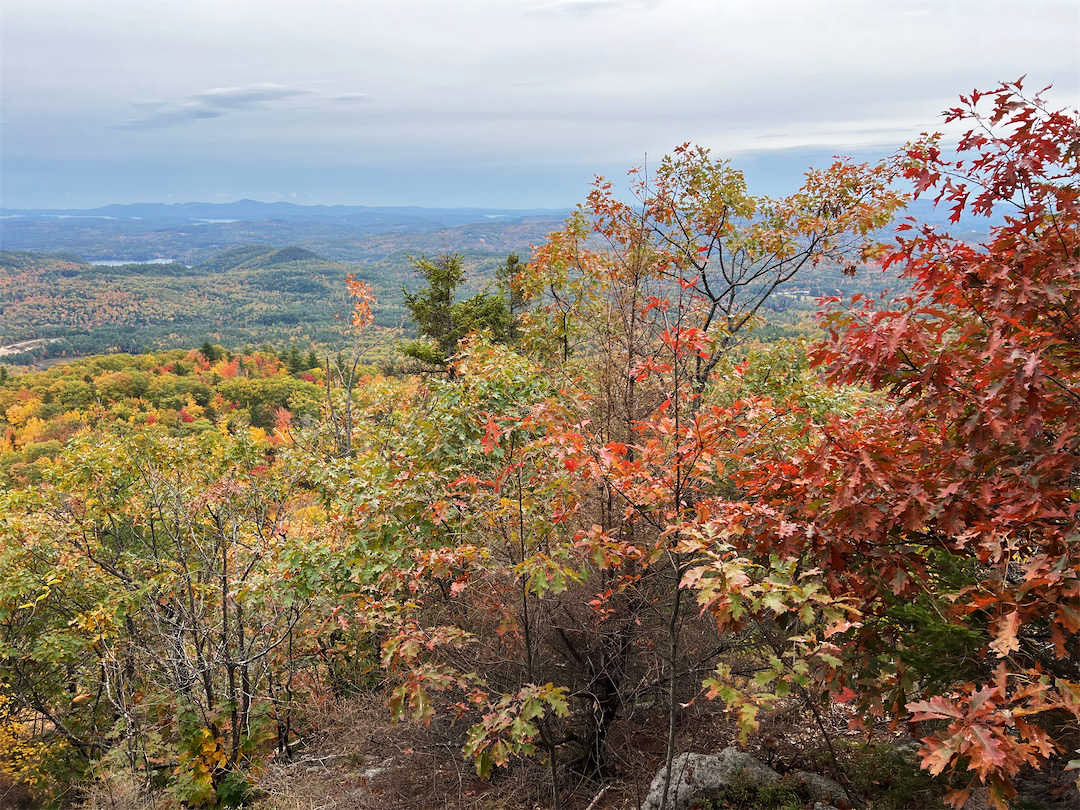
As part of the ongoing North American Phenology Campaign run by the Global Learning and Observations to Benefit the Environment (GLOBE) program, NASA data scientist Skye Caplan has been posting weekly foliage maps of vegetation redness. The maps show waves of red emerging in the high latitudes in August and shifting equatorward in September and October. The PACE team is asking the public to submit photos of fall foliage to help scientists “ground truth” the satellite observations and better understand how various factors influence vegetation color.
Fall foliage sprinkles a forested New England landscape in a photo taken in Meredith, New Hampshire, on October 11, 2026, by a participant in GLOBE’s North America Phenology Campaign.
GLOBE
“Changes in pigments can also occur when vegetation is stressed due to drought or insect damage,” said Caplan. She noted that changes like these likely help explain why PACE measures high levels of redness in agricultural regions of Brazil, Australia, and Canada that don’t track closely with broader seasonal changes.
“The more photos we can get from the ground, the better,” Caplan said. Ground photos help scientists refine PACE’s observations of vegetation color, which the team hopes will eventually support several lines of research. These include how the timing of spring greening and fall senescence is changing, how vegetation changes affect the global carbon cycle, and how leaf color influences wildfire risk. Scientists also want to know whether PACE can detect early warning signs of drought, insect infestations, and plant disease.
People can participate in the GLOBE campaign even if they live in an area without dense forests or picturesque fall foliage displays. Scientists also want ground observations of shrubs, grasses, wildflowers, evergreens, crops, and other vegetation. But when it comes to “red leaf hunting,” don’t delay, Caplan said. “Color changes happen kind of slowly, then all at once, and then they’re gone.”
NASA Earth Observatory images by Lauren Dauphin, using PACE data courtesy of Skye Caplan/NASA’s Goddard Space Flight Center and Landsat data from the U.S. Geological Survey.Photo courtesy of the GLOBE Program. Story by Adam Voiland.
Google would certainly prefer that everyone used its Gemini models with Google Cloud services, but soon, you'll have more options. OpenAI and Google have come to an arrangement that will see the former's frontier models arrive in Google Cloud services. Perhaps more importantly, GPT models will soon appear in Antigravity, Google's agent-powered coding tool.
For enterprise customers and AI enthusiasts, OpenAI's latest model will appear in Google's "Model Garden" in the coming weeks, adding to its 200-plus options. The garden already offers access to Google's Gemini models, as well as an assortment of open models like Mistral, Llama, and Gemma. Anthropic's Claude AI has also been available for some time. Google says it's now the only large cloud provider offering access to all three leading closed LLMs.
While OpenAI notes that Microsoft continues to be its primary cloud partner, the full suite of current GPT 6 and 6.1 models—Astra, Sol, and Luna—will launch on Google Cloud. Astra will naturally cost the most to run, but Google's system supports dynamically moving workloads between LLMs based on performance, latency, and efficiency.
OpenAI is bringing its models to Google Cloud's model garden and Antigravity coding tool, putting its technology on all three major U.S. cloud platforms after Microsoft's exclusive license ended earlier this year. "Google Cloud's longstanding investment in machine learning and AI has made it a destination for AI workloads and the developers and data scientists building them," OpenAI said in a blog post. It continues: [...] The integration will pair OpenAI's frontier models with Google Cloud's built-in access controls, centralized data governance, and high-performance infrastructure to support demanding enterprise workloads.
Google Cloud customers will be able to purchase OpenAI frontier models via model garden, transacted through the Google Cloud Marketplace. Enterprises with Google Cloud spend commitments will be able to draw down their GCP commitments for these purchases.
Additionally, OpenAI models will soon be available in Google Antigravity and the Gemini Agent, providing enterprise customers with model choice flexibility and the best model for each task. [...] For context, Microsoft previously held exclusive licensing rights to OpenAI's intellectual property, but that arrangement ended less than six months ago as OpenAI began expanding its partnerships with other cloud providers.
Just one day after Microsoft's exclusivity ended, Amazon announced plans to host OpenAI's models on its cloud platform in April.
"Cloudflare has acquired Deno, the company behind the [server-side] JavaScript and TypeScript runtime created by Ryan Dahl, the inventor of Node.js," Forbes reported last week.
But Deno "has no future at Cloudflare, which will maintain the runtime for another year before ending its development," writes The Register. "That's OK with Dahl. 'I am now of the opinion that if you're choosing Node.js for building servers, you're doing it wrong,' Dahl told The Register."
It all started with his team's work on the platform Deno Deploy, "We wanted to make running applications as straightforward as possible," Dahl
wrote on the official Deno blog. "But building and operating Deploy also showed us how much complexity remained underneath that developer experience. I wanted to simplify that layer, too."
This led to celld. Building on the Cloudflare Workers programming model, celld lets developers build distributed applications from the start while making the system simple to operate. What excites me greatly is that the scaling is built into the programming model, rather than infrastructure each app has to assemble itself.... We want to make this programming model the default way to build servers, whether you run on Cloudflare's network or your own infrastructure.
Joining also means choosing where to focus our effort... Deno will remain open source, and we welcome others who want to continue its development. Deno Deploy will continue operating for six months before shutting down. We will provide migration support for paying customers moving to Cloudflare Workers. [Deno's JSR package registry for JavaScript and TypeScript] will continue operating, with its infrastructure moving to Cloudflare.
Forbes argues that this acquisition of Deno "turns a long-standing objection to Cloudflare Workers, the claim that applications built on it cannot easily leave, into a selling point."
For CIOs evaluating serverless and edge platforms, portability now has a concrete answer... Released in August, [celld] is a single Rust binary that runs Workers and Durable Objects across many machines, with object storage as its only external dependency. Operators run multiple celld instances against one storage bucket, and the software handles placement, routing and persistence. Dahl and Belder will now lead an effort to merge celld into workerd and make self-hosting a supported way to run Workers applications. With this, customers can build an application on Cloudflare's network and move it to a private data center without rewriting it.
"With Deno, we improved the experience of writing JavaScript," Dahl argues on the Cloudflare blog, "but we didn't fundamentally change what developers had to assemble around the runtime. The bigger problems are around networked applications: distributing computation, coordinating state, data storage in general, and autoscaling to meet demand..."
Could the programming model make partitioning across machines part of the design from the start? The solution clicked into focus when I read about Cloudflare's Durable Objects. It provided a very powerful abstraction: the distributed singleton with a SQLite database. Each Durable Object is like a small, individually addressable server with its own relational database. Its JavaScript execution is single-threaded (which is easy to reason about), it handles WebSockets, and its local SQLite database can be accessed synchronously. By building a chat application using one Durable Object per channel, you have sharded your data and WebSocket connections, and thus made your application scalable... What excites me is the leverage this model gives developers: compute, relational databases, queues, and real-time communication primitives designed for applications distributed across machines.
Now Dahl and 12 of his Deno colleagues "will work to build out Cloudflare's Workers platform," explains The Register, "expanding it for potential open-source use. He feels this approach is the way to go."
"Right now, every other server is really operating at the Linux VM layer. That is not what Cloudflare Workers are," he said...
The ever-fickle Dahl first debuted Deno in 2018 as a rewrite of Node. The name 'Deno' is an anagram of Node, and it was Dahl's attempt to fix everything he felt he got wrong with Node — built-in fetch, a permission model, native TypeScript support et al. Sequoia backed Dahl's company for $21 million in 2022, and as of August, Deno amassed 400,000 monthly users. Nonetheless, Node's gravity proved too heavy for Deno to achieve escape velocity.
"What we found over years of working on Deno is that you can't really deviate from Node.js very much," Dahl told The Register. "As we continued to try to get adoption for Deno, we found we had to essentially backpedal on some of the original promises and become more Node compatible over time, and that left us as a kind of an alternative Node.js implementation." Going forward, Cloudflare will supply Deno with bug fixes and security patches for the next year, while Dahl looks for a new home for the MIT-licensed open source project.
Dahl's worked could bring "yet another revolutionary turn for server-side JavaScript," the article argues, "offering a runtime that would require only 300 KB of memory per instance, rather than the hundreds of megabytes now required for Node/Deno. Such savings could quickly add up for a cloud provider, especially one serving the voracious agentic market."
And as Dahl wrote on the Deno blog, "The need for better abstractions is especially acute with AI. Durable Objects bring together capabilities that are particularly useful for agent harnesses: inexpensive, serverless execution, persistent state, WebSockets, and a high-level JavaScript interface. This is what I'm most excited to explore and why celld focuses on Durable Objects."
This visualization compares three ocean data products, sea surface temperature anomaly, apparent visible wavelength, and sea surface height anomaly, over the same months in 2025 and 2026. Signals of El Niño in each map are highlighted with pop-up labels.
Credits: NASA’s Scientific Visualization Studio
A phenomenon rarer than a solar eclipse and more powerful than any single storm system is unfolding this fall, and NASA is tracking it closely.
El Niño is a natural climate pattern that emerges roughly every two to seven years marked by warmer-than-normal water temperatures in parts of the equatorial Pacific. NASA scientists are keeping watch as it flips trade winds, redistributes ocean heat, scrambles rain patterns, and raises sea surface height across parts of the Pacific.
As of October, the National Oceanic and Atmospheric Administration (NOAA) has said that there’s an 83% chance that the strongest El Niño since 1950 is currently unfolding. People around the world, including farmers, firefighters, and coastal communities, are already experiencing the effects in different ways.
Follow along with these maps as NASA tracks El Niño from its epicenter in the equatorial Pacific Ocean.
Sea surface height in flux
Lower-than-normal sea level conditions appear blue, and higher areas are orange and red in this map, which compares the ocean in 2025 (a weak La Niña year) and 2026. The map was created using altimetry data from the Sentinel-6 satellites, which measure water height for the entire ocean every 10 days, down to fractions of an inch.
Credit: NASA’s Scientific Visualization Studio
One of the first clues appeared in satellite imagery in January 2026, when a swell of warm water called a Kelvin wave was spotted near Micronesia in the western Pacific. Kelvin waves are slow-moving pulses of water thousands of miles long. Like underwater freeways, they transfer heat from west to east across the Pacific. The warm water heats the air directly above it, making it rise. The change in air pressures weakens or even reverses the trade winds that typically blow in the opposing direction, from the Americas toward Asia, causing sea levels in the eastern Pacific to rise further, and waters to warm even more. This chain reaction signifies the start of an El Niño.
The map above shows that by early April, those Kelvin waves had reached the eastern Pacific, and sea surface temperatures had begun to warm. Warm water expands in volume, elevating local sea levels in some areas by as much as 1 to 1.3 feet (30 to 40 centimeters). The higher-than-normal water can be seen sloshing toward South America then moving up the coast to California. Sea levels that are six to eight inches (15 to 20 centimeters) lower than normal are visible around Indonesia and northern Australia.
“Kelvin waves are like the heartbeat of El Niño,” said Josh Willis, project scientist for sea level missions at NASA’s Jet Propulsion Laboratory in Southern California. “And our sea level satellites let us peer into the ocean and watch every beat.”
Scientists have used satellite altimetry to track the height of the ocean with ultraprecision since 1993. That unbroken data record continues today with the Sentinel-6 satellites. State-of-the-art radar altimeters aboard these satellites survey millions of square miles of ocean in a single day, complementing NOAA’s fleet of ocean sensors and buoys drifting and diving through the water below.
Warming Pacific waters
The map above compares sea surface temperatures in 2025 (a weak La Niña year) and 2026. Data are acquired from satellite instruments, buoys, and ship sensors.
Credit: NASA’s Scientific Visualization Studio
Warmer-than-normal seawater is one of the best-known indicators of El Niño. Already, sea surface temperatures in the eastern Pacific are about 3 degrees Fahrenheit (1.7 degrees Celsius) warmer than the long-term average and could jump another fraction of a degree in the coming months, Willis said.
Satellites carrying microwave and infrared radiometers can see through and around clouds to measure heat energy at the sea surface. Satellites in 2026 mapped the band of warmer-than-normal water as it expanded throughout the spring. The band, seen in dark red, stretches for millions of square miles from the heart of the Pacific to the coast of South America. Ocean temperatures can influence weather patterns around the world. Air above the water’s surface carries heat and moisture into the atmosphere, seeding rainstorms and rearranging weather patterns across the globe.
Ocean gets bluer
The map above compares Apparent Visible Wavelength from 2025 (a weak La Niña year) and 2026. Apparent Visible Wavelength is a data product from NASA’s PACE satellite utilizing ocean color data from the Ocean Color Instrument.
Credit: NASA’s Scientific Visualization Studio
El Niño’s warm waters also change the color of the ocean. A NASA satellite is tracking these subtle shifts in hues, as equatorial Pacific waters have become measurably more blue over the last several months.
“Some people think of water as being just blue, but it’s amazing the multitude of colors the ocean can be,” said Matthew Kehrli, a lead research scientist for the PACE (Plankton, Aerosol, Cloud, ocean Ecosystem) satellite team at NASA’s Goddard Space Flight Center in Greenbelt, Maryland.
This spectrum is in part thanks to microscopic plants called phytoplankton, which form the basis of the marine food web. There are thousands of different species of phytoplankton, which come in shades like teal, brown, or green. This year, in areas of the Pacific Ocean along the equator that are typically lush with phytoplankton and greener as a result, these hues are waning.
This is an expected effect of El Niño. Phytoplankton thrive in cool, nutrient-rich waters, but during an El Niño, the weakening trade winds reduce the upwelling of nutrient-rich deep water to the ocean surface. With limited food supply, phytoplankton abundance drops. This decline can trigger cascading effects across the marine food web, forcing other marine life to relocate to new feeding grounds.
This year’s El Niño is the first since PACE launched in 2024, providing new views of the phenomenon. The Ocean Color Instrument aboard PACE observes the ocean in hyperspectral color — across several hundred different wavelengths of visible, near-infrared, and ultraviolet light — monitoring phytoplankton and other ocean-color changes in near-real time. With PACE data, researchers calculate the average color of the ocean, simplifying spectra of light into a single number, known as apparent visible wavelength.
The 2026 map above shows the green area along the equator in the western Pacific Ocean shrink as a bluer shade fills in, indicating fewer phytoplankton. In contrast, the map from 2025 shows how the green-hued section stays steady over time.
“You have expectations of what you would think would happen,” Kehrli said. “But to visually see the results with the data products that you’re working with in real time is gratifying.”
NASA scientists will continue to monitor the signs and impacts of this El Niño with its fleet of Earth-observing satellites.
“El Niño touches almost all of us in some way every time it occurs,” Willis said. “While many have seen what it can do, we look to the ocean to understand why.”
Built on Qwen3.5-2B, the System One model executes sub-31ms local inference, allowing enterprises to run automated classifications quickly, at low cost and completely offline without transmitting sensitive data to third-party cloud servers.
TL;DR: Sui and Alibaba Cloud are working on an integration that would let AI agents pay for cloud services per request using stablecoins within budgets set by their owners. The collaboration was unveiled at Sui Basecamp and remains under development, with no public launch date yet.
Sui and Alibaba Cloud are working on a payments model that would allow autonomous AI agents to pay for cloud resources one request at a time without asking a human to approve every transaction.
The collaboration was unveiled at Sui Basecamp in Singapore.
The concept connects Alibaba Cloud services with Sui Agent Payments, a framework in which the owner of an AI agent sets an on-chain budget and spending limits.
Once those rules are in place, the agent can make individual cloud or inference calls and settle the cost in stablecoins.
That turns the normal cloud billing model on its head.
Instead of a company receiving a monthly invoice for a pool of API and computing usage, each action can become its own programmable payment.
The user still controls the budget.
The agent controls spending inside that boundary.
That distinction is important because autonomous payments are one of the practical bottlenecks facing AI agents.
Software can already decide to call an API, order a task or request computing resources.
But if every action requires a human to enter card details or approve an invoice, the agent is not truly operating autonomously.
Stablecoins are particularly well suited to machine payments because they can move around the clock, settle programmatically and be divided into very small amounts.
Sui’s role is to provide the blockchain execution and payment logic around those transactions.
Alibaba Cloud brings the actual services an agent might need to purchase, including compute and other cloud resources.
The partnership is not a live commercial service yet.
No launch date, price schedule or first customer has been announced.
That makes it important not to confuse the demonstration with a finished product.
But the model is worth watching because it connects two technologies that have often been discussed separately.
AI agents need money.
Stablecoins need useful transactions.
A cloud service that can be purchased automatically creates a clear reason for an agent to hold and spend a digital dollar.
There are also obvious controls that need to work.
An autonomous agent with an unlimited wallet is a security nightmare.
Budget limits, permissions and transaction rules therefore become as important as the payment rail itself.
Sui Agent Payments is being designed around that idea, with owners defining the amount an agent is allowed to spend before it starts acting.
If the model eventually reaches production, the most interesting part may be how little the user thinks about blockchain.
A company gives software a budget.
The software buys the computing resources it needs.
Stablecoins settle the bill underneath.
That is much closer to infrastructure than speculation, and it may be where machine-to-machine crypto payments start to make sense.
Q3 2026 VC deal activity by U.S. metro area. Note: PitchBook’s map uses broader regional boundaries than the metro-area figures in this story (PitchBook-NVCA Graphic, click to enlarge.)
That’s more than triple the $1 billion raised in the region in the same quarter a year earlier, according to the PitchBook-NVCA Venture Monitor. It’s also more than $1 billion above the previous quarterly high of about $2.4 billion, reached in late 2018 and again in late 2022.
Most of the money went to a handful of companies building physical things: rockets, satellites, spacecraft and fusion power plants. Three space companies in the region raised $1.6 billion combined: Stoke, Redmond-based Starcloud and Seattle’s Hubble Network.
Nationally, the trend went the other way. U.S. venture funding fell 40% from the prior quarter, to $98.4 billion, as the giant rounds for frontier AI labs that drove the first half of the year tapered off.
Seattle ranked seventh among U.S. metro areas for venture dollars in the quarter. The Bay Area led with $40.7 billion, followed by Los Angeles, New York, Austin, Boston and Denver. Denver’s $4.2 billion came largely from a single $3.9 billion round for AI data center developer Crusoe.
By number of deals, Seattle ranked eighth, with 94.
The total includes Helion’s $500 million round, which the company announced in June but PitchBook counts in the third quarter. Even without it, the quarter would still be the region’s biggest on record.
Discover how Cisco's Encrypted Visibility Engine (EVE) and Endace PCAP uncovered Flawed AMMYY RAT traffic at Splunk .conf without breaking TLS encryption.
Discover how Cisco Secure Firewall and Cloud Control stream structured Snort 3 and EVE telemetry into Splunk ES to power the .conf26 Agentic SOC pipeline.

 Login