Normal view

There are new articles available, click to refresh the page.
Today — 16 September 2026Space

NASA Watches Earth’s Weight, Finds Center of Mass

By: albarne1
16 September 2026 at 12:08

5 min read

Preparations for Next Moonwalk Simulations Underway (and Underwater)
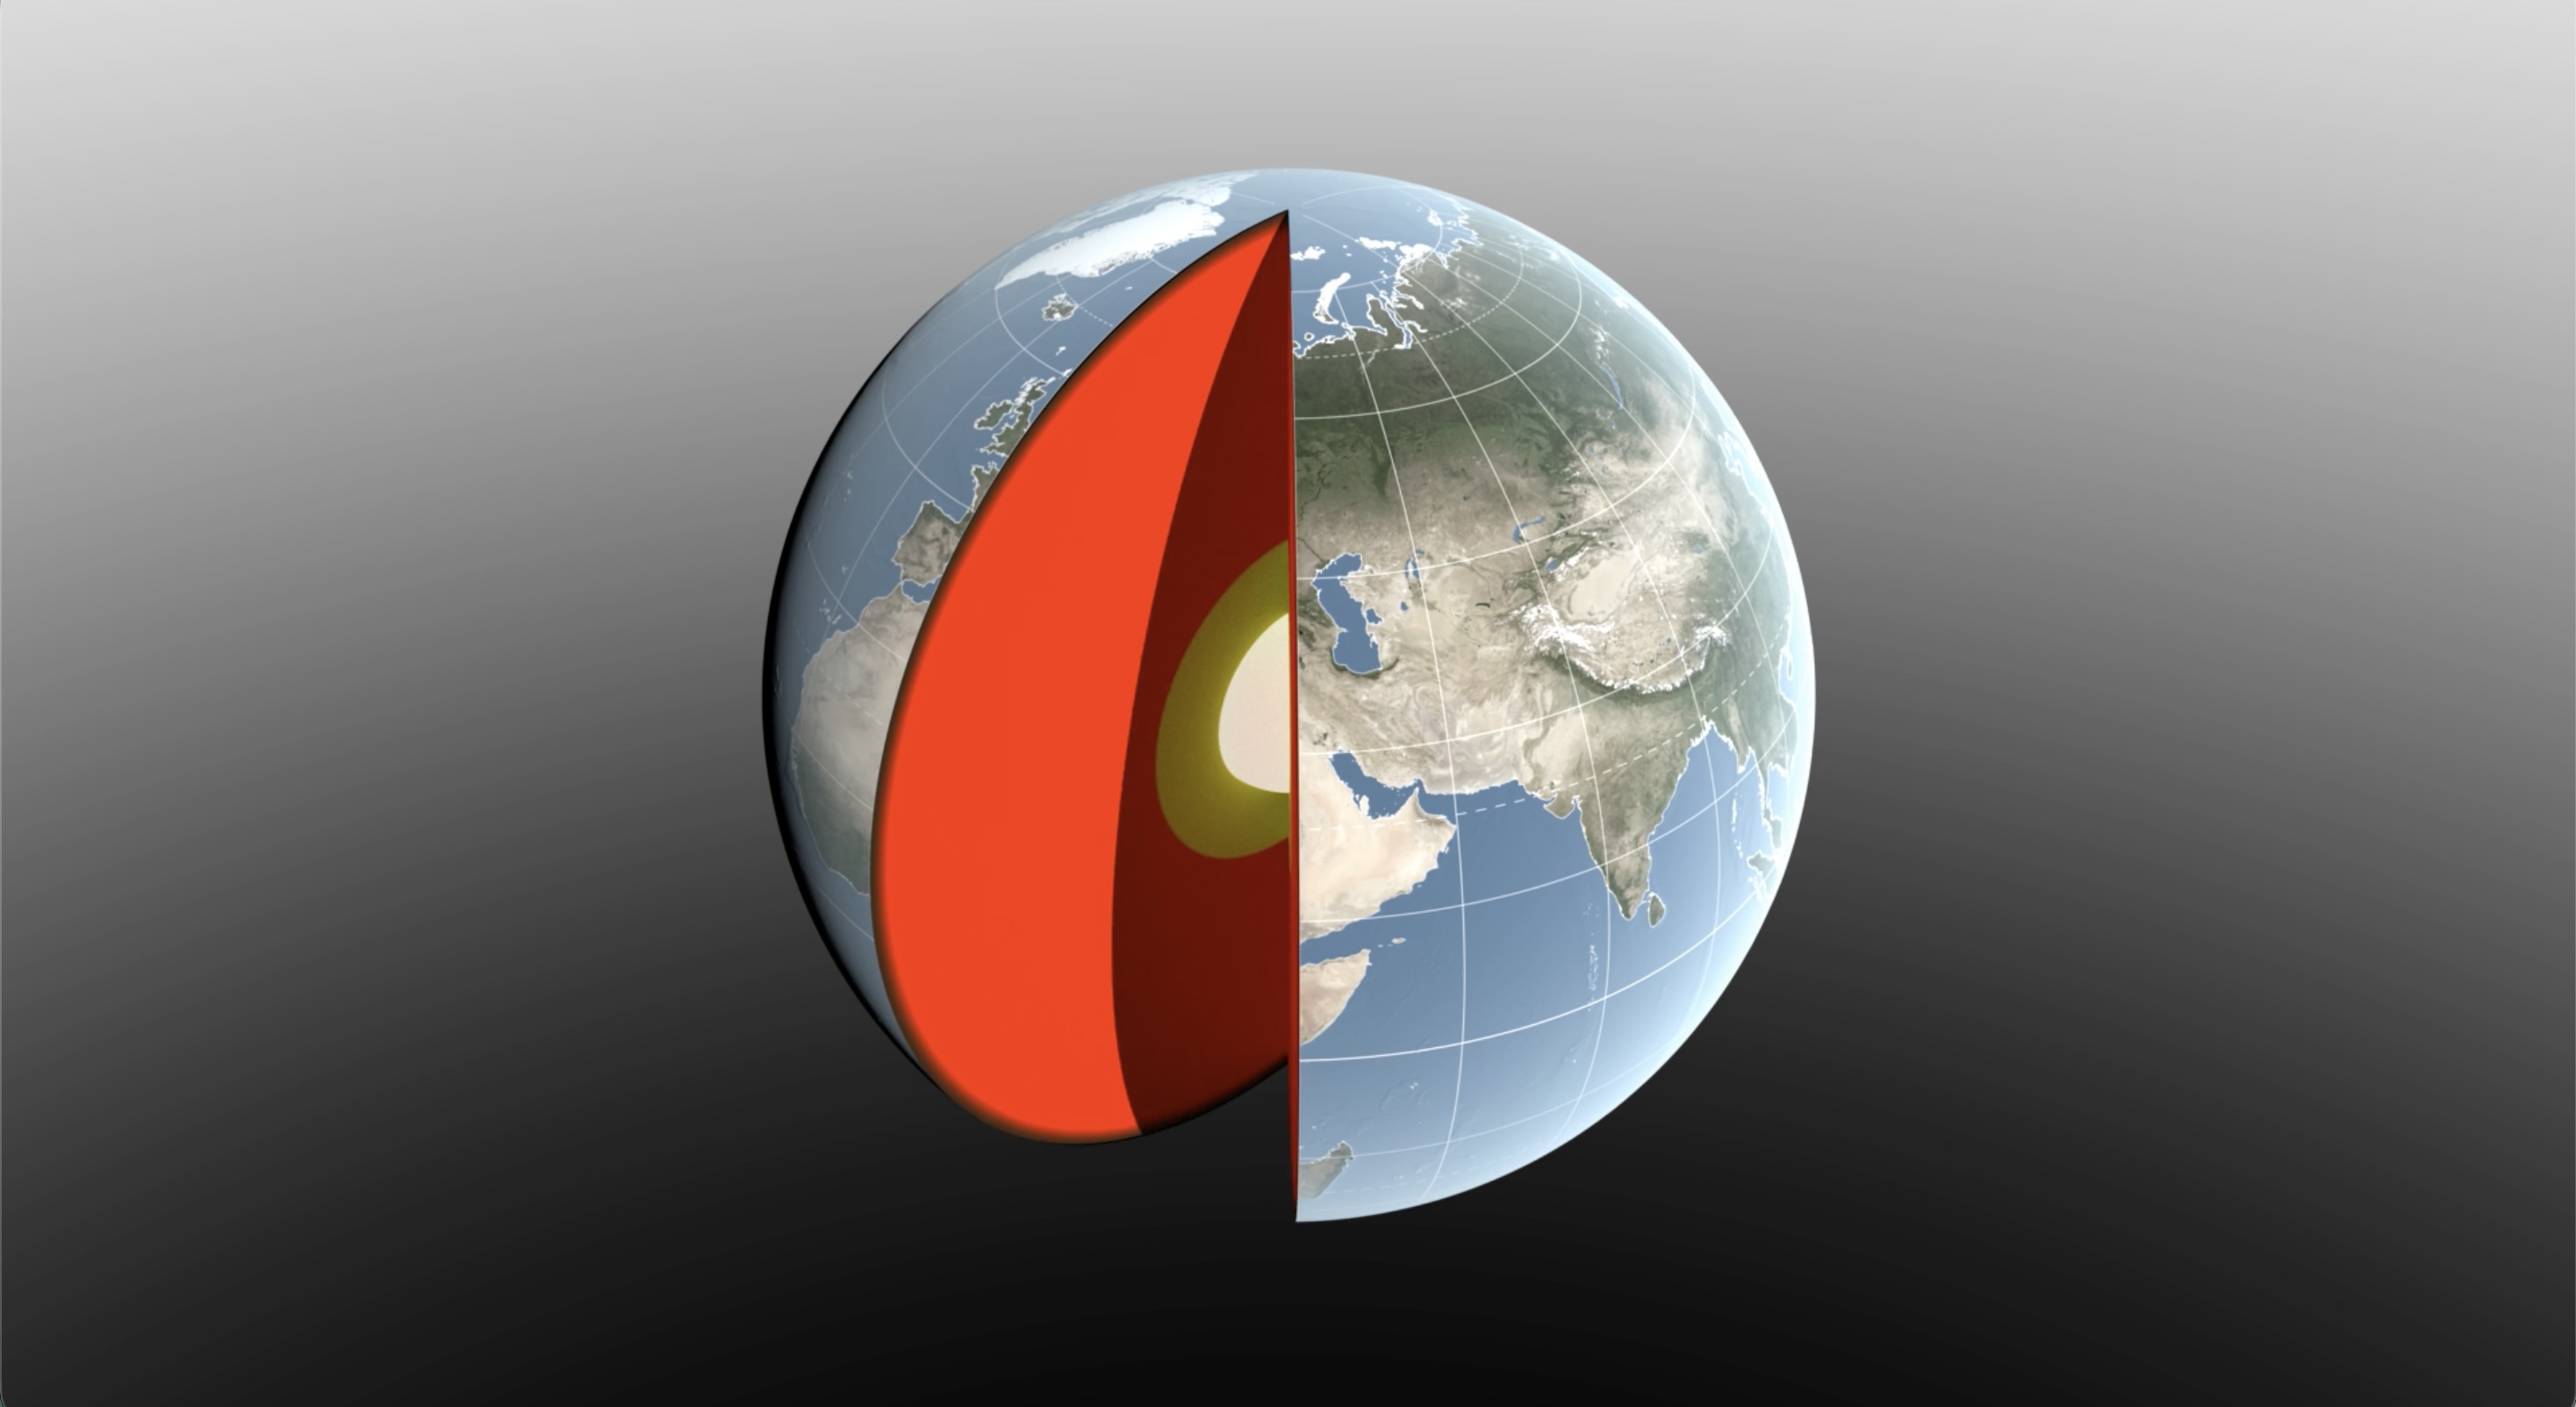
A 3D digital illustration of Earth with a slice cut away to reveal its internal layers. The exterior shows a realistic view of the globe, focusing on Europe, Asia, and Africa with visible geographic features and grid lines.
Water sloshing between the land and oceans shifts Earth’s center of mass relative to its geometric center. NASA scientists have developed a new technique using ultraprecise satellite tracking to estimate the displacement to within fractions of inches.
NASA’s Scientific Visualization Studio

Seasonal changes redistribute enough water around Earth to shift the planet’s center of mass back and forth by fractions of an inch relative to its geometric center. NASA scientists are on the case, tracking the oscillations because Earth’s center of mass is a crucial reference point for satellite navigation and elevation measurements.

A team, led by NASA’s Jet Propulsion Laboratory in Southern California, has proposed a way to calculate the seasonal swings with extreme precision. The technique and findings are detailed in a new study published in Geophysical Journal International. The authors paint a vivid picture of springtime thaws, churning oceans, and dense winter air shifting massive surface loads from season to season.

The study isn’t the first attempt to pin down Earth’s center of mass. Scientists over the decades have pioneered several space-based techniques to define and locate it. But it’s a moving goalpost. If Earth were a hard blue marble, its center of mass would simply overlap its geometric center. In reality, the planet is sloshing and sagging under the weight of water, ice, and air. Because of this, Earth’s center of mass continually swivels around its geometric center by as much as several millimeters.

NASA’s Space Geodesy Project currently uses a variety of space- and land-based techniques to track Earth’s center of mass (also called the geocenter) moving up and down and side to side. This animation traces the millimeter-scale motion from 1993 to 2017.
NASA’s Scientific Visualization Studio

How accurate are existing methods to measure the size of the swivel? The last two international estimates, made in 2017 and 2023, differ by 0.27 inches (7 millimeters), about the height of three stacked nickels. The difference is almost as large as the motion itself.

To reduce uncertainty, JPL geoscientist Donald Argus led the development of a new technique based on ultraprecise satellite tracking.

Driven by gravity, satellites naturally orbit Earth’s center of mass, as if bound by invisible tethers. Tiny changes in the distance between satellites and ground stations reflect Earth’s shifting center of mass.

Using satellites to locate Earth’s center of mass is not a new idea. In fact, dense metal satellites, launched in 1976 and 1992, are dedicated exclusively to this purpose. Resembling 900-pound (408-kilogram) disco balls, both Laser Geodynamics Satellites (LAGEOS 1 and 2) are studded with reflective prisms and tracked with laser precision via ground stations globally distributed across more than 20 countries.

However, one limitation of satellite laser ranging is the uneven distribution of ground stations around Earth. The new technique improves accuracy in two ways: It adds GPS tracking into the mix along with orbital data from several satellites in low Earth orbit to provide a diverse array of targets. And it considers how the weight of water and ice deforms Earth’s crust, taking ground stations along for the ride.

The technique was developed by Argus along with researchers from JPL’s satellite orbit determination team, the University of Nevada, University of Montana, and the Helmholtz Centre for Geosciences in Germany.

“We’re now estimating the size of the movement of Earth’s mass center back and forth each year to be about half of what we believed it to be eight years ago,” said Argus. “Our findings suggest that the mass of Earth’s water and air moving between the hemisphere is smaller than previously thought.”

Felix Landerer, one of the study’s coauthors at JPL, noted that “while these movements might appear tiny, our modern world relies on extremely accurate positioning measurements. By unraveling and understanding the mechanisms that change reference systems, we can build better reference systems that ultimately benefit mapping and navigation — from global shipping logistics to precision agriculture.”

What they found

The study authors tracked Earth’s center of mass oscillating seasonally and attributed the cause to three categories: oceans, atmosphere, and continental water (made up of land ice, snow, lake and river water, soil moisture, and groundwater).

They found that snow accumulation in North America and Eurasia reaches a maximum in March and shifts Earth’s center of mass about 3 millimeters toward the North Pole. A month later, in April, rainwater in the Amazon River basin peaks at 2,400 gigatons, swinging Earth’s center of mass 2.2 millimeters toward South America. Monsoon water in southeast Asia attains a maximum of 600 gigatons six months later in November, adding slightly to the annual oscillation.

Between August and October, the oceans swell with meltwater and rain, and Earth’s center of mass shifts toward the South Pacific Ocean. The Pacific Ocean is so large that mass changes there overshadow the loss or gain in other oceans, though seasonal dynamics in the Mediterranean, Red, North, Baltic, and Barents seas all help shift Earth’s center of mass in their own small way.

The researchers used a model developed by the European Centre for Medium-Range Weather Forecasts to estimate how atmospheric changes affect Earth’s center of mass throughout the seasons. They found that cold, dense, winter air helps tip the scales over Arabia, Asia, and northern Africa around Dec. 21 each year, and over South America and South Africa around June 21.

The mass calculations in the study are consistent with observations made by the Gravity Recovery and Climate Experiment Follow-On (GRACE-FO) mission. Launched in 2018, the mission is made up of twin satellites that map monthly fluctuations in Earth’s gravitational pull due primarily to the mass movement of water above and below ground. The two satellites fly in precise formation, and when the lead satellite passes over a dense body, like a swollen river basin, the extra gravitational tug changes the distance between its twin by a small but measurable amount.

The GRACE-FO mission is a joint partnership between NASA and the German Research Centre for Geosciences (GFZ). The next-generation GRACE-Continuity (GRACE-C) mission is targeting a launch in late 2028 to extend the nearly 25-year GRACE-series data record.

-end-

Written by Sally Younger

2026-061

Before yesterdaySpace

How the Tide Turns at the Mouth of the Elbe

6 August 2026 at 00:01


August 15, 2025
May 11, 2025

The Elbe river in Germany into the North Sea on the left side of the image. Low tide exposes wide, light-colored tidal flats interrupted by branching channels of dark water.
The ocean’s ebbs and flows reveal dynamic tidal flats and a well-traveled shipping route along the German coast.
NASA Earth Observatory/Lauren Dauphin

The Elbe river in Germany into the North Sea on the left side of the image. At high tide, a handful of small islands and crescent-shaped sandbars remain exposed above the water level near shore. Ships are visible as small, bright specks on the water.
The ocean’s ebbs and flows reveal dynamic tidal flats and a well-traveled shipping route along the German coast.
NASA Earth Observatory/Lauren Dauphin

The Elbe river in Germany into the North Sea on the left side of the image. Low tide exposes wide, light-colored tidal flats interrupted by branching channels of dark water.
The ocean’s ebbs and flows reveal dynamic tidal flats and a well-traveled shipping route along the German coast.
NASA Earth Observatory/Lauren Dauphin
The Elbe river in Germany into the North Sea on the left side of the image. At high tide, a handful of small islands and crescent-shaped sandbars remain exposed above the water level near shore. Ships are visible as small, bright specks on the water.
The ocean’s ebbs and flows reveal dynamic tidal flats and a well-traveled shipping route along the German coast.
NASA Earth Observatory/Lauren Dauphin

August 15, 2025

May 11, 2025


One of the major rivers of Europe, the Elbe flows more than 1,000 kilometers (600 miles) across the continent before reaching the North Sea. At its mouth, the low-lying landscape is continually reshaped by the rise and fall of the tides. These dynamic tidal flats are a boon to biodiversity while sometimes posing challenges for those navigating its waters and for communities living along its shores.

The images above illustrate how the area changes with the tides. They were acquired on August 15, 2025, at low tide (left) and on May 11, 2025, at high tide (right) with the OLI (Operational Land Imager) on Landsat 9. The mean tidal range at Cuxhaven is 2.9 meters (9.5 feet), which is considered intermediate, or mesotidal. The tides are also asymmetrical, meaning the flood period is shorter than the ebb. This causes the incoming current to run faster and typically carry more sediment up the 140-kilometer-long (87-mile-long) estuary than it does out.

The low tide exposes complex channels, sandbars, and mudflats around the river mouth. This wide zone of coastal wetlands is part of the Wadden Sea, which stretches from the Netherlands to southern Denmark and represents the largest continuous system of intertidal sand and mud flats in the world. Its habitats serve as important staging, molting, and wintering grounds for migratory birds, with more than 10 million passing through every year.

A channel cuts through these natural features near the river’s mouth, allowing ships to reach Cuxhaven and Hamburg—the third-largest container port in the European Union—farther upriver. Dredging is required to remove accumulated sediment in the channel, and some ships can only pass through when the tide is high enough. The Elbe’s mouth also provides access to the Kiel Canal, which connects the North Sea and Baltic Sea and is the world’s busiest human-made waterway navigable by seagoing ships. 

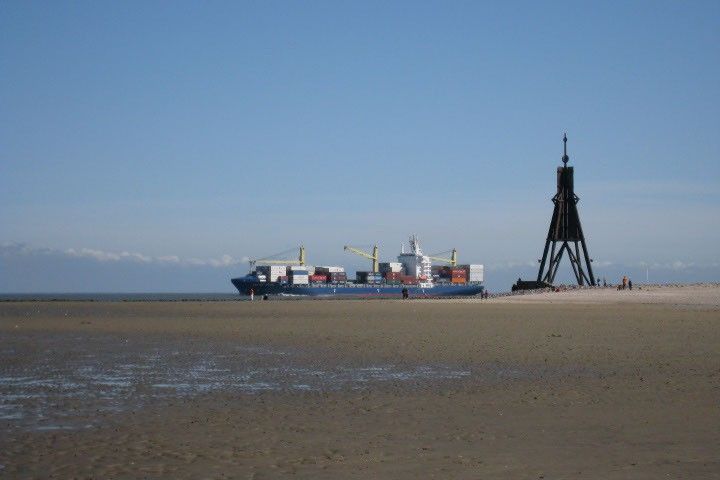
A broad tidal mudflat fills the foreground of this photo.  A sliver of deeper water is visible on the horizon, where a cargo ship loaded with shipping containers and cranes appears to be traveling to the left.
A cargo ship passes by mudflats at the mouth of the Elbe.
Thomas Gölles, April 5, 2009.

At high tide (right), only a handful of small islands and sandbars remain above the waves. One of these islands, Neuwerk, is a tranquil tourist destination that is home to a few dozen inhabitants and the oldest building on the German coast. A brick tower, completed in 1310 and later converted to a lighthouse, was built to protect shipping on the Elbe from pirates and wreckers.

These images show normal tidal variation in the area, but storms can push water levels much higher than a typical high tide. The highest water level measured at Cuxhaven—5.1 meters (16.7 feet) above Europe’s official sea level reference—occurred on January 3, 1976, when a fast-moving storm swept across the North Sea and slammed the coast with high winds. Researchers who reconstructed historical storms noted that the storm surge was worsened by its timing relative to the tide. The strongest winds arrived around low tide, preventing water that had propagated upstream at high tide from flowing back out to sea and causing further inundation inland.

Scientists study past extreme events like this to better understand how future storms might affect low-lying coastal areas and how flood protection could be improved. Flooding risks can be exacerbated by rising sea levels, which at Cuxhaven have trended upward by 2.12 millimeters per year, or 0.70 feet per century.

Two new Earth-observing satellites are making it possible to measure water levels in coastal areas in greater detail. The dual-band radar on the NISAR (NASA-ISRO Synthetic Aperture Radar) satellite is expected to track long-term phenomena such as sea level changes, as well as to map flood inundation and other ephemeral events. In addition, early data from NASA’s SWOT (Surface Water and Ocean Topography) satellite has demonstrated the potential to accurately measure water levels around complex coastlines and to improve tidal models.

NASA Earth Observatory images by Lauren Dauphin, using Landsat data from the U.S. Geological SurveyPhoto by Thomas Gölles. Story by Lindsey Doermann. 

Downloads

The Elbe river in Germany into the North Sea on the left side of the image. Low tide exposes wide, light-colored tidal flats interrupted by branching channels of dark water.

August 15, 2025

JPEG (6.33 MB)

The Elbe river in Germany into the North Sea on the left side of the image. At high tide, a handful of small islands and crescent-shaped sandbars remain exposed above the water level near shore. Ships are visible as small, bright specks on the water.

May 11, 2025

JPEG (6.02 MB)

References & Resources 

You may also be interested in:

Stay up-to-date with the latest content from NASA as we explore the universe and discover more about our home planet.

A Tide-Fueled Trove of Biodiversity in Guinea-Bissau

3 min read

The expansive mudflats, sandy beaches, and mangrove forests of the Bijagós archipelago support an array of migratory shorebirds and large…

Article

Signs of Thaw in the Bering Sea

3 min read

Drifting sea ice fragments near Alaska’s Saint Lawrence and Nunivak islands and colorful water around the Yukon Delta heralded the…

Article

Barents Sea Tied to Low Arctic Sea Ice

4 min read

Patches of open water in the region contributed to low sea ice extent across the Arctic in March 2026, which…

Article
❌
❌