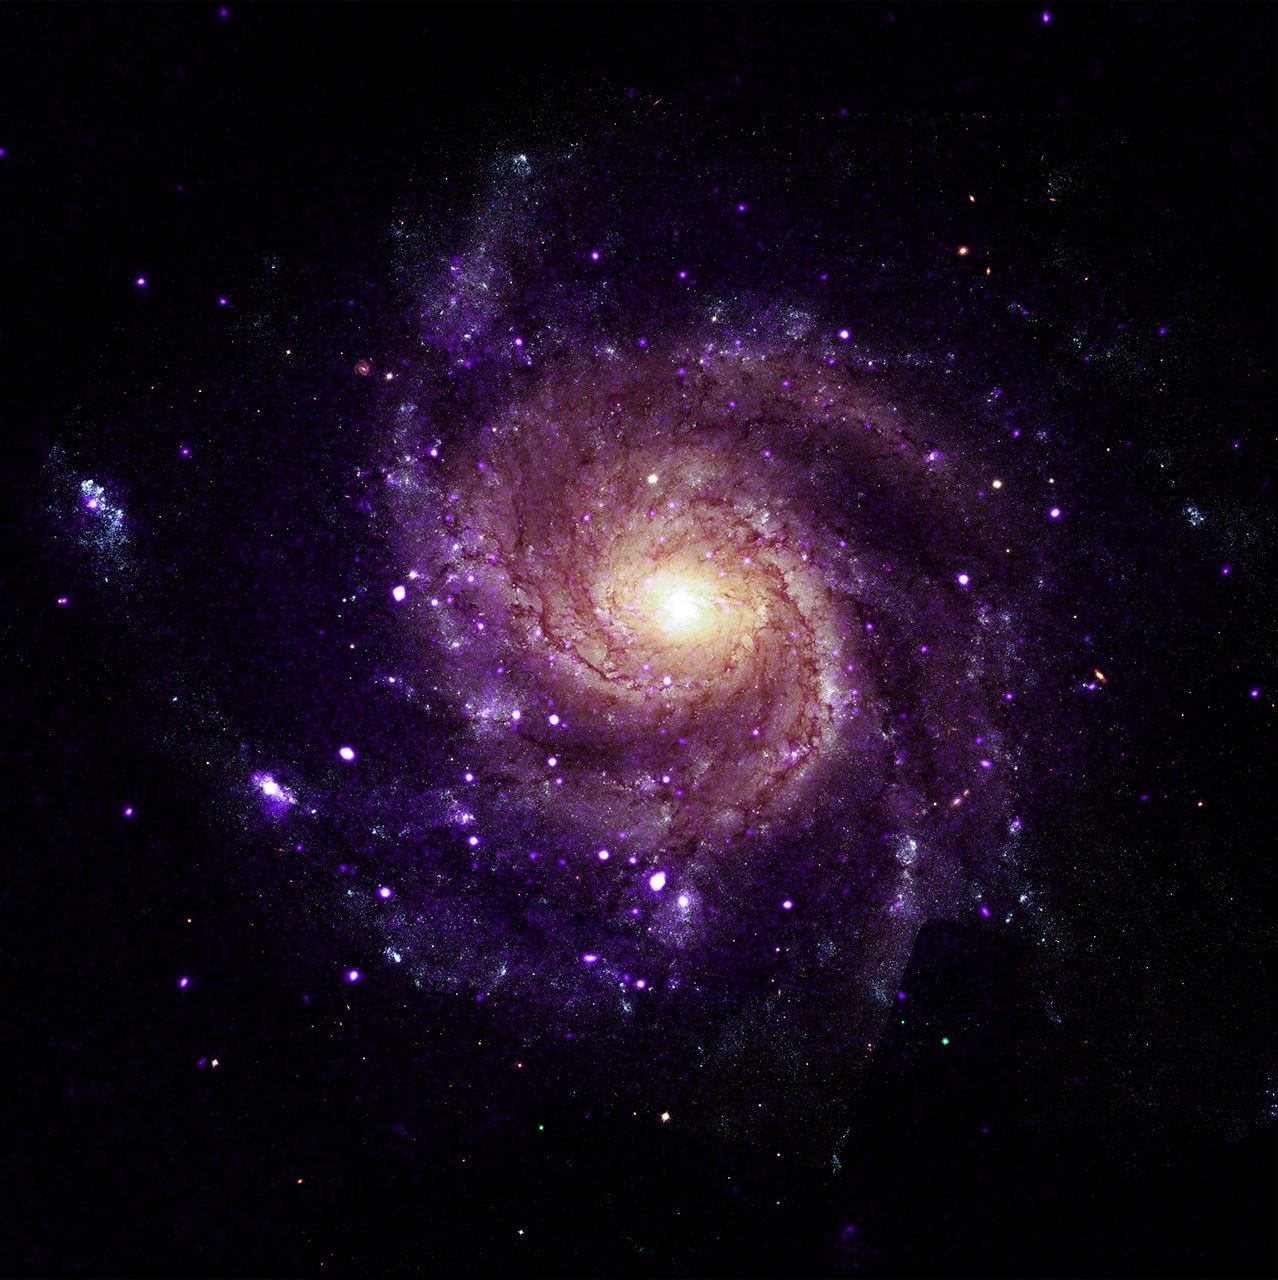
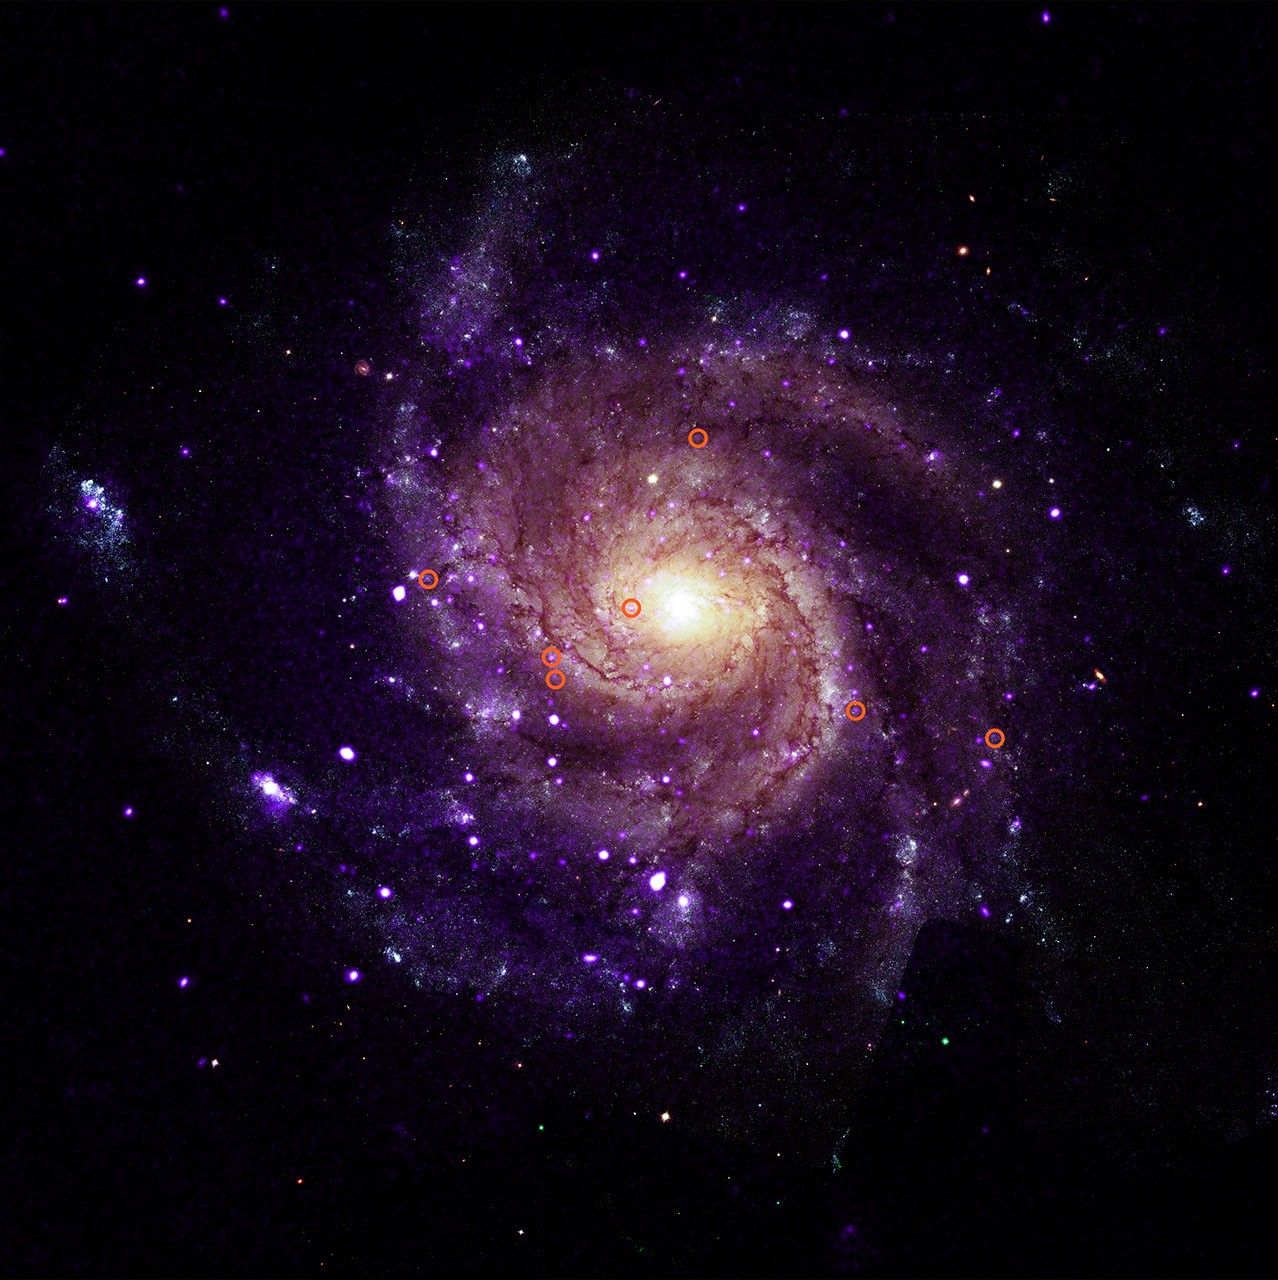
This NASA/ESA Hubble Space Telescope image features the spiral galaxy NGC 4654, located 72 million light-years away in the constellation Virgo (the Maiden).
NASA, ESA/Hubble, D. Thilker, J. Lee, and the PHANGS-HST Team
The subject of this NASA/ESA Hubble Space Telescope image is a spiral galaxy struggling against titanic forces that appear on galactic scales in space. This is NGC 4654, an intermediate spiral galaxy in the constellation Virgo (the Maiden). It is classified as an “intermediate” because its overall shape lies between spiral galaxies that have a bar across their centers and those that don’t. NGC 4654 has a weak bar structure at its center and is located 72 million light-years from Earth in the Virgo Cluster, a particularly massive and populous galaxy cluster.
NGC 4654 is particularly asymmetric, with a rounded and clearly-defined edge on one side and a long tail of gas stretching out from the opposite side — outside the field of view captured in this image. This gaseous tail is the result of ram pressure stripping, a force that galaxies can experience as they plow through space. NGC 4654 moves with such high velocity that it sweeps up and rams through the hot, rarefied gas filling the space between the Virgo Cluster’s galaxies. This intracluster medium in turn exerts a “ram pressure” on the galaxy, compressing the galaxy’s leading edge and dragging its gas behind the galaxy, creating the elongated tail.
It’s not just the galaxy’s gas that is unevenly distributed: its stars are too, and this is more unusual for a spiral galaxy. While the spiral arm on its leading edge is rich with stars and gas, the opposite arm noticeably lacks stars, influencing the galaxy’s lopsided spiral shape. Astronomers think that ram pressure alone is unlikely to cause this effect. Rather, NGC 4654 was also subjected to the gravitational force of fellow Virgo Cluster galaxy NGC 4639. While the two galaxies are far apart now, it’s thought that a fly-by interaction between them around 500 million years ago ripped away NGC 4654’s gas along one side, limiting star formation there and creating the asymmetry in its shape.
Many galaxies that undergo ram pressure stripping suffer reduced star formation rates as the cold gas that collapses to form their stars is pulled away and lost. NGC 4654, however, is still forming nearly two Suns’ worth of stars every year, a rate comparable to other galaxies of similar size. The active star formation is visible in the latest Hubble data included in this image. The data picks up on a wavelength of red light emitted by the clouds of energized gas where newborn stars lurk. The bright pink bubbles that appear across NGC 4654 — from its forward spiral arm, to around its weak bar, and out to the edge of its disk — are areas where these newborn stars shine.
The data used in this image came from two observing programs (#15654, #17502) that aim to link the gas in galaxies with star formation. By observing many prominent galaxies in the vicinity of our own, researchers hope to better understand how gas moves in galaxies, where and when it collapses to form stars and star clusters, and what effect those new stars have on the gas around them.
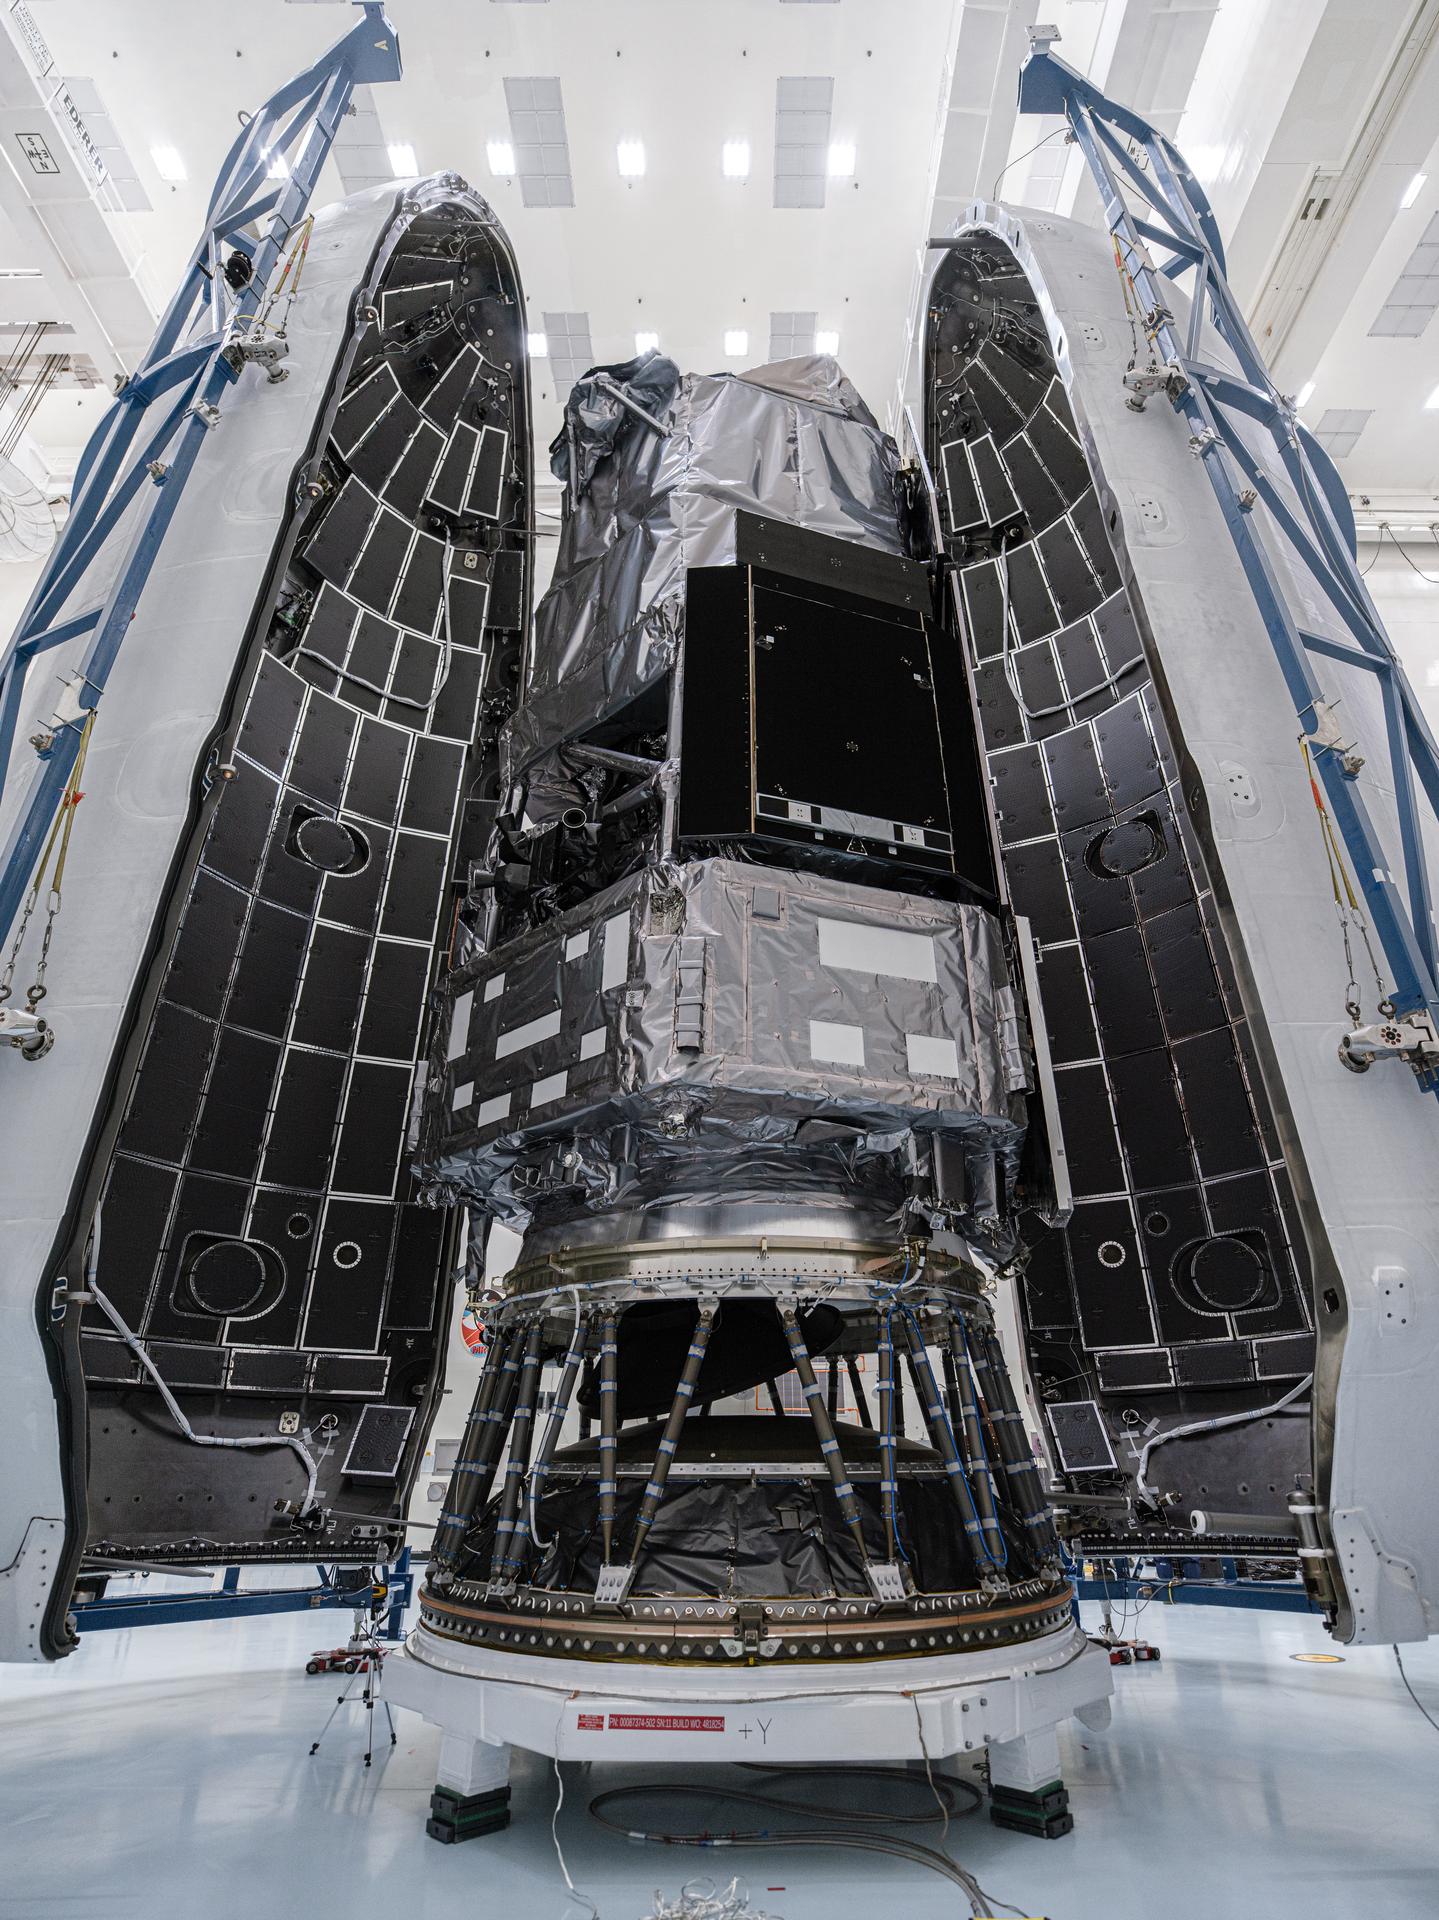
How do black holes at the center of galaxies form and grow over time? To answer this question, scientists need to detect and study supermassive black holes at great distances, which existed much earlier in the universe’s history. New research suggests NASA’s Nancy Grace Roman Space Telescope, which is on track to launch Aug. 30, 2026, will be able to detect these distant, ancient black holes that existed up to 11 billion years ago.
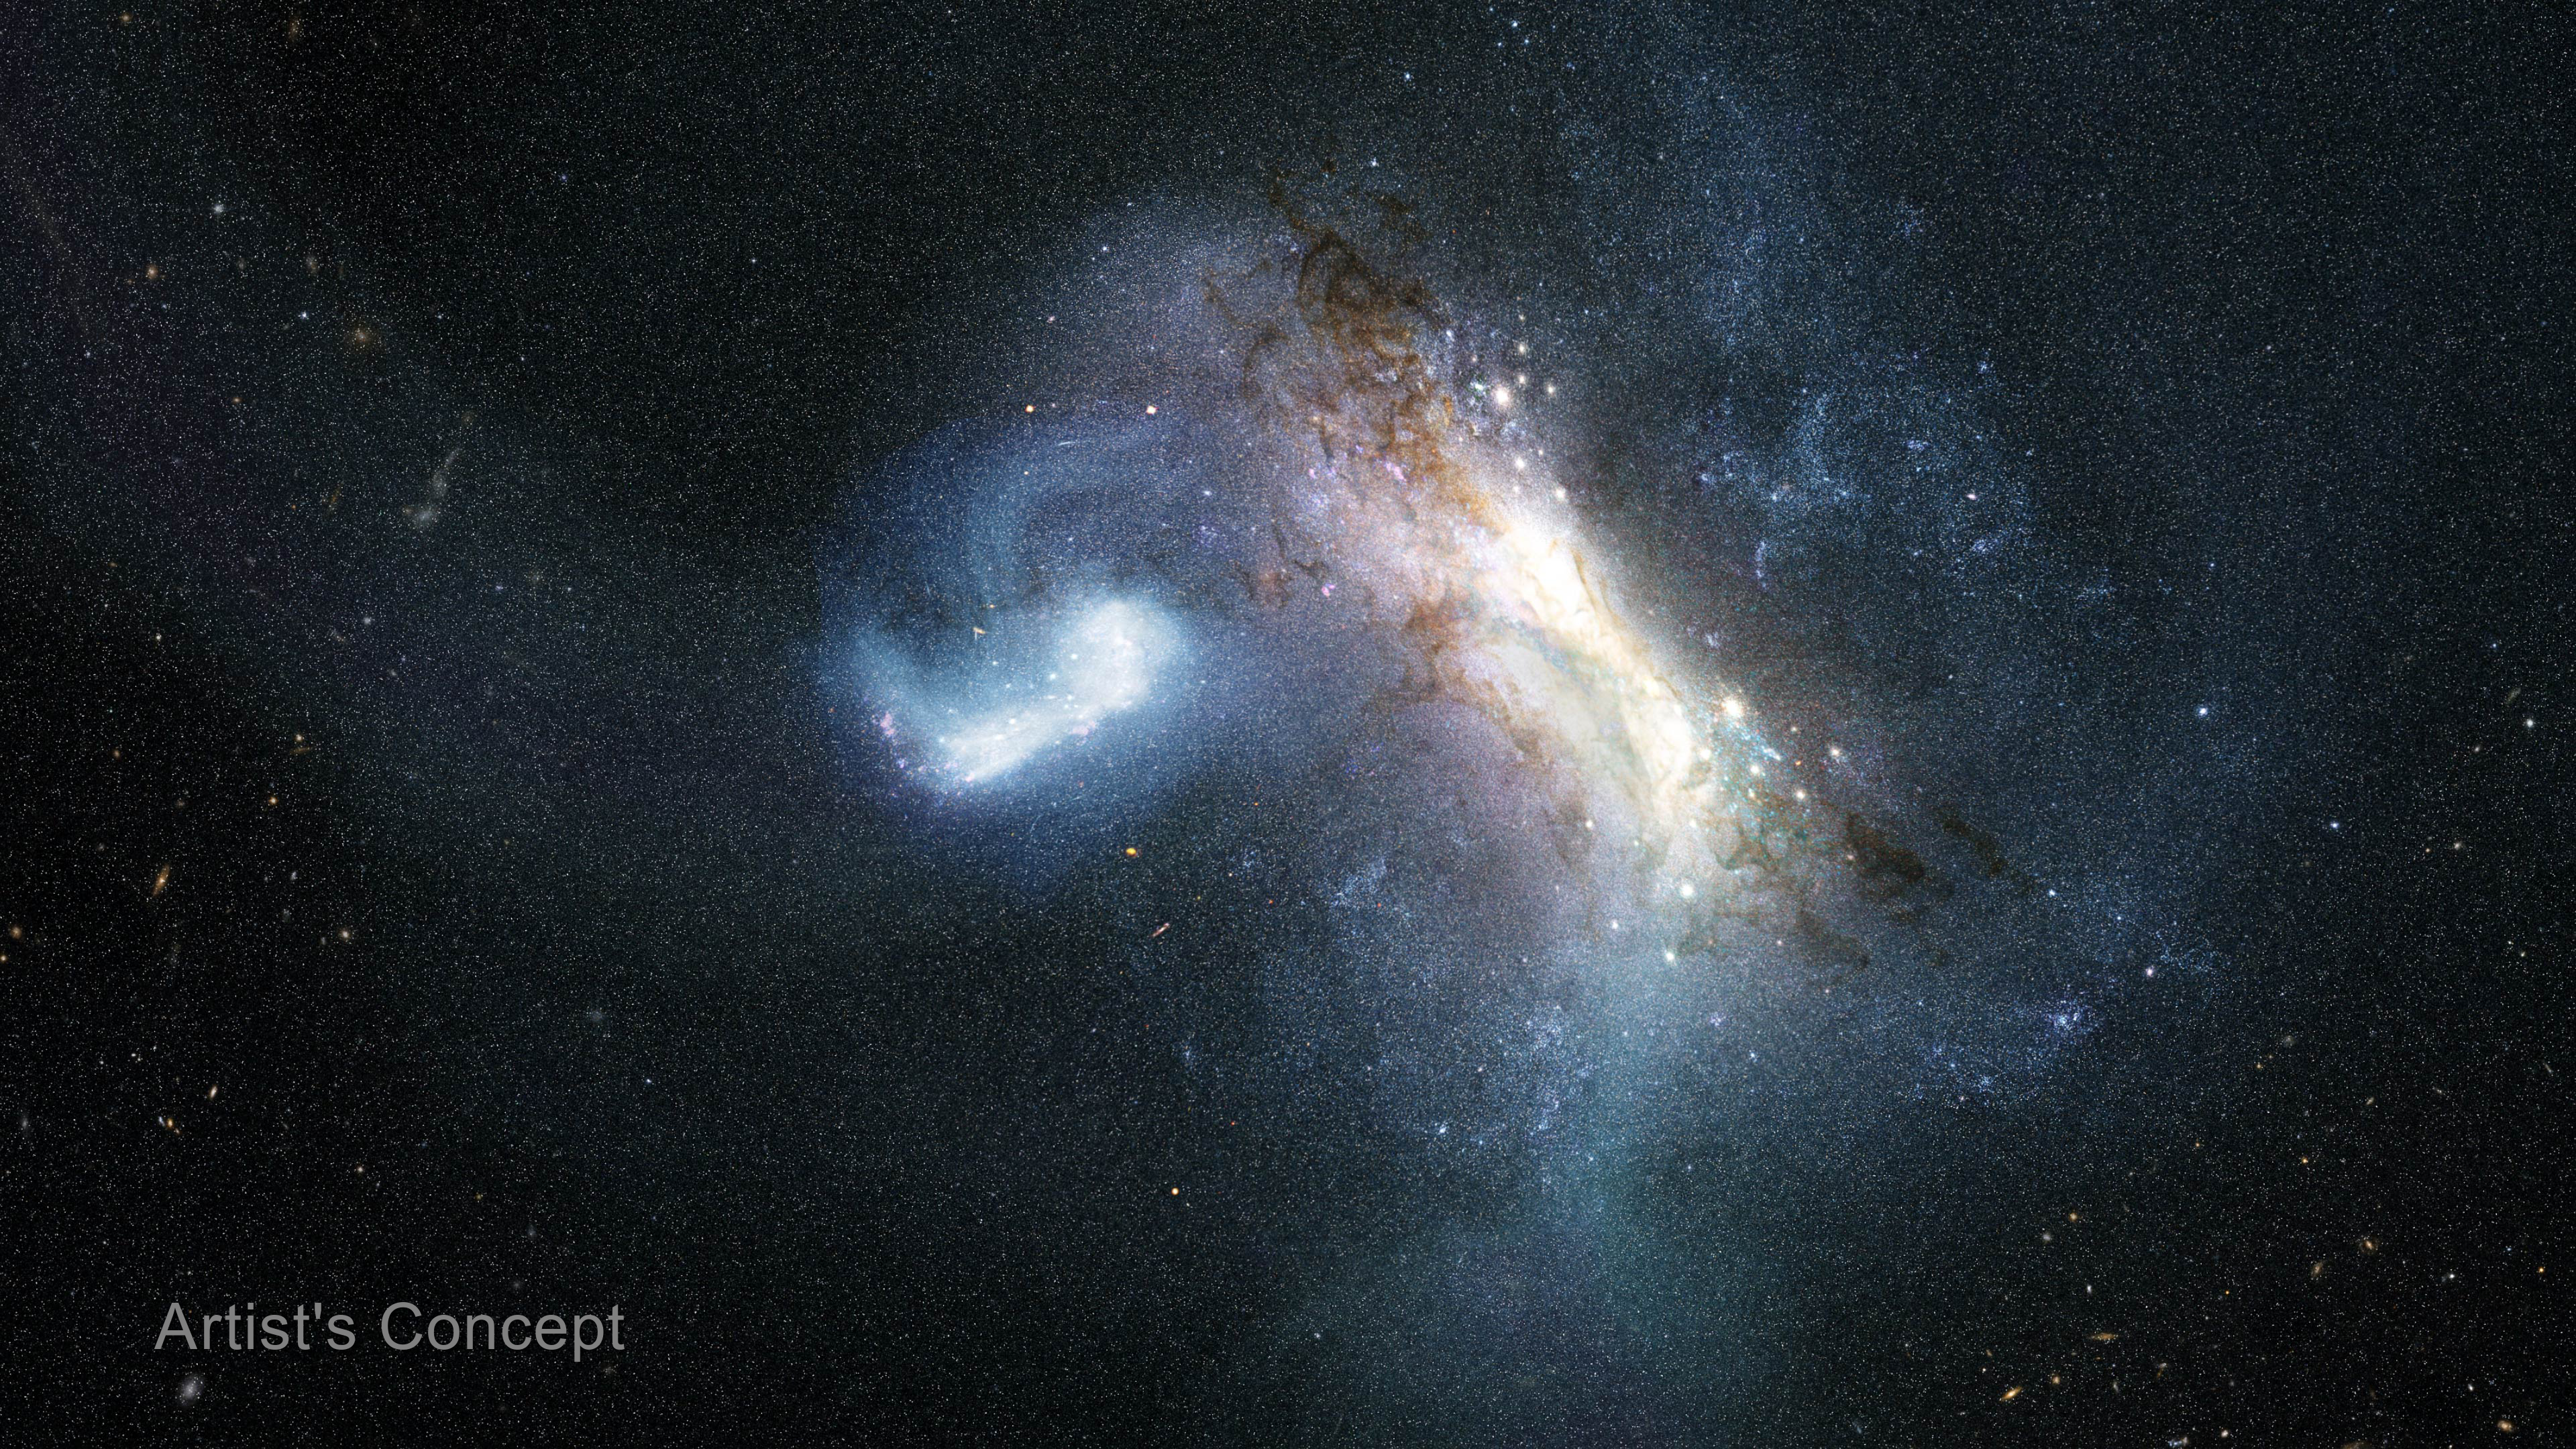
This artist’s concept portrays a Sun-like star being shredded by a supermassive black hole — a phenomenon known as a tidal disruption event. During these events, the region around a black hole can brighten and become visible across great distances. NASA’s Nancy Grace Roman Space Telescope will be able to spot and study tidal disruption events that occurred early in the universe’s history. By characterizing an earlier population of supermassive black holes, astronomers can learn about their origins.
NASA, Ralf Crawford (STScI)
Black holes are best studied by looking for the light emitted from their accretion disk — the matter that swirls around them before being consumed. Lighter supermassive black holes are challenging to observe because they tend to be less luminous due to less accretion. But occasionally, they shred and consume an entire star, brightening to outshine their entire host galaxy — known as a tidal disruption event (TDE). By characterizing that population of early supermassive black holes and how they evolve and grow for billions of years, Roman will provide clues to the ultimate origin of these behemoths.
“The Roman Space Telescope is going to be transformative for transient science,” said lead author Mitchell Karmen of the Johns Hopkins University, a graduate student and National Science Foundation Graduate Research Fellow. “Thanks to Roman’s high sensitivity, we can find multiple tidal disruption events out to greater distances and earlier cosmic times than ever before.”
Roman’s High-Latitude Time-Doman Survey, one of three core community surveys, is particularly well suited to find and study TDEs in the early universe. This survey will cover about 18 square degrees on the sky, an area equivalent to 90 full moons, at a regular cadence. By revisiting the same regions repeatedly, astronomers can find large numbers of transient events like TDEs.
Tidal disruption events are phenomena unique to lighter supermassive black holes. Heftier black holes weighing more than 1 billion Suns will swallow incoming stars whole. But lighter black holes of about 100,000 to 100 million Suns can shred a star before consuming it, creating a beacon that brightens over a couple of weeks before gradually fading away.
The rate of TDEs fluctuates over cosmic time. Previous work predicted that the rate of TDEs would decrease with increasing distance because most young black holes were too light to generate a TDE. However, this new research takes into account numerous factors that evolve over time, like the frequency of galaxy (and hence black hole) mergers as well as the number of stars within the core of each galaxy and how closely packed they are.
Karmen and his colleagues modeled these and other effects to predict how many tidal disruption events Roman could observe, as well as other observatories like the ground-based National Science Foundation-Department of Energy Vera C. Rubin Observatory and NASA’s James Webb Space Telescope. The team forecasts that astronomers will see the rate of TDEs increase as Roman probes greater distances and earlier times until “cosmic noon,” about 11 to 12 billion years ago when star formation peaked throughout the universe, before decreasing again.
This visualization shows the average number of tidal disruption events NASA’s Nancy Grace Roman Space Telescope is predicted to detect in a year, based on simulations. Roman is expected to record about 100 such events in a year.
Video: NASA, STScI. Visualization: Christian Nieves (STScI). Sound: Christian Nieves (STScI). Designer: Dani Player (STScI). Animation: Greg Bacon (STScI)
Complementary Observations
Roman will observe near-infrared wavelengths of light. Light from distant TDEs becomes stretched to longer wavelengths by the expansion of the universe, a phenomenon known as cosmological redshift. As a result, Roman is inherently optimized to detect TDEs whose light traveled anywhere from 8 billion to 11 billion years to reach us.
The Rubin Observatory also will scan large swaths of the sky and pick up many new TDEs. However, it will observe visible light, which limits it to closer TDEs than Roman.
The research by Karmen’s team finds that Rubin will detect thousands to tens of thousands of TDEs per year. While Roman is expected to find up to 100 TDEs per year, those black holes will be much more distant, within the realm of cosmic history that is most important for distinguishing among black hole origin scenarios.
“Just by counting the number of TDEs as a function of redshift, you can put meaningful constraints on the population of million-solar-mass black holes,” said co-author Suvi Gezari, an associate professor of astronomy at the University of Maryland. “Roman will be transformative in that it can probe tidal disruption events out to greater distances, so you can look at how the rate of TDEs evolves over time.”
Origins of supermassive black holes
Astronomers have observed truly gargantuan black holes very early in the history of the universe — so early that theories struggle to explain how they could have become so large, so quickly. They must have started smaller and grown over time, but how much smaller?
One theory, known as “light seeds,” begins with black holes that are created from the deaths of massive stars. Such black holes might weigh up to a few hundred times our Sun. These black holes then would merge over time, as well as consume surrounding gas at an astonishing rate. In this scenario, every young galaxy would be expected to have a massive black hole at its center.
A second theory, known as “heavy seeds,” suggests that a black hole could be born with a much higher mass, up to a million times our Sun, through a process such as the direct collapse of a gas cloud. This process should be less common, though, which would result in supermassive black holes being much rarer in early galaxies.
“Tidal disruption events help us probe the population of light supermassive black holes, which can help us discriminate between these models,” Karmen said.
Ultimately, Roman’s tally of tidal disruption events will help researchers trace global effects that impact the black hole population over time.
Once Roman and Rubin begin regular science operations, the team looks forward to comparing their forecasts to the actual detections those observatories make.
“Just like Webb has transformed our understanding of distant, high-redshift galaxies, Roman is poised to transform our understanding of high-redshift transients,” Gezari said.
The Nancy Grace Roman Space Telescope is managed at NASA’s Goddard Space Flight Center in Greenbelt, Maryland, with participation by NASA’s Jet Propulsion Laboratory in Southern California; Caltech/IPAC in Pasadena, California; the Space Telescope Science Institute in Baltimore; and a science team comprising scientists from various research institutions. The primary industrial partners are BAE Systems, Inc. in Boulder, Colorado; L3Harris Technologies in Melbourne, Florida; and Teledyne Scientific & Imaging in Thousand Oaks, California.
By Christine Pulliam Space Telescope Science Institute, Baltimore, Md.
NASA Webb Uncovers Unusual Galaxy Shaped by Cosmic Collision
6 Min Read
NASA Webb Uncovers Unusual Galaxy Shaped by Cosmic Collision
The mid-infrared view of Centaurus A from NASA’s James Webb Space Telescope reveals dusty structures and hidden activity within the nearby, active galaxy.
Credits: Image: NASA, ESA, CSA, STScI; Image Processing: Alyssa Pagan (STScI), Joseph DePasquale (STScI), Macarena Garcia Marin (ESA Office at STScI)
In new images from NASA’s James Webb Space Telescope to celebrate its fourth science anniversary, a familiar galaxy transforms into something far richer, and far more complex, than ever seen before. Webb’s unprecedented sensitivity across near- and mid-infrared wavelengths cuts through the thick lanes of dust that obscure Centaurus A’s center in visible light, showing a densely packed tapestry of individual stars and an active, everchanging galaxy. These images mark four years of better-than-anticipated performance and successful science operations for the most powerful space telescope in history.
Centaurus A is 11 million light-years away from Earth, relatively close in cosmic terms. Yet, unlike most nearby galaxies, it is very active, making it a powerful laboratory for understanding how galaxies and black holes grow and evolve together.
Image: Centaurus A (MIRI Image)
The mid-infrared view of Centaurus A from NASA’s James Webb Space Telescope reveals dusty structures and hidden activity within the nearby, active galaxy.
Image: NASA, ESA, CSA, STScI; Image Processing: Alyssa Pagan (STScI), Joseph DePasquale (STScI), Macarena Garcia Marin (ESA Office at STScI)
At its core sits a supermassive black hole actively feeding on surrounding material. As it does, the black hole launches powerful jets and releases enormous amounts of energy, shaping the galaxy around it. At the same time, Centaurus A bears the scars of a dramatic past: a major collision with another galaxy roughly two billion years ago. The aftermath of that merger is still visible today in its unusual structure and ongoing star formation.
Visible light observations from NASA’s Hubble Space Telescope could not reveal the central region where dust blocked the view, while NASA’s retired Spitzer Space Telescope revealed large scale structures in the infrared without resolving individual stars. Now, Webb brings both clarity and depth, exposing the galaxy’s inner workings star by star.
Interactive: Journey into Centaurus A
Use this interactive tool to journey into NASA’s James Webb Space Telescope’s mid-infrared view of Centaurus A, where dust gives way to a rich landscape of stars and hidden features.
NASA / STScI
“No single telescope tells the whole story,” said Shawn Domagal-Goldman, division director, Astrophysics, NASA Headquarters in Washington. “Discoveries build over time and new observatories expand on the foundations laid by earlier missions. Webb represents the most powerful step forward yet, opening a window into wavelengths and details never before accessible. This allows astronomers to examine structures and processes that other telescopes could not see.”
Dust, awe
Webb’s mid-infrared vision highlights the galaxy’s rich dust structures, which glow in intricate shapes that surprise and even perplex astronomers. A warped, parallelogram-like band cuts across the galaxy’s center, while wisps of material stretch outward like cosmic clouds.
An “S” shaped feature, most notable in the image from Webb’s MIRI (Mid-Infrared Instrument), is also unusual and invites questions that need further study to answer. What created this shape? How does the black hole influence it? Is it influenced by merger-induced star formation?
Many of the glowing red points in the MIRI image are dust-rich stars or stellar nurseries, where aging stars are shedding material back into space or new stars are forming. This dust is the raw ingredient for future generations of stars and planets, making it central to the ongoing life cycle of the galaxy.
Image: Centaurus A Crop (NIRCam & MIRI)
In the combined mid- and near-infrared view of Centaurus A, the NIRCam (Near-Infrared Camera) on NASA’s James Webb Space Telescope brings out the galaxy’s dense field of millions of stars.
Image: NASA, ESA, CSA, STScI; Image Processing: Alyssa Pagan (STScI), Joseph DePasquale (STScI), Macarena Garcia Marin (ESA Office at STScI)
Written in its stars
With Webb’s high resolution, astronomers can now study Centaurus A star by star, even in its long-obscured central region. What looks “grainy” in the image from Webb, most obvious in the combined MIRI and NIRCam (Near-Infrared Camera) view, is actually a densely packed field of individual stars, together carrying information about the galaxy’s past.
With Webb’s view of Centaurus A, it becomes a case of galactic archaeology. Each star revealed helps to reconstruct when different events happened: when older stars first formed, when activity slowed down, a burst of star formation during the collision, and stars born from gas stirred in its aftermath. Together, they form a timeline of the galaxy’s evolution.
Dynamic black hole
Webb’s capabilities go beyond imaging. By analyzing light with spectroscopy, astronomers can measure how gas moves within the galaxy.
Early findings from Webb show fast-moving ionized gas flowing outward, likely driven by the black hole’s activity, and warmer molecular hydrogen in a warped rotating disk near the center. These observations help explore one of astronomy’s biggest questions: How does a black hole influence an entire galaxy?
The answer appears to be complex. The black hole can trigger star formation by compressing gas, but also limit it by pushing material away. Centaurus A offers a rare, nearby view of this cosmic interplay.
By tracing dust in never-before-seen detail, resolving millions of stars, and revealing the motion of gas near a supermassive black hole, Webb transforms Centaurus A into a vivid record of cosmic history.
The James Webb Space Telescope is the world’s premier space science observatory. Webb is solving mysteries in our solar system, looking beyond to distant worlds around other stars, and probing the mysterious structures and origins of our universe and our place in it. Webb is an international program led by NASA with its partners, ESA (European Space Agency) and CSA (Canadian Space Agency).
The following sections contain links to download this article’s images and videos in all available resolutions followed by related information links, media contacts, and if available, research paper and Spanish translation links.
Related Images & Videos
Centaurus A (MIRI Image)
The mid-infrared view of Centaurus A from NASA’s James Webb Space Telescope reveals dusty structures and hidden activity within the nearby, active galaxy.
Centaurus A Crop (NIRCam and MIRI Image)
In the combined mid- and near-infrared view of Centaurus A, the NIRCam (Near-Infrared Camera) on NASA’s James Webb Space Telescope brings out the galaxy’s dense field of millions of stars.
Centaurus A Context Image (ESO and Webb Images)
A ground-based image of nearby galaxy Centaurus A from the European Southern Observatory (top left) puts the near-infrared and mid-infrared views from NASA’s James Webb Space Telescope image into context.
Centaurus A (MIRI Compass Image)
Annotated image of the active galaxy Centaurus A captured by the James Webb Space Telescope’s MIRI (Mid-Infrared Instrument), with compass arrows, a scale bar, and color key for reference. The north and east compass arrows show the orientation of the image on the sky. Note …
Centaurus A Crop (NIRCam and MIRI Compass Image)
Annotated image of the active galaxy Centaurus A captured by the James Webb Space Telescope’s NIRCam (Near-Infrared Camera) and MIRI (Mid-Infrared Instrument), with compass arrows, a scale bar, and color key for reference. The north and east compass arrows show the orientat…
This sequence begins with an artist’s concept showing the Milky Way galaxy as seen from above, with the estimated positions of spiral arms based on previous data. Next is an updated artist’s concept of the Milky Way, where the positions of the two spiral arms most distant from the center of the galaxy have been adjusted based on newly processed X-ray data from NASA’s Chandra X-ray Observatory and ESA’s XMM-Newton. Both arms may be more distant than previously thought.
NASA/CXC/A. Hobart
A new result using NASA’s Chandra X-ray Observatory shows that the outer spiral arms in the Milky Way galaxy may reach wider than previously thought. This finding may lead astronomers to adjust their understanding of our home galaxy’s structure.
A team of astronomers made this discovery by making precise measurements of distances to dust clouds in the Milky Way’s spiral arms using data from both NASA’s Chandra and XMM-Newton, an ESA (European Space Agency) mission with NASA contributions. The results are described in a new paper published Wednesday in the Astronomy & Astrophysics journal.
The researchers determined the distances by studying rings around gamma-ray bursts, some of the brightest bursts of light in the universe, which arise from the collapse of massive stars or the merger of neutron stars. They are located at enormous distances, well beyond the confines of our galaxy.
An artist’s concept showing the Milky Way galaxy as seen from above, with the estimated positions of spiral arms based on previous data, in blue. Overlaid on this is an updated view of the Milky Way showing different positions for the two outermost spiral arms, shown in red and bordered by dashed lines. Both arms may be more distant than previously thought, based on newly processed X-ray data from Chandra and XMM.
NASA/CXC/SAO/M.Weiss
This distance measurement technique capitalized on the phenomenon of light echoes, where the light from the gamma-ray burst bounced off dust clouds in the spiral arms. The diameters of the rings in X-rays give the distances to Earth, with larger rings being generated by dust clouds closer to us.
“This is a very direct way – relying only on geometry – to precisely measure distances to the Milky Way’s spiral arms,” said Beatrice Vaia, who led the study while a PhD student in a joint program between Scuola Universitaria Superiore IUSS Pavia and University of Trento in Italy. “Most other methods rely on assumptions about how the Milky Way rotates, which become increasingly uncertain in the outer regions of our galaxy.”
Despite a century of awareness of the Milky Way’s spiral arms, astronomers are still working toward precise characterization of its arms because of Earth’s position within one. Dust and gas also block the view to other arms.
The researchers used three different gamma-ray bursts to determine the distances to three spiral arms in the Milky Way. In order of increasing distances from the Galactic Center, they are the Perseus, the Outer, and the Outer Scutum-Centaurus arms. Along the direction of one of the bursts, they found that both the Outer and Outer Scutum-Centaurus arms are about 10% more distant than astronomers previously thought.
“The differences are small, but any revision of these distances is important because they are so fundamental for understanding our galaxy,” said co-author Ilaria Fornasiero, who was a PhD student in the same program as the leading author. “For example, this could mean that astronomers have to revise estimates of the mass of the galaxy, because that affects how wide the arms stretch.”
The images include X-ray data from Chandra and optical data from Pan-STARRS. The composite image shows X-ray rings generated by a gamma-ray burst (GRB), a bright X-ray source located outside our galaxy. In a phenomenon called light echoes, the X-rays from the GRB bounced off dust clouds in the spiral arms of our galaxy. The diameters of the rings in the Chandra data give the distances of the dust clouds to Earth, with larger rings being generated by dust clouds closer to us. The GRB is located at the center of the circles defining the rings, to the left of the X-ray data outlined by the white square.
The team also used their data to estimate that the dust cloud in the most distant arm is about 3,500 light-years wide. These findings show that their measurements apply to the full thickness of the spiral arm, rather than a random, isolated dust cloud that may not fully be representative of the arm’s location.
While this technique provided major improvements in accuracy according to the researchers, it may be difficult to use it for further measurements because bright gamma-ray bursts that are visible through the plane of the galaxy are rare.
“We’re relying on the universe to provide us with these events, and so far, over 25 years, we’ve only found a handful that we can use,” said co-author Andrea Tiengo of Scuola Universitaria Superiore IUSS Pavia. “That said, we will continue to be on the lookout for more.”
NASA’s Marshall Space Flight Center in Huntsville, Alabama, manages the Chandra program. The Smithsonian Astrophysical Observatory’s Chandra X-ray Center controls science operations from Cambridge, Massachusetts, and flight operations from Burlington, Massachusetts.
This release features a short video and a series of images, all related to an updated understanding of our home galaxy’s structure. By studying rings of X-ray light echoes, researchers now believe that two of the Milky Way’s spiral arms may be more distant from the center of the galaxy than previously thought.
The updated understanding of the structure of the Milky Way is highlighted in a short video, which compares two artist concept images. In both images, our spiral Milky Way galaxy is shown face-on. It has a bright white core with several arms that spiral out from the center, like long thin clouds corkscrewing counterclockwise. The two longest arms make a full rotation of the spiral galaxy, and curve all the way around to the upper right of the images.
The first image in the video shows the previous understanding of the Milky Way. Here, the two longest arms are curled around the core in a fairly tight spiral. In the second image, which represents the updated understanding, the two longest arms are more loosely spiraled. Visually, this means there is more open space between the curving arms, which are further away from the bright galaxy core. The video fades back and forth between the two artist concept images to illustrate the structural differences between the two understandings.
These findings are further shown by a static image which overlays the new understanding on top of the earlier understanding. In this artist’s concept illustration, dotted lines and different colors are used to differentiate between the two.
A team of astronomers made this discovery by studying gamma-ray bursts that bounce off of dust clouds in the galaxy’s spiral arms. The resulting rings of X-rays, known as light echoes, were detected and mapped by NASA’s Chandra X-ray Observatory and ESA’s XMM-Newton. In a supplemental data image, the light echoes resemble concentric arches of neon blue dots trailing across a speckled sky.
Identifying the position of the Milky Way’s spiral arms through X-ray light echoes has allowed astronomers to use geometry, rather than assumptions about galaxy rotation, to better understand the structure of our galaxy.
NASA’s Chandra Reveals ‘Red, White, Blue’ Universe for US 250th
In celebration of the 250th birthday of the United States, NASA has unveiled four cosmic images from its Chandra X-ray Observatory rendered in red, white, and blue that represent the wonders of the universe the agency explores. The images are accompanied by a trio of new sonifications – a technique that translates astronomical data into sounds.
In celebration of the 250th birthday of the United States, NASA’s Chandra X-ray Observatory has unveiled four cosmic images rendered in red, white, and blue that represent the wonders of the universe that NASA explores.
NASA/CXC/SAO
The image set begins with Cassiopeia A in the top panel, where X-rays from Chandra (represented in blue and purple) have been combined with an infrared image from NASA’s James Webb Space Telescope (red and white). Chandra’s X-ray vision reveals the blast wave that tore through the star, as well as elements in the debris field like iron, calcium, and oxygen. Webb’s infrared data also shows the expanding shell of material from the explosion and cosmic dust throughout the remnant.
In the bottom row, the first image on the left is the nebula NGC 3603, which contains a massive cluster of stars and is located in the Milky Way Galaxy. This new composite image contains Chandra’s X-ray data (red and white) and shows diffuse emissions near the galaxy’s center along with point-like X-ray sources throughout the middle of the image. Optical, infrared, and ultraviolet light from NASA’s Hubble Space Telescope (red-orange, green, blue, and yellow) reveal stars in the center of the image and dust and gas toward the bottom. The combined layering of the colors makes this nebula and the stars forming within it appear primarily red, white, and blue, with X-rays showing the sparkling lights of young stars.
The middle panel of the bottom row is a new look at the galaxy NGC 4736, also known as Messier 94. In this image, X-rays of different wavelengths from Chandra (red, orange, and blue) are layered with a visible light image from astrophotographers using their telescopes on the ground (red, green, and blue). Messier 94 is a spiral galaxy with a bright inner ring around it, called a starburst ring, where new stars are forming, perhaps fueled by gas driven in the unique oval-shaped structure seen here.
The final image in this red, white, and blue quartet features ZwCl 0024+1652. This is a distant galaxy cluster in which astronomers have found evidence for dark matter by using specially processed data from Hubble (blue). Another image from Hubble reveals the individual galaxies in the cluster (appearing as yellow and white). X-ray data from Chandra shows the enormous reservoir of superheated gas that pervades this galaxy cluster (red) with much more mass than all the galaxies taken together.
New sonifications of the three images along the bottom row of this mosaic are also available, allowing listeners to experience data through sound.
The translation of NGC 3603 into sound begins with a left to right scan, where the brightnesses of the sources once again dictate volume. Chandra’s observations of compact sources sprinkled throughout the galaxy are heard as piano notes, while the diffuse X-ray emission is mapped to a range of audio frequencies. The Hubble optical data is played as sustained tones and acoustic guitar harmonics.
In the sonification of NGC 4736, the radar-like scan moves clockwise, and the brightness of the sources dictates the volume of the sounds. X-rays from Chandra have been turned into wind-like sounds that follow the shape of the X-ray emission. Neutron stars and stellar-mass black holes (known as “compact sources”) detected by Chandra are mapped to pitched tones on a glass marimba. Optical data from ground-based observations is mapped to musically pitched tones, creating a low drone, while stars and background galaxies are heard as a soft piano.
For ZwCl 0024+1652, the sonification begins as a circle on the outside of the image and moves inward. The volume is linked to the brightness of the data, reaching one peak as the circle passes over the dark matter detected by inference from Hubble optical observations and another as it reaches the core. The background stars are heard as a swelling glockenspiel-like sound, and the galaxies are played on a piano. Chandra’s X-rays, which dominate the center of the galaxy cluster and reveal superheated gas, are represented by airy synthesizer notes.
The sonification program is led by the Chandra X-ray Center (CXC) and included as part of NASA’s Universe of Learning program. The collaboration was driven by visualization scientist Kimberly Arcand, (CXC), Matt Russo, astrophysicist; and Andrew Santaguida, musician, SYSTEM Sounds project; along with Christine Malec, consultant. Previously released sonifications of data from Cassiopeia A can be found at chandra.si.edu/sound.
NASA’s Marshall Space Flight Center in Huntsville, Alabama, manages the Chandra program. The Smithsonian Astrophysical Observatory’s Chandra X-ray Center controls science operations from Cambridge, Massachusetts, and flight operations from Burlington, Massachusetts.
To learn more about NASA’s Chandra mission, visit:
In celebration of the 250th birthday of the United States, this release includes a series of images featuring four wonders of the universe, rendered in red, white, and blue. The images contain X-ray data from the Chandra X-ray Observatory, optical and infrared data from the Hubble Space Telescope and the James Webb Space Telescope, as well as ground-based telescopes.
The main image set features composite images of the four individual objects; Cassiopeia A, NGC 3603, M94/NGC 4736, and ZwCl 0024+1652.
Cassiopeia A occupies the top panel of the frame, significantly larger than the other images in the set. The cloudy blast-wave of the supernova remnant is ring-like in shape, streaked with veins of iron, calcium, and oxygen. Here, presented in red, white, and blue, the remnant resembles an electrified donut, crackling with marbled veins of strawberry and blueberry icing.
At our lower left of the image set is the nebula NCG 3603, which contains a massive cluster of stars on the other side of the Milky Way galaxy. Here, a tight cluster of neon red and white stars packs the center of the image, dissipating as it reaches the outer edges of the panel. Sweeping in at the lower corners of the image are hazy blue clouds resembling sheets of gauze.
Centered at the bottom of the image set is the galaxy NGC 4736, also known as Messier 94 (M94). Here, the spiral galaxy is seen face on, with concentric pale violet cloud rings flecked with scores of stars in white, pale blue, soft red, and golden yellow. The inner ring of the galaxy is bright, and rosy yellow in color. This is a starburst ring, where new stars are forming.
At our bottom right of the image set is the distant galaxy cluster ZwCl 0024+1652. The image is packed with streaks and specks in golden yellow and brilliant white. Upon close inspection, each streak and speck is revealed to be an individual galaxy, some with discernible spiral shapes. At the center of the image is a round pool of bright red light, surrounded by royal blue haze. The red light represents X-ray observations by Chandra, which reveal an enormous reservoir of superheated gas pervading the cluster. The blue haze represents specially-processed data from Hubble, suggesting evidence of dark matter.
This release also includes new sonifications of the three images presented in the bottom row of this data set, allowing listeners to experience the data through sound.