Normal view

There are new articles available, click to refresh the page.
Today — 16 September 2026Main stream

Heat Domes: Meet the Quiet and Oppressive Take on the Thunderdome

16 September 2026 at 10:00

One of the nice things about the weather is that even if it’s bad right now, it’ll definitely be changing soon and maybe even for the better. There is one exception to this rule, however, and that comes in the form of heat domes, which are weather systems whereby a region of air becomes isolated from the surrounding systems. This creates effectively a greenhouse, with hot air remaining trapped and moisture unable to get in.

Although until recently not very common, this weather phenomenon poses a major challenge to any flora and fauna that finds itself trapped in a heat dome. With nights being about as hot and stifling as the days with their blue skies unbroken by any cloud cover and no rain for potentially weeks on end, it poses severe hydration, cardiovascular, and other challenges to any affected lifeforms.

Hot Summers Vs Heat Domes

Formation of a heat dome. (Credit: Cmglee, Wikimedia)

Although it can be easy to mix up hot summer weeks, heatwaves, and heat domes, these terms all have their own specific meaning and implications. Each season has its own typical weather patterns and associated minimum- and maximum temperatures. These exact values have also fluctuated over the centuries and millennia due to a variety of factors, but the important detail is whether this typical maximum temperature is exceeded in a significant manner.

A heat dome is, for instance, not just a heatwave. The exact definition of a heatwave is not universal, but in general it means at least a couple of days of day-time temperature excursions well above this average maximum. In the UK for example at least two days are required before it is officially termed a ‘heatwave’. These heatwaves have become more common as global surface temperatures have increased on account of anthropogenic climate change.

A heat dome requires two factors to form, the first being a period of calm, warm weather, the second being a large area of high pressure that remains in place for an extended period of time. As the hot air rises, the high pressure in the higher atmosphere layers pushes back on this air, compressing it and causing adiabatic heating.

This creates a cycle in which the increasingly warmer and drier soil is exposed to the relentless Sun in the cloudless sky, with even nights bringing barely any change. What keeps this stagnant air from dissipating an “atmospheric block”.

Weather Block

An Omega block. (Credit: UK Metrological Office)

There are two types of blocks: omega and diffluent blocks. The omega block is commonly observed with heat domes, creating the Ω-shaped pattern from which it derives its name.

How long these blocks persist can differ wildly. The UK experienced a very hot Summer in 1976 when such a block persisted for months and thus drove up temperatures. Generally they last on the order of days to weeks.

Because of how heatwaves and heat domes overlap without a clear distinction, once you add a blocking system the UK’s Met Office prefers to call them ‘persistent summer blocking highs’, as this is their most defining feature. This can also be seen pretty well on maps of the 2021 Western North America heat wave.

Pacific Heat 2021

NASA Earth Observatory image of temperature anomalies on June 27th, 2021 compared to 2014-2020 average for the same day during the 2021 western North America heat wave (Credit: NASA)
NASA Earth Observatory image of temperature anomalies on June 27th, 2021 compared to 2014-2020 average for the same day during the heat wave (Credit: NASA)

Affecting much of Western North America from late June through early July, this extreme heatwave broke many records, including the highest temperature ever measured in Canada, at 49.6 °C. Eventually classified as a heat dome, by the time it dissipated around 1,400 excess deaths among the human population were recorded, as well as countless more deaths among farm animals, in addition to the highly destructive Lytton wildfire and general damage to agriculture.

In this case a block ensured that this area of static hot air could not dissipate or otherwise experience some cooling air from the Pacific.

The formation of this block was predicted by meteorologists after they observed warm, moist air from torrential rains in China make its way across the Pacific with help from the jet stream. At this time the Southwestern US was already experiencing a drought, setting the stage for the heat wave by providing additional heat to the Pacific Northwest.

As can be seen in the below barometric chart of the time, this led to the air transported by the jet stream to become trapped in between low pressure areas, exerting downwards pressure on the area below that was already enjoying a warm summer.

Pressure chart during the 2021 heat wave. (Credit: NOAA)

A similar phenomenon occurred over Europe during the summer of 2026, with multiple heatwaves involving heat domes forming and persisting for weeks on end. Previous summers in Europe had already significantly warmer and drier than previously, creating the conditions for a record-breaking summer.

With the blistering 2025 European summer already causing many wildfires and excess mortality cases, the summer of 2026 was by all metrics more severe. This raises the awkward question of we can expect things to only get worse from here, not just in Europe but worldwide.

Heat In The System

Ultimately the mechanisms that drive the formation of heatwaves and heat domes become more effective when there is more thermal energy in the system. This means more torrential rains, a higher surface temperature, more droughts and so on.

Of all of Earth’s continents, Europe is the one that is warming up the fastest, with already 2.3 °C above preindustrial levels in 2022. Although there are ways to adapt to a drier, hotter climate, including for our thermal power plants, ideally we would reduce the amount of energy in the Earth’s weather systems.

Doing this means effectively reverting as much as possible of anthropogenic climate change by not adding greenhouse gases to the atmosphere, including SF6 which is still very common in switching gear, including that installed in wind turbines. Even as we build out our grids with more clean power, it’s of course essential to also keep an eye on grid stability.

Ultimately this increase in heatwaves, and worse, is largely a human-made phenomenon which fortunately means that we also have the power to make the planet cool down again. As fascinating of a meteorological phenomenon a heat dome is, it’s definitely one of those things that’s best enjoyed once every generation or less.

Overdone weather graphics from the 2021 Pacific Heat Dome from CBS News.
Before yesterdayMain stream

NASA Rocket Takes First Multi-Point Look Inside Radio-Disrupting Clouds

2 September 2026 at 10:53

High above Earth, thin veils of metallic haze drift through the edge of space. Known as sporadic E layers, these high-altitude “clouds” form from the vaporized dust of burnt-up meteors, earning their name from the unpredictable way they emerge and then dissipate. Now, new results from a NASA sounding rocket — a suborbital research rocket — that flew five detectors through one of these layers simultaneously reveal unexpected complexity in the layer for the first time.

Though invisible to the eye, sporadic E layers make their presence known to the radio signals we rely on for long-distance communication. When present, sporadic E can send those signals ping-ponging off in unexpected directions, rendering the technology temporarily unreliable.

Scientists have long sought a fuller understanding of these radio-disrupting clouds, but until recently, they had only sampled them one narrow slice at a time. The rocket, called the sporadic E Electrodynamics Demonstration, or SpEED Demon for short, launched from NASA’s Wallops Flight Facility in Virginia on Aug. 24, 2022, and demonstrated the first concurrent, multi-point view inside sporadic E.  Its results, from a team led by Embry-Riddle Aeronautical University, are described in a new study in the Journal of Geophysical Research: Space Physics.

Sporadic E layers form in the ionosphere, a region of the upper atmosphere beginning around 40 miles (60 kilometers) up where the neutral gases begin to transform into plasma, or ionized gas. Some of the particles there come from meteors, which burn up and leave behind traces of iron, magnesium, and other metals. These metals occasionally clump into dense, cloud-like sheets — the sporadic E layers — that reflect radio waves.

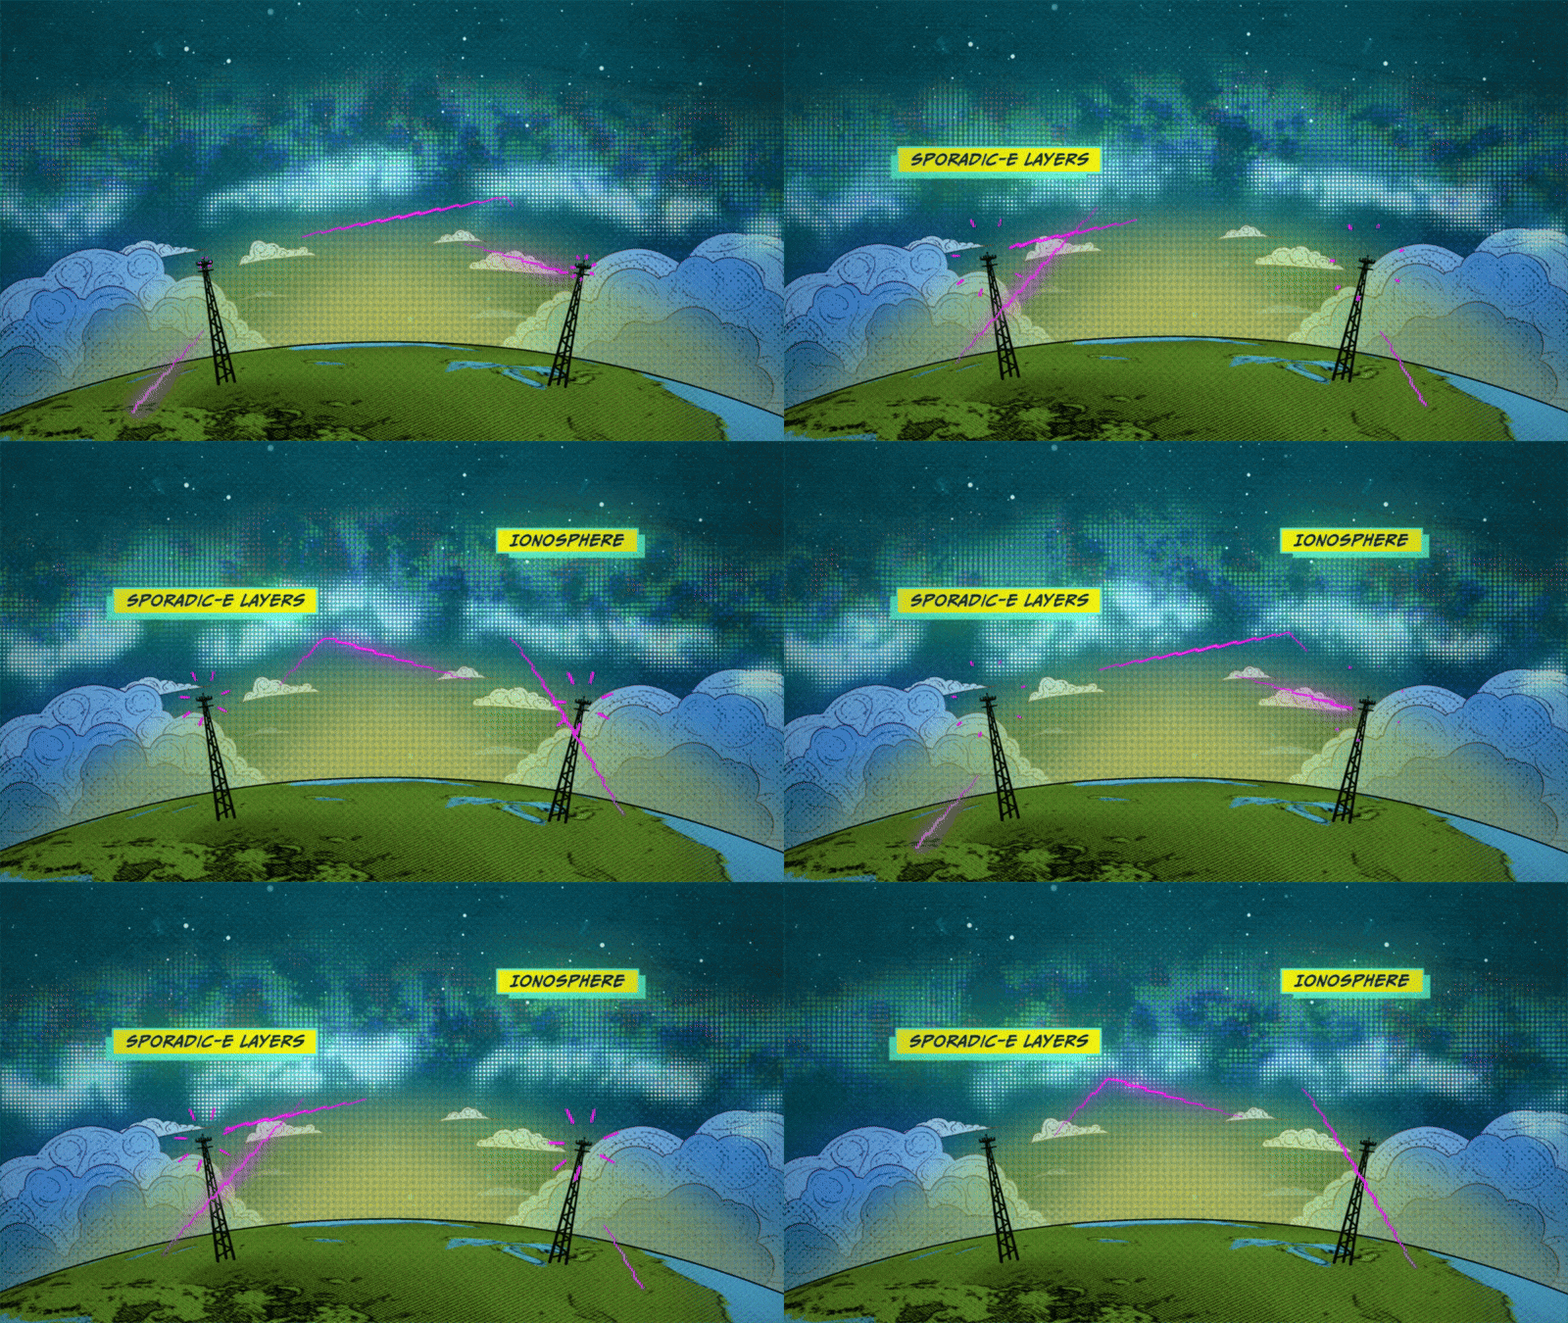
Digital illustration of a curved Earth with green land and blue clouds representing sporadic E layers. Two communication towers stand on the surface, sending and receiving zig-zagging magenta beams of radio signals against a starry, glowing dark blue nebula sky. Two labels appear, sporadic e layers (on the clouds) and ionosphere, above the clouds, representing the intended target of the radio beams.
An animated illustration depicts Sporadic-E layers forming in the lower portions of the ionosphere, causing radio signals to reflect back to Earth before reaching higher layers of the ionosphere.
NASA’s Goddard Space Flight Center/Conceptual Image Lab

“Sporadic E layers are, in one sense, giant mirrors of radio frequency waves in the sky,” said Aroh Barjatya, the mission’s principal investigator and a professor of engineering physics at Embry-Riddle in Daytona Beach, Florida.

When a sporadic E layer forms, signals meant to travel out to space can ricochet back toward the ground. Air traffic controllers and marine radio users may pick up distant transmissions as though they were nearby, and radars scanning beyond the horizon can register so-called “ghosts,” or false targets. The effects reach everyday technology, too.

“The biggest source of error in the GPS in your phone, for example, is from the plasma in the ionosphere, and sporadic E layers can contribute to this uncertainty,” said Henry Valentine, the study’s lead author, who conducted the work at Embry-Riddle and is now a researcher at the U.S. Naval Research Laboratory.

Because sporadic E layers hover around 60 miles (100 kilometers) up—too high for weather balloons, too low for satellites — and form and dissipate unpredictably, they have long been the province of sounding rockets, which can be launched on short notice to catch one in the act. But a single rocket flies a single path, taking measurements only along a line. Barjatya likens the situation to viewing a scene through a crack in a wall. One can only observe what is happening along that narrow slit, missing out on the crucial context of whatever is occurring to the left or right of one’s view.

The SpEED Demon mission changed that. The mission was the first to deploy ejectable probes, called dropsondes, inside a sporadic E layer. Once inside, the rocket released four dropsondes that flew away from the main payload and from one another, each measuring the plasma along its own track and beaming its measurements back to ground stations. Together with the main payload, the probes sampled the layer in a total of five places at the same moment.

A group of people in blue lab coats stands around a tall, metallic rocket component inside an industrial facility with beige protective curtains.
The SpEED Demon team poses with payload section during testing at NASA’s Wallops Flight Facility.
NASA Wallops/Berit Bland

“Now with multiple sensors, we’ve turned that crack into a picket fence,” Barjatya said.

The data revealed surprising complexity inside the sporadic E layer. Rather than a smooth, dense pancake of metallic particles, the layer that SpEED Demon flew through appeared uneven and structured, shaped by turbulent winds moving through the neutral air around it.

“A lot of times you think of sporadic E as this single sharp density layer, but what we saw in ours is it’s interacting with neutral wind and these swirling atmospheric turbulences,” Valentine said. “Rather than a flat pancake, it’s closer to a cinnamon roll.”

On the way down, the layer even split into two distinct peaks. The team found that shape was consistent with modulation by Kelvin-Helmholtz billows, the curling, wave-like instability that produces breaking-wave patterns in ordinary clouds. Because the flight was unable to measure the local winds and electric fields directly, the researchers are careful to call the billow explanation plausible rather than confirmed.

The SpEED Demon mission was designed as a technology demonstration — a test of whether the dropsonde technique would work at all. It did, and the team was quick to apply it again. Barjatya’s team used a similar multi-probe strategy to launch rockets into the paths of the October 2023 annular eclipse and April 2024 total solar eclipse, studying how the sudden darkness disturbed the upper atmosphere. In June 2025, they flew SpEED Demon’s most direct descendant, Sporadic-E ElectroDynamics, or SEED, into sporadic E layers from Kwajalein Atoll in the Marshall Islands, studying them at lower latitudes. Papers from those missions are in preparation.

A rocket launches at night, surrounded by bright flames and smoke, with a tall supporting structure visible and the dark sky in the background.
A sounding rocket launch testing science instruments for future missions was successfully conducted at 9:16 p.m. EDT, Aug. 23, 2022, from NASA Wallops Flight Facility in Virginia.
NASA

After years of study, sporadic E layers are no longer as unpredictable as they once were. “They have a seasonality to them, with peak occurrence happening in the local summer,” Barjatya said.

Questions about how and when they form are increasingly fine-grained. The new deployable multi-point rocket sensor methodology, along with ground-based measurements, is likely to bring the picture even closer to completion. “The science community as a whole is now in its final stretches of fully understanding these giant radio frequency mirrors in the sky,” Barjatya said.

By Miles Hatfield 
NASA’s Goddard Space Flight Center, Greenbelt, Md. 

About the Author

Miles Hatfield

Miles Hatfield

Keep Exploring

Discover More Topics From NASA

NASA’s COFFIES Uses AI to Predict Storm-Causing Active Regions on Sun 

14 August 2026 at 13:00

5 min read

NASA’s COFFIES Uses AI to Predict Storm-Causing Active Regions on Sun 

As humanity looks to the Moon and stars for future exploration, predicting space weather — conditions in space primarily driven by the Sun — is more important than ever. 

Now, a team of astrophysicists and data scientists with NASA’s COFFIES (Consequence Of Fields and Flows in the Interior and Exterior of the Sun) has developed a novel machine-learning model capable of predicting the emergence of active regions on the Sun up to 12 hours before they appear. 

The Sun is constantly churning. Intense concentrations of localized magnetic fields can suddenly break through the solar surface, forming sunspots. Space weather forecasters then collectively number and track sunspots since they are visible manifestations of active regions, which serve as the main engines behind severe space weather events such as solar flares and coronal mass ejections. These eruptions send waves of high-energy radiation and charged particles across space, creating storms that can threaten astronauts, disable satellites, and disrupt radio communications on Earth. 

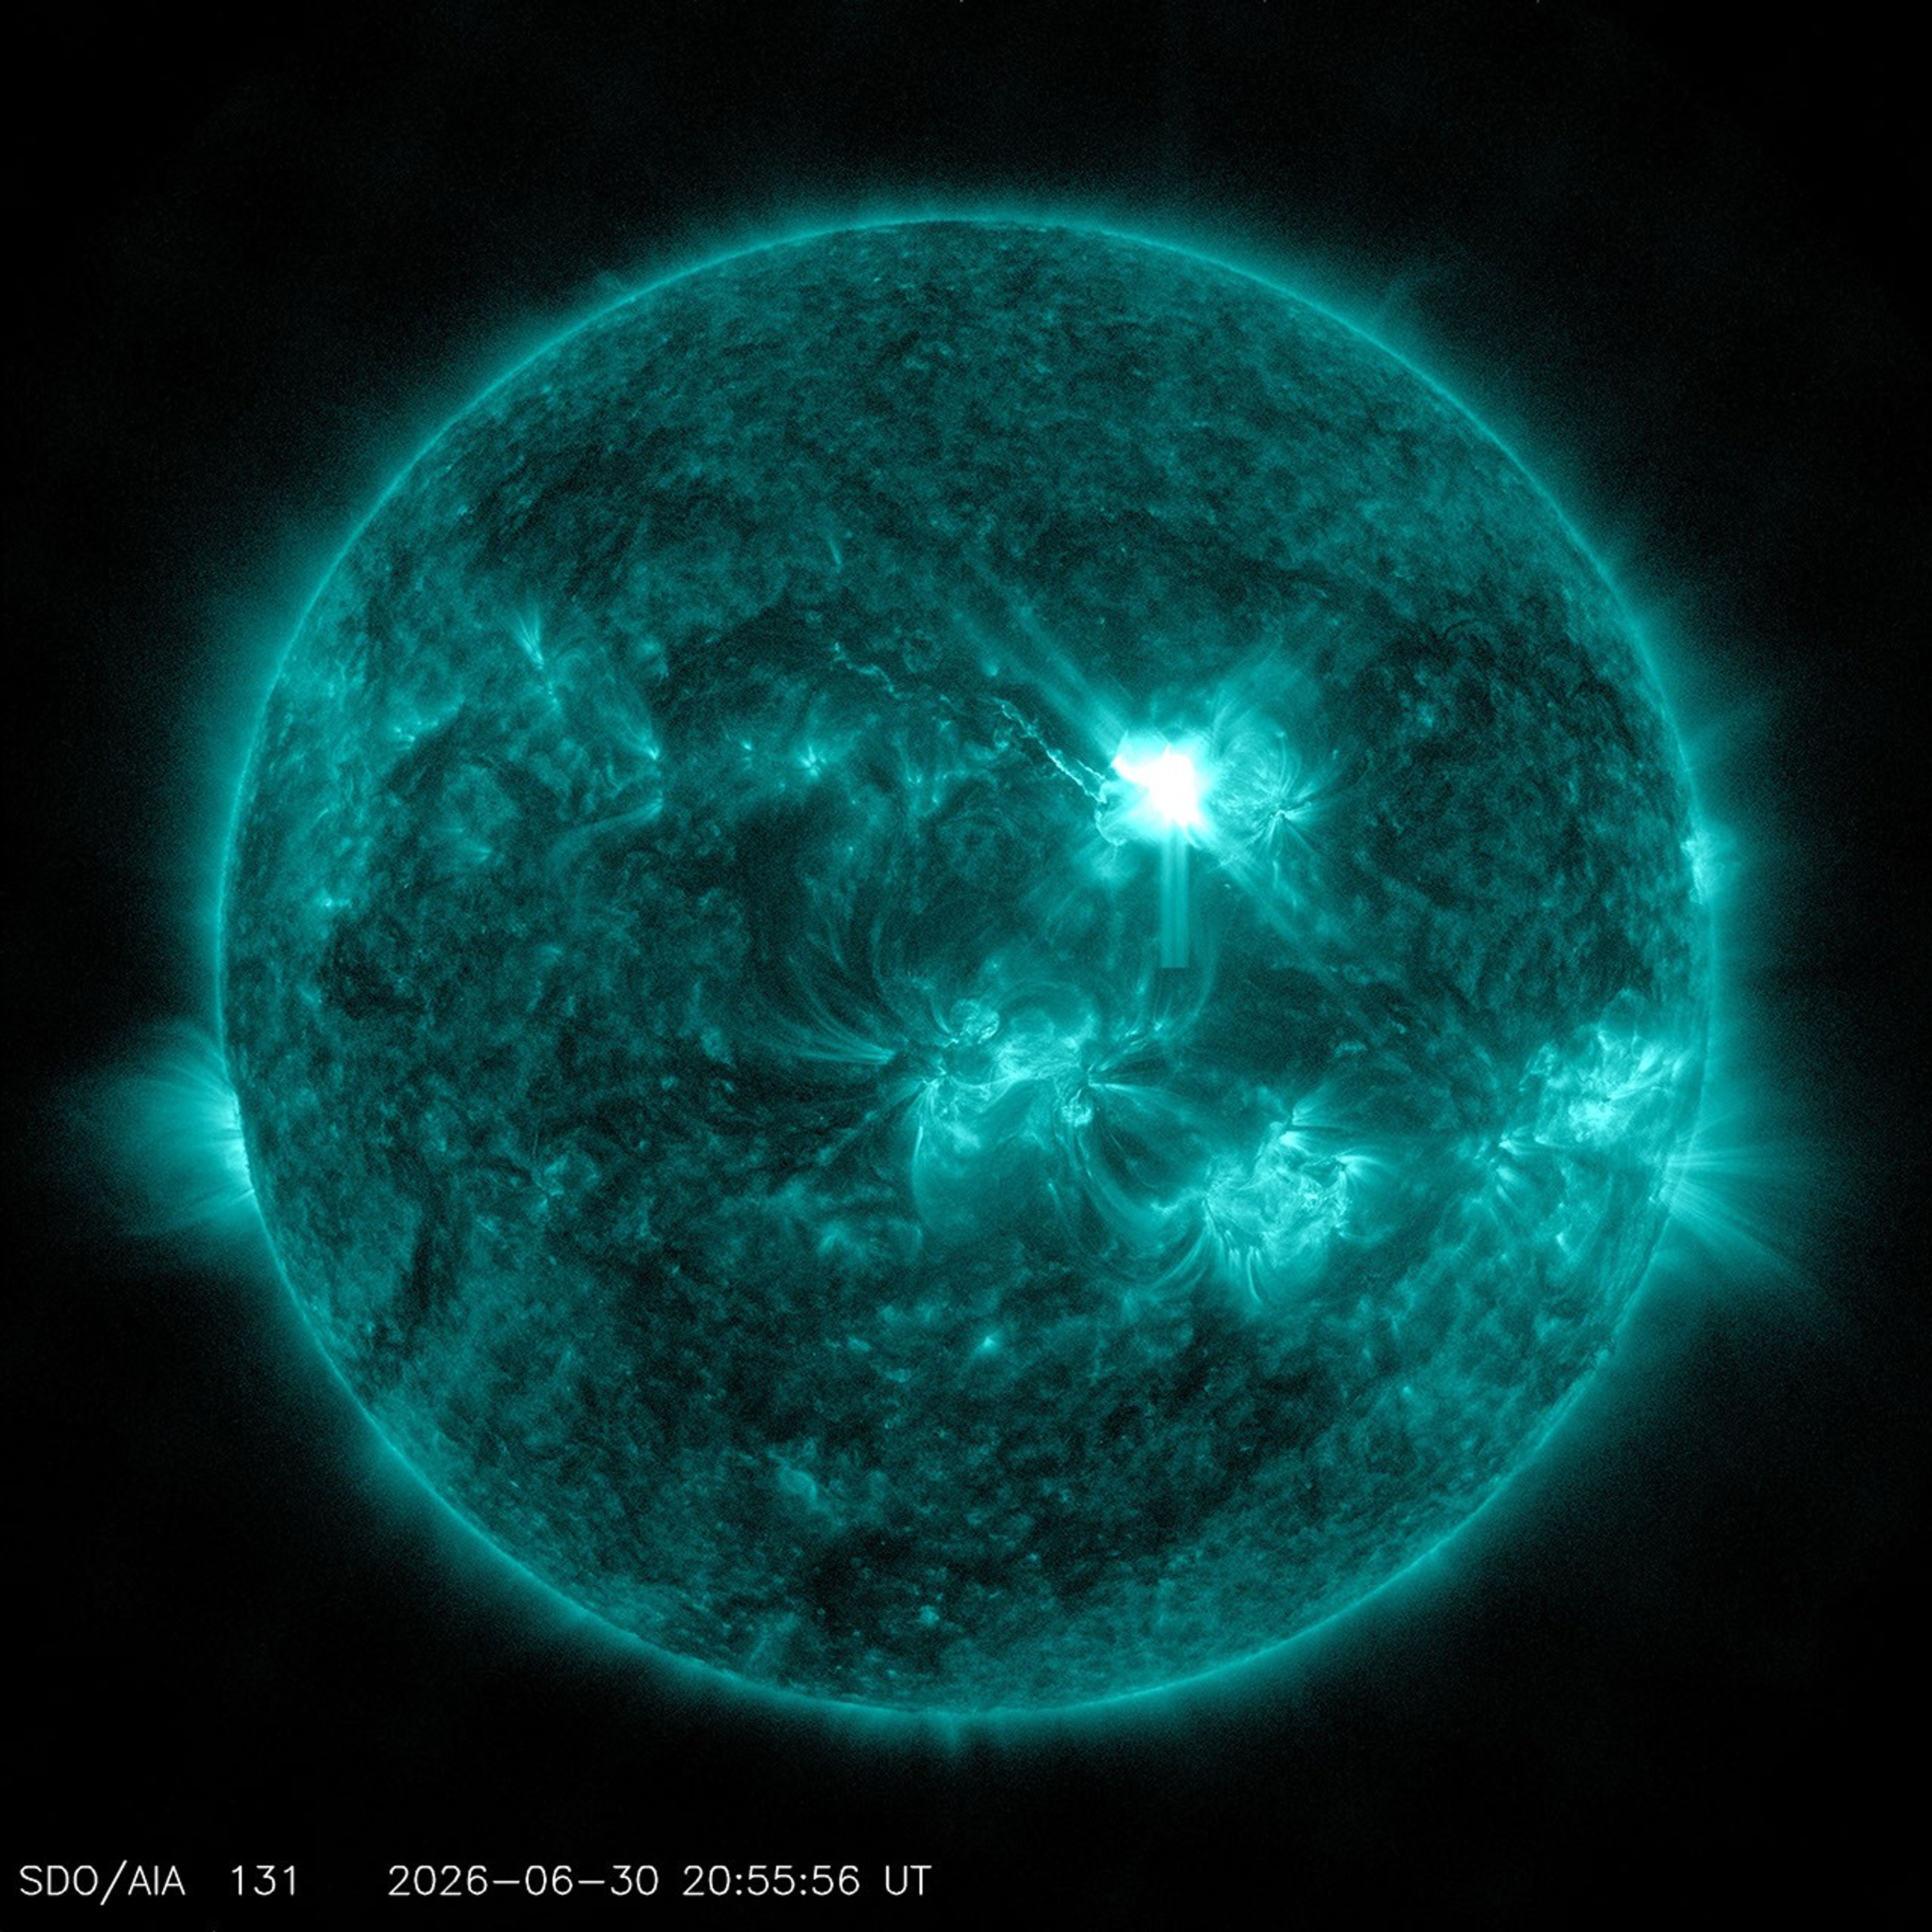
The Sun appears in shades of teal with some brighter and darker regions, set against a black background. In the upper right part of the Sun is a bright flash of white, a solar flare.
NASA’s Solar Dynamics Observatory captured this image of a solar flare — seen as the bright flash in the upper right — on June 30, 2026. The image shows a subset of extreme ultraviolet light that highlights the extremely hot material in flares and which is colorized in teal.
NASA’s Goddard Space Flight Center/SDO 

By bridging expertise across different scientific institutions, COFFIES, a NASA DRIVE (Diversify, Realize, Integrate, Venture, Educate) Science Center, brought together a team of researchers from New Jersey Institute of Technology (NJIT), Princeton University, and NASA’s Ames Research Center in California’s Silicon Valley. The team turned to advanced artificial intelligence architectures — which dictate how data is processed and used to produce reliable predictions or actions — to capture subtle, time-based pattern changes on the solar surface before an active region took shape. By analyzing data captured by the agency’s Solar Dynamics Observatory and using NASA Ames’ supercomputing resources, this new approach, published in the Journal of Geophysical Research: Machine Learning and Computation, looks at fluctuations in acoustic waves caused by sunspot regions when the regions form beneath the solar surface and begin the journey upward to emerge on the surface. 

“We cannot directly see the magnetic structure while it is still rising through the solar interior. Instead, we must look for indirect effects — very small changes in the magnetic field and in the pattern of acoustic waves continually traveling through the Sun,” said Alexander Kosovichev, a COFFIES co-investigator at NJIT. “The developed technique identifies precursors associated with an emerging active region in slight changes of the Sun’s acoustic power — more like a slight change in rhythm within a very noisy orchestra.” 

This video is an example of what scientists use when analyzing the solar surface. This particular time frame tracks the magnetic field on the Sun’s surface during the emergence of active region AR11158 in February 2011. The blue square grid highlights a target area on the Sun. The squares on the right side translates the data from the target grid area to show opposing magnetic polarities, indicated by the warm and cool-colored tones. The first column of blocks shows targeted areas at original resolution, the middle column displays data as 2D maps, and the right column plots changes in magnetic polarity over time as 1D curves. By watching these blocks, scientists can see signs of active region emergence, such as drops in acoustic waves and rises in magnetic fields.
NASA’s COFFIES DRIVE Science Center/Irina Kitiashvili and Spiridon Kasapis

To develop current operational forecasts, the National Oceanic and Atmospheric Administration’s Space Weather Prediction Center and the United States Air Force monitor active regions that are already visible on the Sun to analyze the regions’ characteristics and estimate the probability of solar flares.

The COFFIES team aims to revolutionize this process. The AI model the team developed a specialized early detection system to handle very long sequences of data — called sliding-window transformer architecture — to use observations to find tiny reductions in the Sun’s acoustic activity and magnetic field, signals that scientists struggled to capture until now. These reductions form patterns that the AI model uses to predict active regions several hours before they become visible on the solar surface. Instead of looking at all activity on the solar surface at once, like earlier deep learning approaches have done, this new model moves a fixed-size “viewing window” across a long timeline of the Sun’s activity to focus on recent data while remembering overall patterns. This method allows forecasters the ability to predict approximate locations of emerging sunspots, rather than relying on counting already visible sunspots. 

This promising AI architecture shows how deep machine learning can contribute to heliophysics — the field studying the nature of the Sun and how it influences the very nature of space and the planets that exist there. While the model is not ready for operational real-time forecasting, the team plans to validate the approach across many more known solar events to fine-tune the model. 

NASA’s real-time space weather monitoring 

As NASA focuses on sending humans to explore the Moon with the Artemis missions and sending the first crewed missions to Mars, monitoring and forecasting space weather is important for ensuring the safety of our astronauts and the equipment they rely on. This predictive leap from the COFFIES team could prove vital for safeguarding technology and deep-space explorers from the volatile environment of our solar system.

NASA’s Moon to Mars Space Weather Analysis Office monitors space weather 7 days a week. This important work helps decision makers not only protect people and equipment but maintain the services our modern society relies on every day. NASA’s space weather monitoring is also critical for safeguarding astronauts as they journey to the Moon and onward to Mars.
NASA/Lacey Young

Teams across NASA and NOAA collaborate to transition research capabilities into actual 360-degree space weather monitoring operational tools — including NASA’s Space Radiation Analysis Group, Moon to Mars Space Weather Analysis Office (M2M SWAO), and Community Coordinated Modeling Center as well as NOAA’s Space Weather Prediction Center. Sunspot region emergence prediction capabilities, especially of the Sun’s far side, could provide new information that supplements current models used by these teams.  

“The COFFIES AI model is exciting to our team because it could provide us with new capabilities towards predicting potential flaring locations ahead of time,” said Michelangelo Romano, M2M SWAO deputy director. “With this heads up, we can provide additional support to NASA missions.”

NASA’s COFFIES is one of three DRIVE Science Centers created to encourage collaborative science by establishing centers that are made of multidisciplinary teams from several institutions across the U.S. These pioneering facilities employ modelers, theoreticians, computer scientists, and observers to study important mysteries of our star and its influence, a branch of science known as heliophysics.  

The COFFIES team focuses on the interconnected processes behind the Sun’s activity. Understanding the Sun’s interior and magnetic variability is key to advancing our understanding of the Sun’s 11-year activity cycle and fine-tuning space weather forecasting tools.  

About the Author

Desiree Apodaca

Desiree Apodaca

NASA’s Heliophysics Missions Communications Lead

Keep Exploring

Discover More Topics From NASA

❌
❌