Normal view

There are new articles available, click to refresh the page.
Before yesterdayMain stream

Building Foresight for Earth Science, featuring Lindsey Jacobson

26 August 2026 at 15:14

NASA’s Earth-observing satellite missions track dozens of features of a changing planet — aerosols, sea levels, land cover, cloud cover — over years and decades. Sustaining that record for the scientific and operational communities who depend on it requires more than engineering talent. It requires planning for an uncertain future: anticipating where a mission delay or on-orbit event might create a gap in the data those communities rely on.

Lindsey Jacobson’s work helps NASA anticipate those disruptions before they happen and gives senior leaders options for managing them.
A Pathways intern in engineering, Jacobson supports NASA’s Earth Science Division through the NASA Earth Science Strategic Integration Environment (NESSIE) team within the Systems Analysis and Concepts Directorate (SACD) at NASA’s Langley Research Center in Hampton, Virginia.

NASA’s Pathways program connects undergraduate and graduate students with NASA centers through internships that, with satisfactory performance, can lead to full-time civil service positions. Jacobson has returned to NASA Langley every summer since 2022, splitting her time between the center and finishing her mechanical engineering dissertation at North Carolina State University.

Lindsey Jacobson, NASA Pathways intern, at NASA Langley Research Center
Lindsey Jacobson, Pathways Intern
Credit: NASA


“The way we do Earth science is changing.


The Problem Space

Jacobson and the NESSIE team support the Earth science satellite portfolio — dozens of missions, each measuring specific features of the planet, from clouds to sea surface temperature to land use. The goal is providing end user communities with the data products they depend on. The challenge is the unknown.
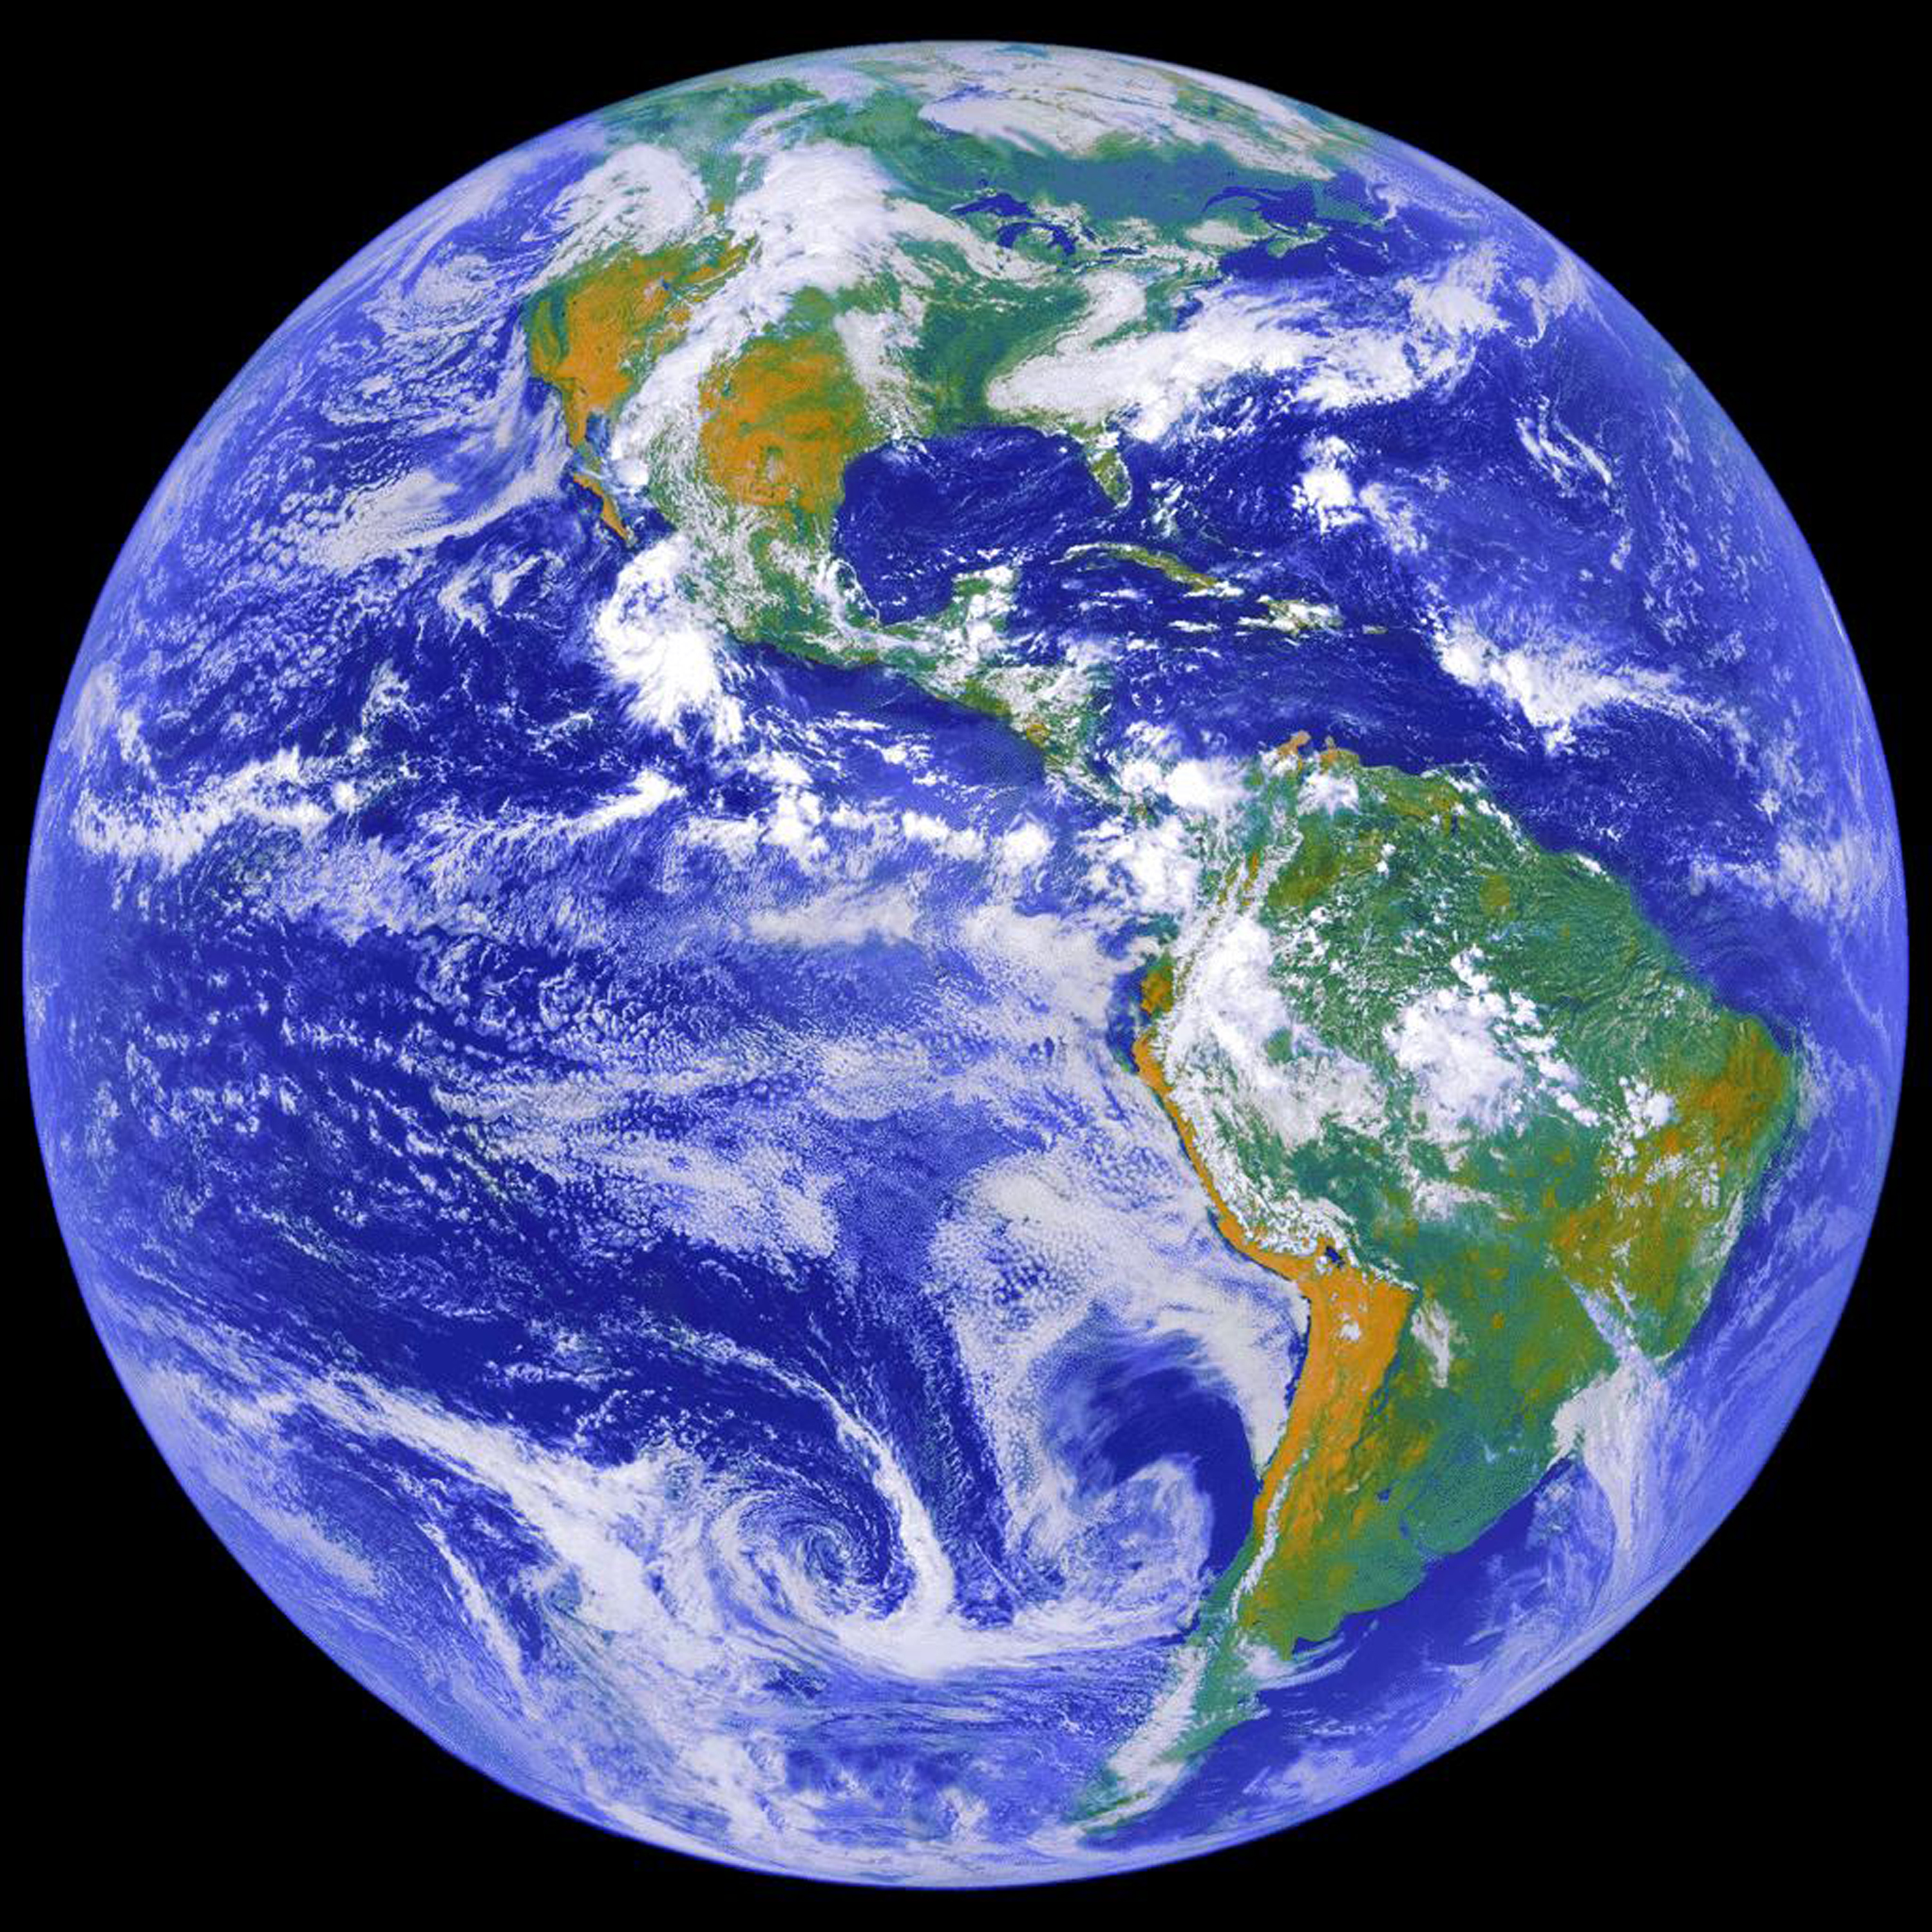
Full-disk image of Earth captured by NOAA's GOES-8 satellite, which operated from 1994 to 2004
This image depicts a full view of the Earth, taken by the Geostationary Operational Environment Satellite (GOES-8), a satellite that was in service from 1994-2004. It was owned and operated by the National Oceanic and Atmospheric Administration (NOAA) and provided the kind of continuous monitoring necessary for intensive data analysis.
Credit: NASA

“There’s uncertainty about mission lifetimes and what could happen on orbit, and about schedules,” Jacobson explains. The team’s work gives NASA’s senior leadership a way to navigate that uncertainty: understanding where a gap in coverage might emerge and identifying options to mitigate or hedge against it. By providing alternative pathways for meeting end-user needs, this work supports senior leaders in managing a complex, interdependent portfolio.

Writing the Code

Within that effort, Jacobson’s focus is building analysis tools that give the team what she calls a “foresight ability.”

“It’s the ability to anticipate different things that might happen — changes that might occur across the portfolio of Earth-observing missions — and to have strategies in mind for how to respond, so we can keep delivering data to end users,” she says.

Not every change is bad news. Missions sometimes operate well beyond their planned lifespan, creating room to extend their value. But whether an adjustment is welcome or not, the principle is the same: know the options before anything happens.

Jacobson compares it to preparing for hurricane season. “You get the storm shutters, you buy the sandbags, and you have them pre-positioned,” she says. “Then when the warning comes, you’re not scrambling, and you’re not at risk of the store selling out. You already have what you need in place.” NESSIE’s work follows the same logic for the Earth-observing portfolio by understanding ahead of time what a disruption might mean and having a set of responses ready before anything happens.

“We proactively suggest the strategies and alternatives that could be enacted if there’s a change,” Jacobson says. “We do that ahead of time, so people understand what options might exist.”

Her approach carries echoes of her graduate research, which examines how complex systems — infrastructure that can’t simply be torn down and rebuilt, like the electric grid — must evolve deliberately instead. “We designed a grid, and now we live with that grid forever,” she says. “We can’t tear it down and build a new one. What we can do is modify, expand, and improve upon what we have.” It’s the same instinct for working with what exists, rather than starting from scratch, that shapes how she approaches her work at NASA.

Keeping Pace

Engineers arriving at NASA for the first time might expect the hardest part of the job to be technical. Jacobson found something else: the landscape itself is what demands the most adaptability.

“The way we do Earth science is changing,” she says. Commercial companies are increasingly contributing data alongside government agencies. New space agencies are entering the field. Innovative technologies and architectures are emerging all the time. Keeping pace with that shift — understanding how NASA’s own capabilities are evolving and how to best serve the communities that depend on the data — is as much a part of the job as any calculation.
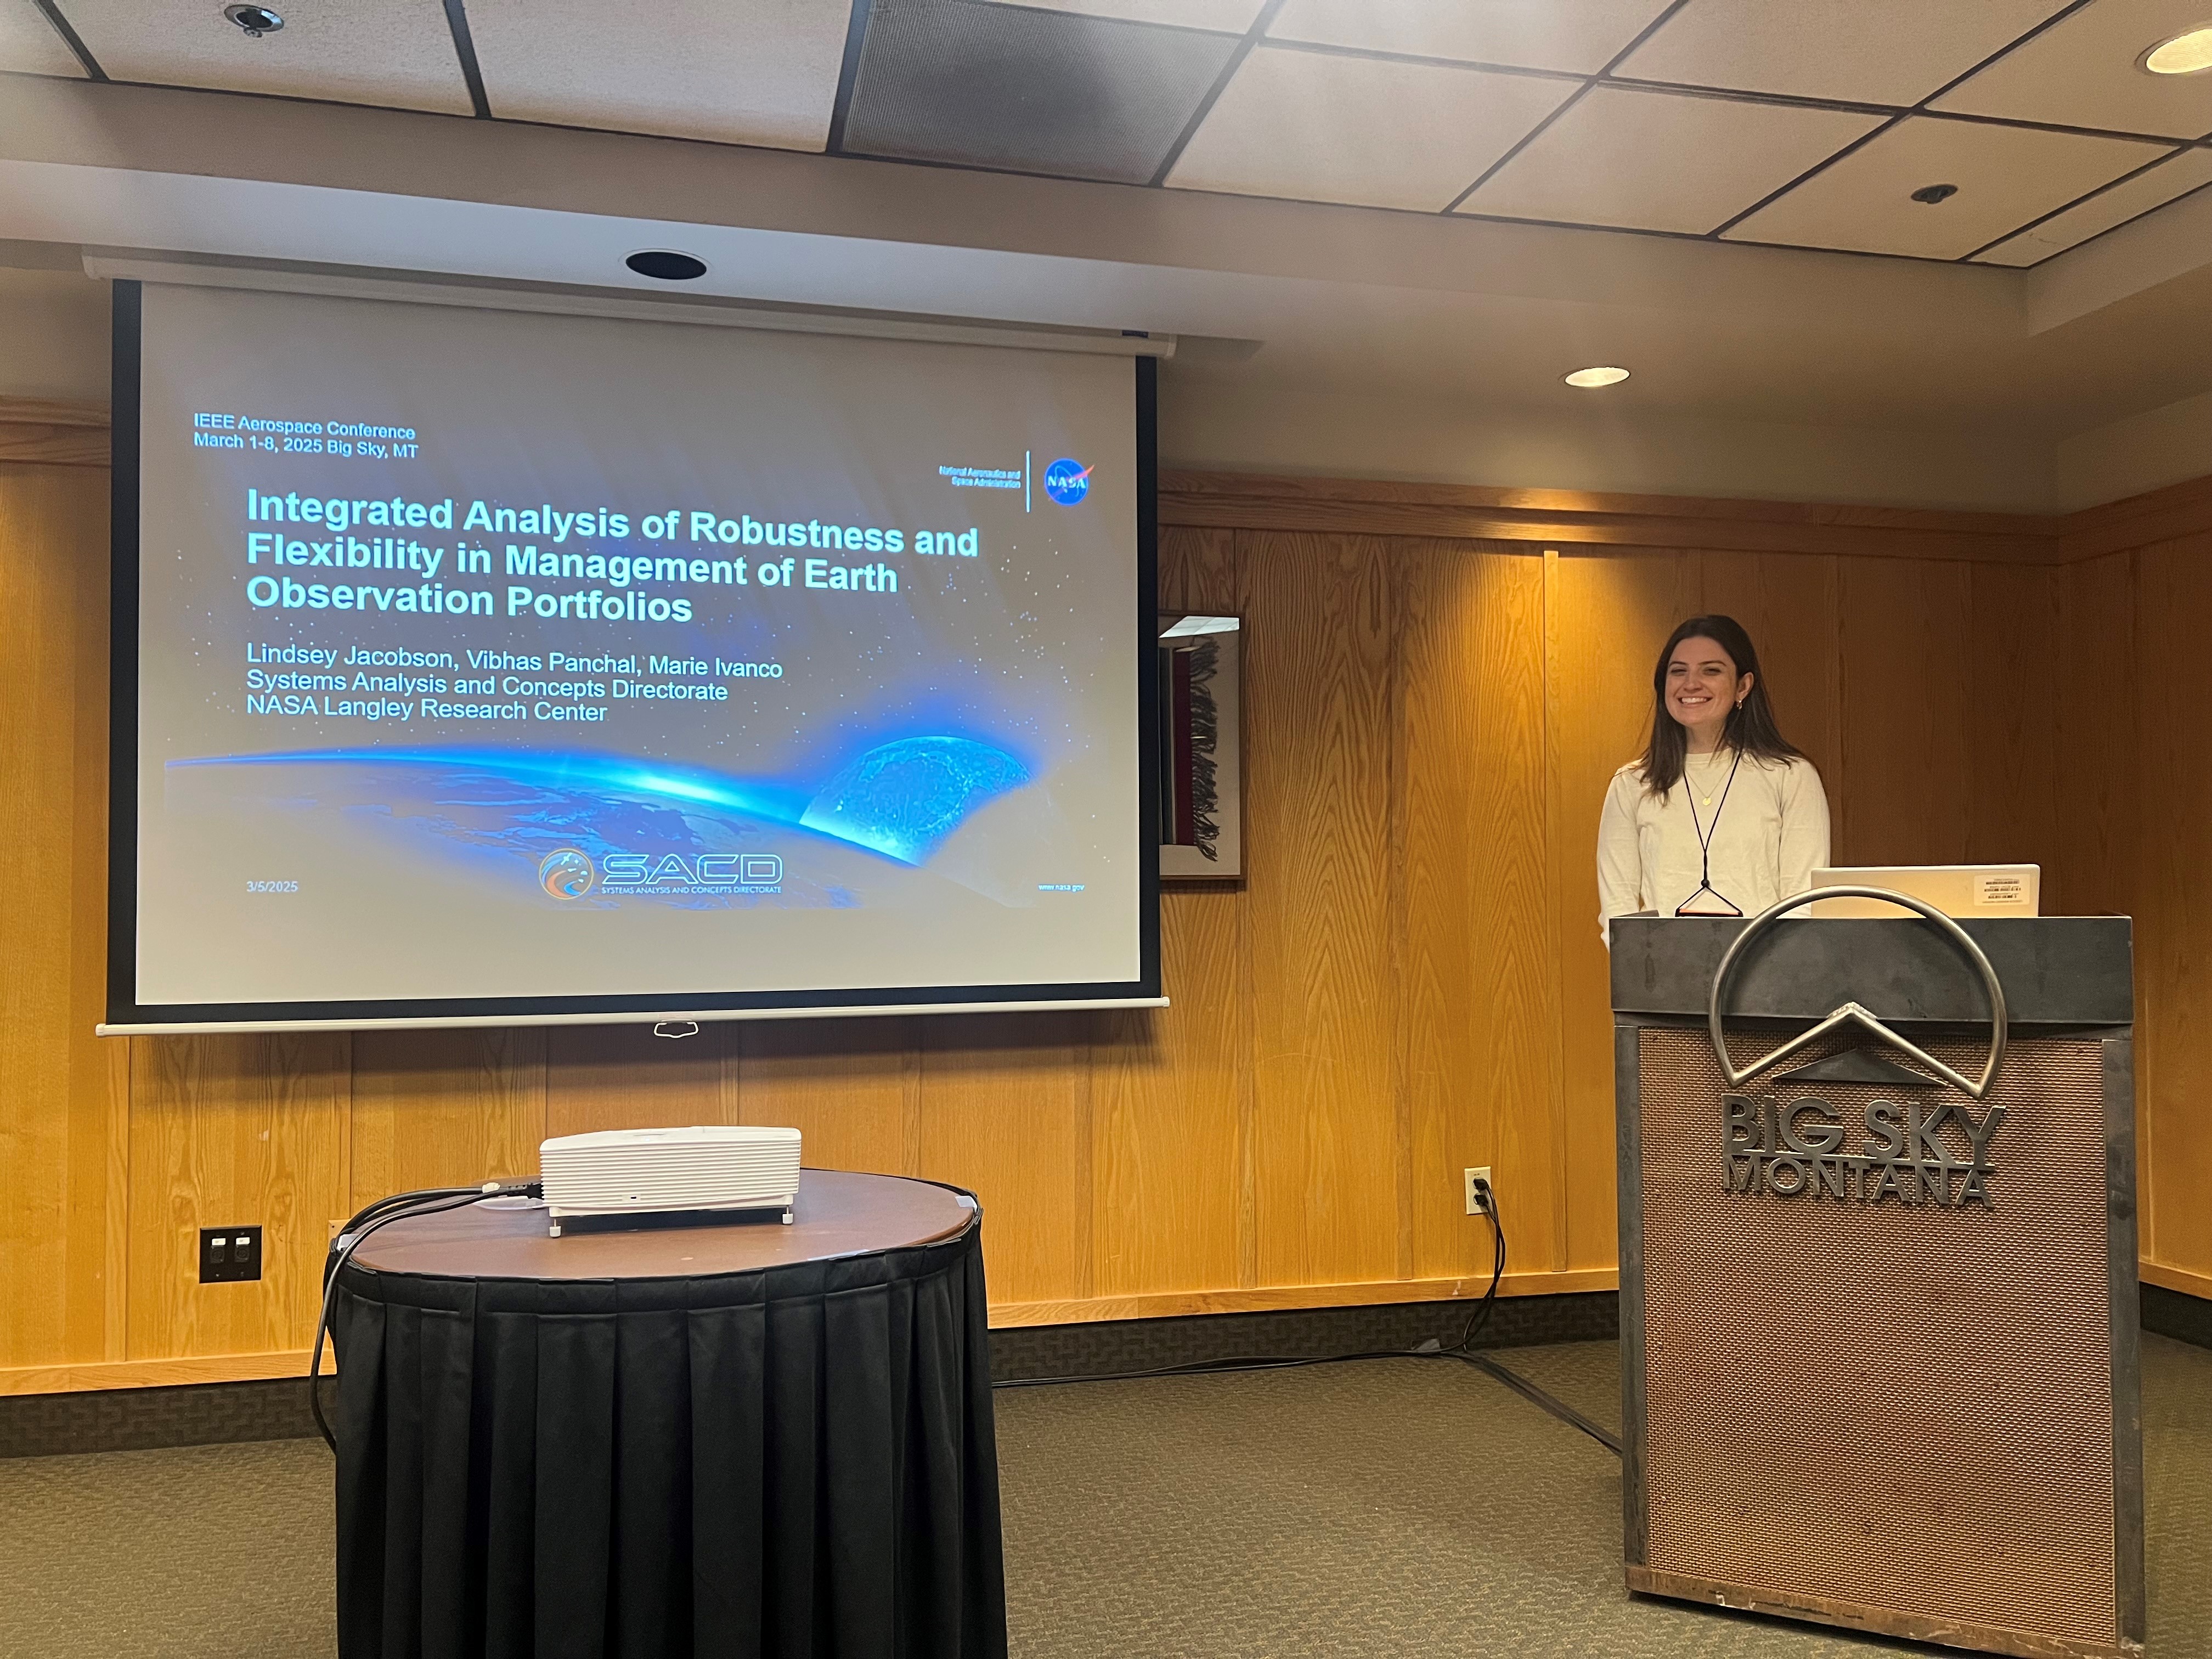
Lindsey Jacobson presents NESSIE's work on managing Earth-observing mission portfolios at the 2025 IEEE Aerospace Conference
Jacobson presenting NESSIE’s work on managing portfolios of Earth-observing missions to meet science needs despite uncertainties in mission scheduling and lifetimes, Institute of Electrical and Electronics Engineers (IEEE) Aerospace Conference, 2025.
Credit: NASA

Some of that adaptability shows up in smaller ways too, like the growing role of AI tools in her team’s own workflow. “Langley has done a lot of firsts,” Jacobson says, echoing something she heard recently from Trina Dyal, NASA Langley’s director, at an intern event. “And we want to continue to be the first. That means learning new things and figuring out how to bring them into how we work.”

On Jacobson’s Sci-Fi Shelf

The Sirens of Titan by Kurt Vonnegut

Jacobson received this novel in high school, let it sit on her shelf for years, and finally picked it up during the pandemic.

“It was very special. It touches a lot on the meaning of life, and that connects to some of the reasons I was motivated by space in the first place. The idea that space exploration can bring humanity together. That cosmic perspective.”


Part of the Systems Analysis and Concepts Directorate at NASA’s Langley Research Center.
Learn more about our work by visiting our website.

Hackaday Europe 2026: Open Source Hardware Goes Underground, Literally

By: Tom Nardi
17 August 2026 at 10:02

These days open source is everywhere, and frankly, we couldn’t be happier about it. But even with as prevalent as open software and hardware has become, we still occasionally hear about a project that takes the concept somewhere unexpected. Which is precisely why we were so eager to hear more about the fascinating work [Phil Underwood] has been doing.

In his talk Open Source Caving: 20 Years of Making Cave Mapping Tools at Hackaday Europe 2026, [Phil] takes us through a series of progressively more advanced open hardware devices that he’s designed to increase the speed and accuracy of underground mapping efforts. Along the way, he’s learned a number of valuable lessons about designing hardware that’s robust enough to handle the uniquely challenging environment underground while still being accessible enough for a hobbyist to build and use.

Improving on the Old School

It’s not much of a stretch to assume that most Hackaday readers haven’t spent a lot of time crawling through underground passages, and as such, may not be immediately aware of how one begins to map a cave in the first place. Helpfully [Phil] starts off his talk by explaining the traditional process — which generally involves a compass, an inclinometer, a tape measure, and plenty of intricate notes.

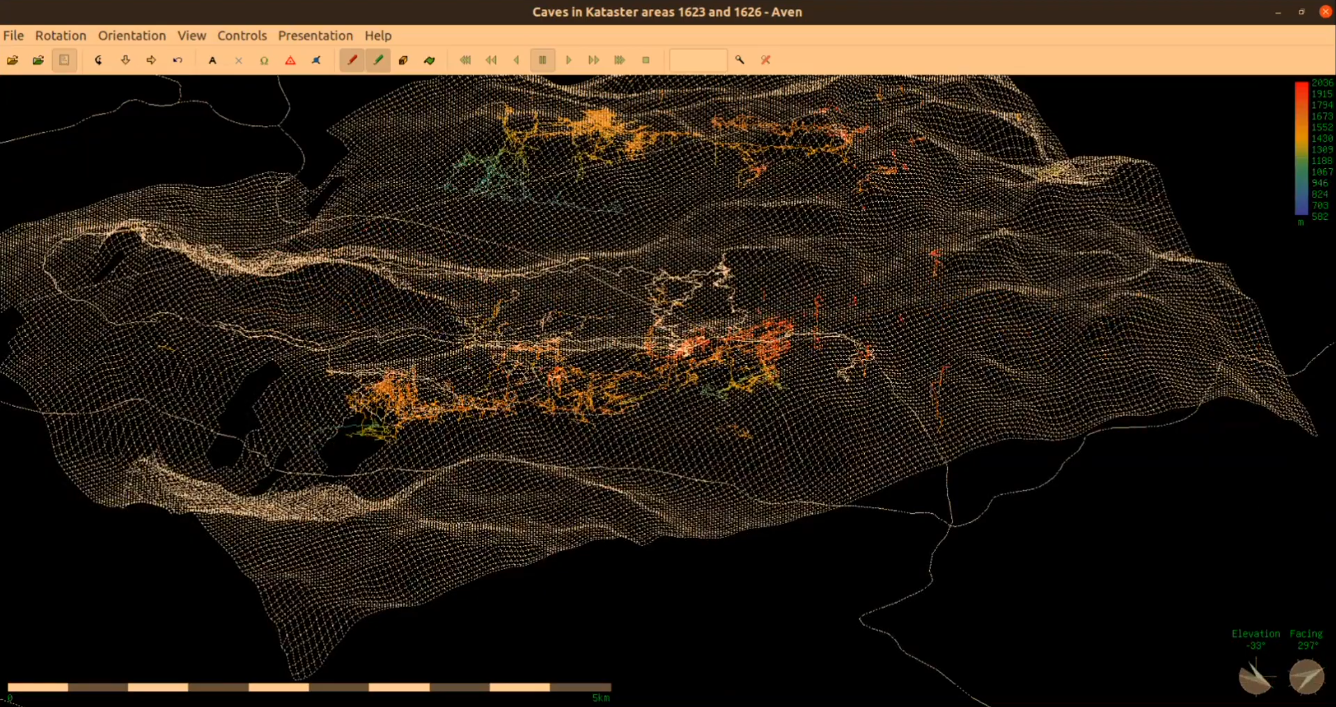
Once you’ve collected all that data and successfully returned to the surface with it, you can plug it into software and create a three dimensional map of the cave. Sprinkle in some surface topography, and you’ve got a pretty slick overview of whats above and below ground.

Like so many other cavers, [Phil] wanted a way to make that first half of the process a bit less tedious. He imagined an electronic device that could take at least some of the necessary measurements for him, but was limited by the technology and at-home production capabilities available to hobbyists in the early 2000s. There was also the cave environment to contend with: any piece of equipment used in a cave not only needs to be able to handle the dusty and cramped conditions,  but must be reasonable shock resistant. If that wasn’t tricky enough, there’s also a non-zero chance that it will need to spend some amount of time underwater.

Incremental Improvements

The first-generation of [Phil]’s surveying device. Undaunted, [Phil] put his first electronic caving aid together in 2008. Inside the off-the-shelf Radio Shack enclosure was an 8-bit PIC18LF2550, a dot-matrix display, an accelerometer, and a magnetometer. The data from the two sensors could be used to determine the heading and angle that the device was being held at, and while it still required the operator to manually take a distance measurement along that vector, having two-thirds of the information already computed saved considerable time and effort during surveys.

The first-generation of [Phil]’s surveying device.
The next big technological leap came in 2020 — not just in terms of the device itself, but in the tools [Phil] had access to. This new device utilized a 32-bit microcontroller, a 3D printed frame, and included a laser rangefinder.

Thanks to the the increased computational capabilities offered by the modern MCU, more of the necessary calculations could be done on the device itself, which further sped up the surveying process. But [Phil] notes that the data from the laser module wasn’t always reliable, and keeping the more complex device protected from the elements introduced new challenges.

Now evolving at a faster clip, by 2023 [Phil] had improved on the design with a better integrated 3D printed case, custom silicone buttons, and a more polished user interface. At this point, he also switched over to writing the device’s firmware in CircuitPython. The lower bar of entry compared to C seemed to better resonate with those in the community, and consequently [Phil] started seeing more code contributions from outsiders.

New Dimension, New Challenges

By this point [Phil] had a pretty solid handheld device to assist in performing cave surveys, but the end result was ultimately the same as if the measurements had been taken manually. Each successive generation of the hardware made the process of gathering spatial data faster and less cumbersome, but didn’t meaningfully improve the final product.

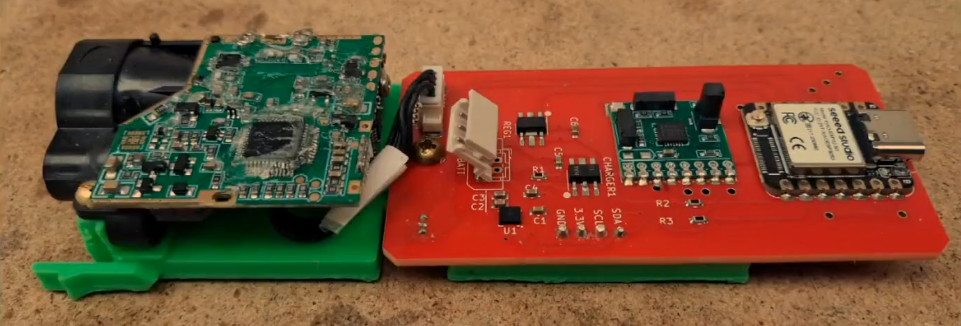
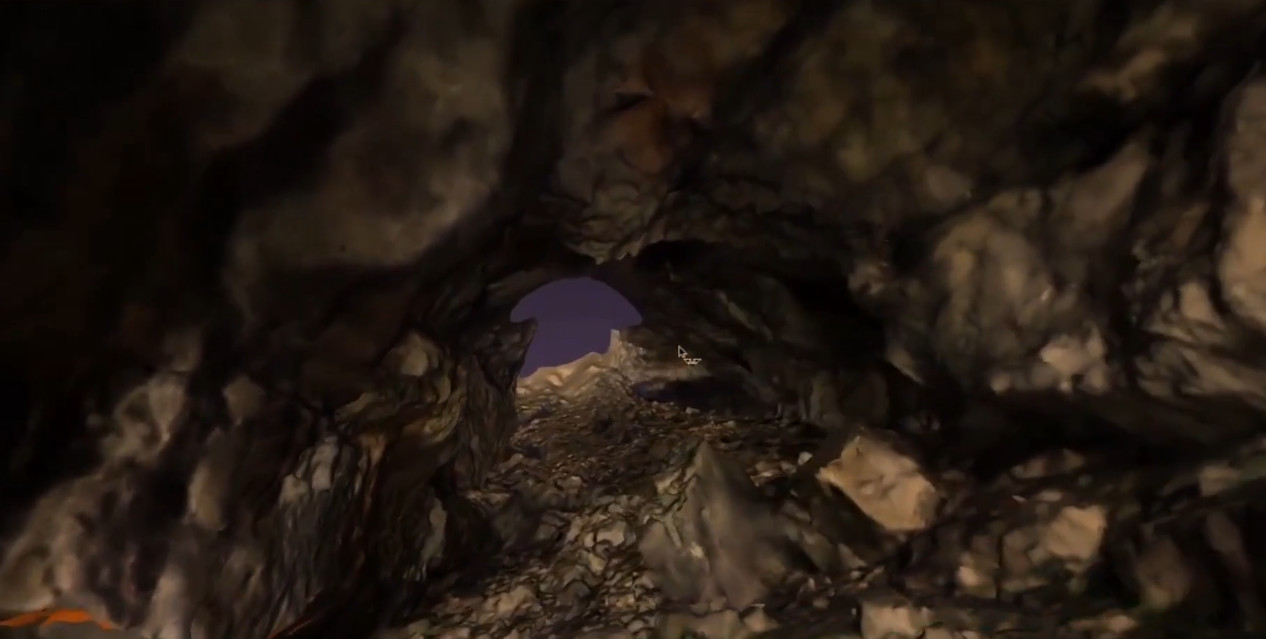
Creating higher fidelity maps would require more data and the computational power to churn through it, which is why the latest generation of [Phil]’s hardware utilizes a Raspberry Pi 5 Compute Module and a pair of low-light cameras to perform photogrammetry. When combined with the heading and angle data, this produces a textured 3D model of the inside of the cave with minimal manual effort on the part of the user.

While this latest generation of hardware is undeniably more capable than what came before it, there’s an argument to be made that it also takes a step backwards in some respects. The cameras represent a physical weak point, and [Phil] says he’s still working on an approach to more adequately handle the increased power requirements of the Pi 5 Compute Module compared to the microcontrollers used in his earlier devices. But just as with the rest of the problems faced over the last two decades, these issues will likely be resolved in time as well.

In the end, this incremental approach to hardware development may be the most valuable lesson to take away from [Phil Underwood]’s talk. It’s a safe bet that the vast majority of those who view this presentation will never find themselves exploring an underground cave system, much less mapping one. But that doesn’t mean they can’t learn from his practical and methodical approach to building the right tool for the job.

Sensing the Poles’ Hidden Heat

7 August 2026 at 00:00
Surface temperatures across Earth’s poles pulse with the seasons, as seen in this animation based on two years of data collected by NASA’s PREFIRE (Polar Radiant Energy in the Far-InfraRed Experiment) mission.
NASA/Chad Greene

At the top and bottom of the planet, the seasons arrive on a schedule all their own. Satellite data from a mission measuring infrared energy reveal just how differently—and how dramatically—surface temperatures swing across two full years at the poles.

In this animation, surface temperatures across the Arctic and Antarctic pulse between cold (dark blue) and milder to warm (lighter blue to red). Data for the animation come from NASA’s PREFIRE (Polar Radiant Energy in the Far-InfraRed Experiment) satellites. The mission’s twin CubeSats began collecting science data in July 2024 and have now captured two complete seasonal cycles at each pole.

Because the two poles sit in opposite hemispheres, their seasons occur at opposite times—and the swing between seasons differs, too. In the Arctic, cold, dark winters give way to summers warm enough to thaw vast stretches of tundra and sea ice. In Antarctica, Earth’s coldest continent, summer temperatures rarely climb above freezing before the bitter cold of winter returns.

Surface temperatures, and how they fluctuate, offer a window into Earth’s energy budget, the net flow of energy into and out of the Earth system. Sunlight absorbed by the surface is re-radiated as infrared heat, which bounces between Earth’s surface and atmosphere before escaping to space. The poles play an important role in this process. Atmospheric and ocean circulation carries excess heat absorbed in the tropics toward the poles, where it radiates away to space, helping regulate the planet’s temperature.

“By measuring invisible heat radiating from Earth’s coldest places, PREFIRE is helping scientists understand why the poles are changing so rapidly, and what those changes might mean for the rest of the planet,” said Chad Greene, a glaciologist at NASA’s Jet Propulsion Laboratory.

Scientists have long known that far-infrared radiation accounts for nearly 60 percent of the energy Earth loses to space, but that portion of the spectrum—invisible to human eyes—had never been comprehensively measured on a global scale. By directly tracking this invisible energy in near-real-time, the PREFIRE mission is helping scientists refine models and gain a better understanding of the Earth system.

“Weather systems, river flows, shipping routes, and ice sheet stability are all influenced by energy movement in a part of the spectrum that only PREFIRE can see,” said Tristan L’Ecuyer, an atmospheric scientist at the University of Wisconsin-Madison and principal investigator of the PREFIRE mission. “Now that the invisible has been made visible, we can begin to improve weather and climate predictions that industries, our national defense, and Arctic communities rely on.”

Maps courtesy of Chad Greene, NASA/JPL, using data from NASA’s PREFIRE mission. Story by Kathryn Hansen.

References & Resources

You may also be interested in:

Stay up-to-date with the latest content from NASA as we explore the universe and discover more about our home planet.

A Moonlit Earth as Seen From Artemis II

4 min read

An astronaut’s photo, taken en route to the Moon, reveals our planet and its place in space in a novel…

Article

Earthset From the Lunar Far Side

2 min read

The crew of NASA’s Artemis II mission captured extraordinary images of our home planet during their journey around the far…

Article

June 2026 Satellite Puzzler

2 min read

Your challenge is to tell us the location of the satellite image and why it is interesting.

Article

OSINT: WireTapper – Mapping Surveillance and Wireless Devices Around You

28 July 2026 at 10:06

Welcome back, aspiring cyberwarriors!

Take a second and think about how many devices are actually working around you right now. Cameras on street corners, routers sitting inside nearby homes, Bluetooth earbuds in someone’s pocket, cell towers just outside of view. All of that is happening constantly, yet almost none of it is visible to the average person walking by. If you actually wanted to check what devices were nearby today, you would probably end up jumping from one app to another, waiting for each one to load, and still walking away without the full picture. It is slow, it is frustrating, and honestly, it takes all the fun out of exploring what is really going on around you.

A lot of these devices are not just sitting there minding their own business. Many of them are built specifically to track you. A recent video on X showed this. It captured a flock camera taking several pictures of a moving vehicle, running those pictures through some kind of analysis, and then filing everything away in an indexed format.

In the screenshot above, you can see the guy picking up the signal coming straight off the camera, while the camera itself keeps emitting a steady beam of infrared. Here is the full video.

Privacy is not a crime, and you have every right to know what might be watching you. The real challenge has always been figuring out where all of these surveillance devices are hiding. That’s where WireTapper can help us. It pulls data from Wigle, Shodan, and OpenCelliD one at a time. That way, you can see every one of these devices in your area.

WireTapper

WireTapper is a wireless OSINT tool designed to discover, map, and analyze radio based devices using passive signal intelligence. WireTapper detects and correlates signals coming from all the common wireless technologies you would expect to run into. This helps you understand what devices actually exist nearby and where they are likely located all without ever having to actively intrude on anything.

WireTapper can identify leaked Wi-Fi network credentials, and it does this through a privacy-protecting k-Anonymity query scheme, meaning it can check for exposed passwords without ever exposing your own search to the outside world.

Setting Up

Let’s quickly walk through the installation process. It’s a lot simpler than it looks.

kali > git clone https://github.com/h9zdev/WireTapper.git
kali > cd WireTapper
kali > python3 -m venv venv; source venv/bin/activate
kali > pip3 install -r WireTapper.txt

Once that finishes, you will need to grab API keys from each of the services mentioned above. Do not worry too much about Shodan, since its API is paid and WireTapper will still run fine without it. There are two ways to plug these keys into the app. You can either open app.py and enter them directly, or you can use app-env.py instead, which pulls the keys in through environment variables.

After you have picked your method, we recommend also installing python-dotenv, since it makes handling those environment variables a lot smoother.

kali > pip3 install python-dotenv

Working with WireTapper

Once everything is installed, you are ready to start the app and open the web interface.

kali > python3 app.py

The web interface will be waiting for you right here: http://localhost:8080/map-w

This is the dashboard you will land on the moment you open the page. It takes a little while to load everything, so give it a few minutes before you start clicking around. Once it settles in, you can zoom into whatever area you are curious about and start picking apart what is actually hiding there.

Just keep in mind that you need valid API keys for the app to work the way it is meant to. Without them, WireTapper will simply generate dummy data so you can still see how everything normally looks inside it. On Wigle specifically, your email needs to be verified before the connection will work properly.

At the top of the dashboard, you will notice a switch that lets you jump between Wi-Fi uplink and Bluetooth scanners. That is how you filter what you are looking at.

Flip the switch back the other way, and you get the same kind of view but for Wi-Fi devices instead. This side usually includes things like cameras, routers, and other similar devices.

Exporting Results

All of these results can be exported complete with their names and coordinates, in case you decide to use them somewhere else later on.

The example above is just a taste of how those exported results are going to look. You can use this JSON file with other tools.

Summary

There is far more happening around us than most people realize. WireTapper makes it easier to visualize that activity by bringing together information about nearby wireless infrastructure in one interface. If you’re into OSINT, privacy, or wireless security, it’s a handy tool. 

OSINT is a valuable skill in many areas, especially when it comes to privacy, cybersecurity, and cyber warfare. The more you understand what information is publicly exposed, the better you can protect yourself and your digital assets. Our Ultimate OSINT Beginner training covers OPSEC, tracking, investigations, and much more across 23 lessons and 7.5 hours of video content.

We’re also hosting a live Remaining Anonymous training on August 11-13 at 3:00 PM UTC for all Subscriber and Subscriber Pro students.

The post OSINT: WireTapper – Mapping Surveillance and Wireless Devices Around You first appeared on Hackers Arise.

❌
❌