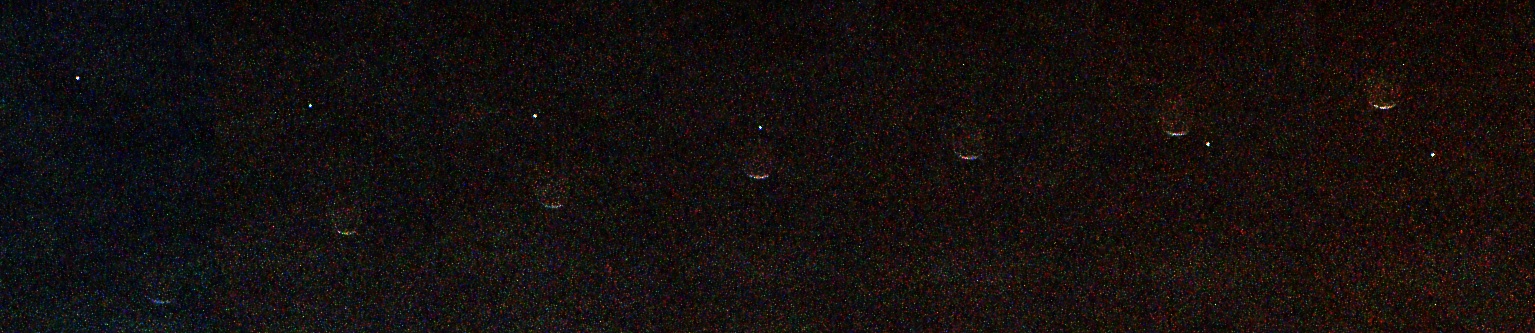
How do scientists studying space with data from a telescope hundreds of thousands of miles away know that what they are seeing is real? A new NASA project, Artifact InSPECtor, invites you to find out – and by doing so, to help missions like Euclid and NASA’s new Nancy Grace Roman Space Telescope answer fundamental questions about our universe.
“It’s really cool that we can help teach computers new skills,” said nine-year-old Maeve F. after trying out Artifact InSPECtor. Participants of all ages, including those as young as Maeve, can visit the project to learn how they can contribute to science by training artificial intelligence to remove errors in telescope data.
Here’s how it works.
The Euclid space telescope, a powerful observatory built by ESA (European Space Agency) with critical contributions from NASA, is collecting light from millions of distant galaxies across the universe. It will soon be joined by NASA’s Nancy Grace Roman Space Telescope, a complementary observatory that will capture a similar number of galaxies after it begins science operations, but at different distances and densities across the sky. Together, these telescopes promise to help scientists answer questions about the expansion of the universe and dark energy – the mysterious force causing this expansion.
To collect data to answer these questions, each telescope uses a special instrument called a spectrograph that works like a prism: it splits the light from each galaxy, even very distant ones, into a rainbow of colors. By studying these rainbow patterns, called spectra, scientists can figure out how far away each galaxy is, what kinds of stars it contains, and even information about the supermassive black holes at their centers.
But before that can happen, there’s a problem to solve.
Telescope data contains many “artifacts” – the general name scientists use for signals that come from things other than real astronomical objects like galaxies or stars. Artifacts can be created by light glinting off the telescope’s housing, cosmic rays striking the detector, quirks in the camera or electronics, or other sources. It’s a bit like when a smudge on your phone’s camera lens shows up in a photo, or when a glare from the Sun blocks part of your picture.
To find and remove these artifacts, astronomers have created artificial intelligence (AI) tools that learn to recognize them, similar to how your phone recognizes faces in photos. But recognizing artifacts in data from relatively new instruments is challenging work for the AI, which doesn’t always distinguish them accurately
That’s where you come in! As a volunteer with Artifact InSPECtor, you’ll look at real space telescope data from Euclid and, starting in early 2027, the Nancy Grace Roman Space Telescope. The project will teach you how to recognize artifacts in data from these telescopes. The work you do will then be used to improve the instructions guiding the AI tool. Working together, you, the AI, the scientists, and these powerful space telescopes will learn more than ever before about how our universe works.
If you want to teach computers new skills and help discover the mysteries of dark energy, use your smartphone, tablet, or computer to visit Artifact InSPECtor and begin today: https://go.nasa.gov/3Uyrguy.
Examples of what artifacts can look like in space telescope data. The blue areas indicate pixels that the AI model thinks are invalid. Artifact InSPECtor volunteers will learn how to verify whether the machine got it right.
Credit: Image data from the ESA/Euclid Q1 Data release. Image processing by Aimee Schechter and Bharath C. Nagam.
Learn More and Get Involved
Artifact InSPECtor
Train the tools used to remove artifacts from the data collected by space telescopes. For anyone with a smartphone or laptop.
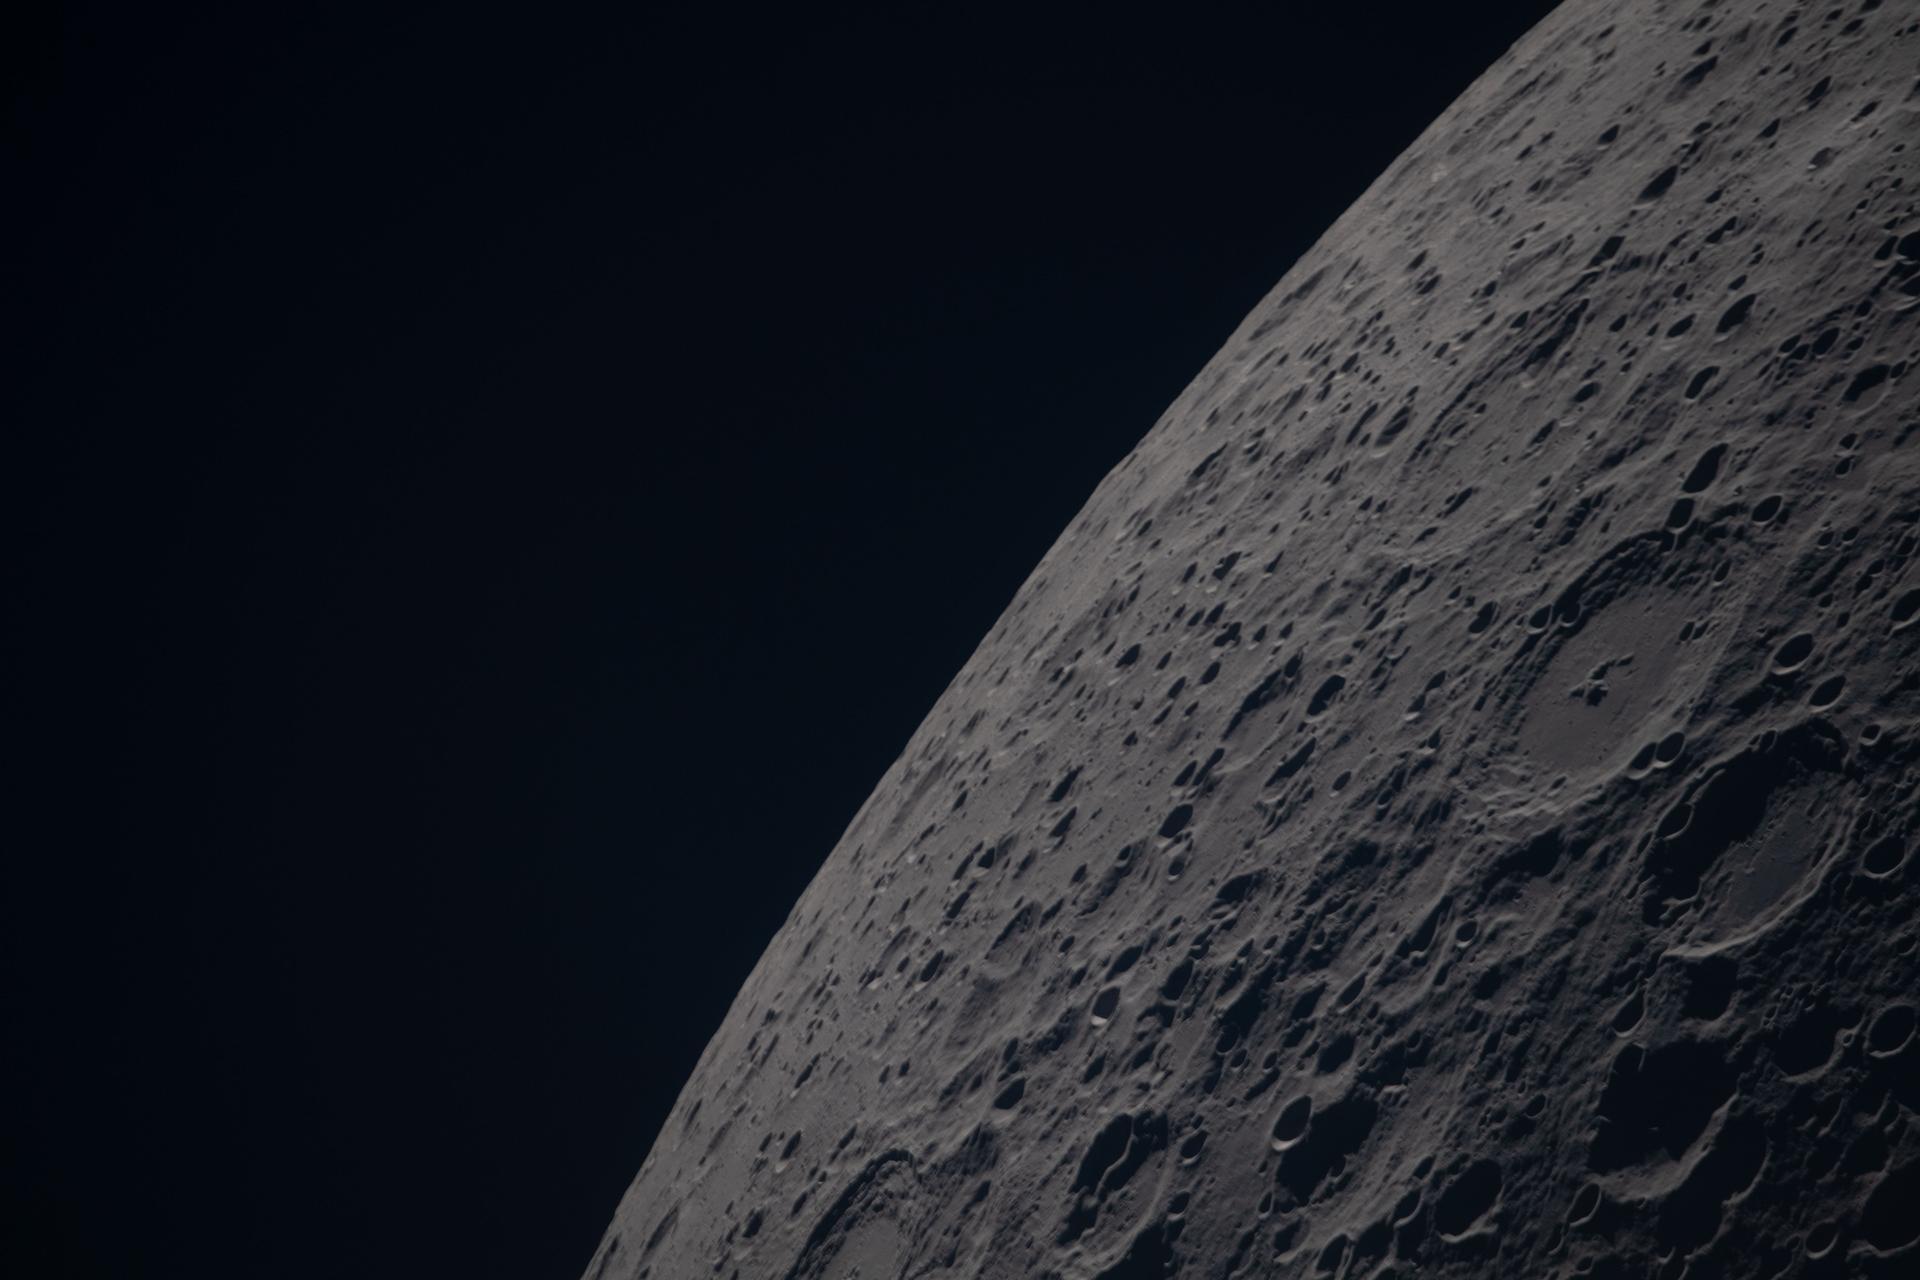
Poynting crater and Keeler crater are visible side by side in the lower right portion of this image of the Moon’s far side highlands. Poynting, positioned above, is a large impact crater with a well-defined rim and relatively smooth interior, indicative of material that has settled following the initial impact. Just below it, Keeler crater appears slightly smaller, with a sharply outlined rim and a more textured interior shaped by subsequent impacts and ejecta. Both features lie within the densely cratered far side highlands, preserving a record of ancient impacts that have shaped the lunar surface over billions of years.
NASA
The science from every Moon rock sample, lunar dataset, and discovery produced through NASA’s Artemis program will be shared by the agency with the global scientific community. That commitment is upheld by all 71 countries that have signed the Artemis Accords, a set of principles for safe and transparent civil space exploration.
NASA put those principles into practice by hosting a two-part virtual workshop series that began July 28 and concluded Sept. 8, focusing on one key tenet of the Artemis Accords: the timely release of scientific data to the public and the international scientific community.
“As we return humans to the Moon, our Artemis efforts will help us unlock the full potential of scientific discovery through transparency, collaboration, and accessibility,” said Jacob Bleacher, chief exploration scientist at NASA. “We are making data, tools, and results freely available, and inviting the Artemis Accords partners to innovate with us and share their data as well, accelerating our understanding of lunar processes and laying the groundwork for human space exploration for the Moon, Mars and beyond.”
The two recent workshops added to discussions led by the ISRO (Indian Space Research Organisation) in May, when signatories first explored ways to advance open data practices and created common ground for deeper conversations on open data. NASA split its follow‑on discussion about data sharing into two virtual sessions, so technical experts around the world could take part.
The agency hosted its first session on open science principles and implementation practices. It promoted interoperability and collaboration among signatories and advanced reproducibility, accessibility, and transparency in scientific work, including in NASA’s Artemis program.
The second session focused on tools for open science, providing Artemis Accords signatories with a working model to reference as they build or refine their own data-sharing frameworks.
“NASA is committed to leading by example when it comes to open science,” said Andrew Mitchell, deputy chief science data officer for NASA’s Science Mission Directorate, whose office leads the agency’s open science efforts. “These workshops gave our Artemis Accords partners practical tools and a shared foundation to build on as we move forward together.”
NASA presented the Planetary Data System, one of the agency’s primary archives for planetary science data, openly available lunar data, data visualization and analysis tools, and the system’s data information model standard, offering a real-world example of how NASA structures, curates, and shares scientific data with the world.
Across both sessions, NASA shared practices developed over years of stewarding scientific data and opened the floor to technical experts across the Artemis Accords community, reflecting a deliberate effort to build alignment at the working level.
“Advances in technology help enable open science, but technology alone is insufficient,” said Mitchell. “Open science requires a shift to a more transparent and collaborative scientific process, which will increase the pace and quality of scientific progress. Scientific processes and results should be as open and repeatable as possible to encourage further study.”
In 2020, NASA and the State Department joined with seven other founding nations to establish the Artemis Accords in response to the growing interest in lunar activities by both governments and private companies. They introduced the first set of practical principles aimed at enhancing the safety and coordination between like-minded nations as they explore the Moon, Mars, and beyond, committing nations to:
explore peaceably and transparently
render aid to those in need
enable access to scientific data
ensure activities do not interfere with those of others
preserve historically significant sites and artifacts by developing best practices
By signing the Artemis Accords, nations open the door to opportunities for future lunar exploration with NASA, advancing humanity’s return to the Moon, and shaping the Golden Age of space exploration and innovation.
1,000 Museum Visitors Dive Into NASA Sea Level Science on World Ocean Day
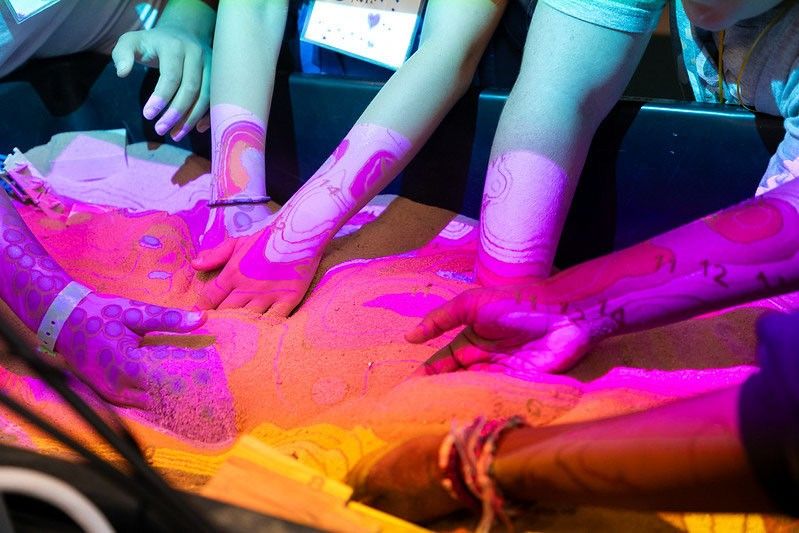
Participants reach into an augmented reality sandbox, reshaping the terrain as projected contour lines and colors illustrate topographic features and elevation changes.
University of Georgia Marine Extension and Georgia Sea Grant
More than 1,000 visitors explored NASA sea level science firsthand during World Ocean Day at the University of Georgia Aquarium on Skidaway Island on June 6, 2026. The free event was supported by NASA’s Science Activation program through the Sea Level Education, Awareness, and Literacy (SEAL) project – a national effort that connects NASA sea level rise data with educators and coastal communities, particularly those historically underserved and already experiencing sea level impacts.
SEAL is a partnership between NASA and four NOAA Sea Grant programs working together to expand sea level rise understanding across U.S. coastal regions. By co-developing lesson plans, interactive activities, and place‑based learning experiences, SEAL helps educators engage learners with real NASA observations, models, and projections while strengthening community resilience to climate change.
During World Ocean Day, SEAL partners at Marine Extension and Georgia Sea Grant and the Coastal Equity and Resiliency Hub at Georgia Tech led hands‑on activities that brought sea level science to life. Visitors played the “Tumbling Tower” game, where removing blocks represents different community impacts from rising seas, and made “sea level friendship bracelets” that used colored glass beads to represent observed sea level rise along local coastlines.
The event also marked the debut of a new augmented reality sand box developed through SEAL. Guests shaped sand into coastal landscapes and watched NASA-informed sea level rise projections transform their creations in real time. Participants could experiment with resilience strategies, such as adding dunes or relocating homes, to see how adaptations might help communities prepare for future change.
Educators – formal, informal, home-based, and more – attending the event were able to take home four different SEAL lesson plans designed for both classrooms and informal learning settings. These materials help students explore sea level rise processes, modeling, variation, and impacts through NASA data and interactive STEM activities. SEAL aims to make all lesson plans developed through the project available online, but until then, please email Shannon Matzke to request digital copies.
“World Ocean Day is an annual tradition at the UGA Aquarium,” said Shannon Matzke, Marine Educator and Public Program Coordinator at UGA Marine Extension and Georgia Sea Grant. “With the support of NASA’s Science Activation program, this year’s event was free, which allowed us to reach more people and different audiences than we typically see. Incorporating SEAL activities made the day even more impactful for visitors – many of whom live in coastal communities already experiencing the effects of sea level rise.”
The SEAL project is supported by NASA cooperative agreement award number NNH21ZDA001N-SCIACT and is part of the NASA Science Activation Program portfolio, which connects learners with authentic NASA science experiences through partnerships with educators and community organizations.
NASA’s Pandora Mission Begins Study of Exoplanets, Host Stars
Pandora, NASA’s newest exoplanet mission and the first satellite to launch through the agency’s Astrophysics Pioneers program, is now making unique observations of worlds beyond our solar system and the stars they orbit. The mission will determine the atmospheric make-up of at least 20 exoplanets, including the presence of hazes, clouds, and water.
“Pandora’s data will help close a major gap in our knowledge about planets and their host stars because, right now, we can’t be entirely sure how the star’s light affects measurements of what makes up exoplanet atmospheres,” said Elisa Quintana, Pandora’s principal investigator at NASA’s Goddard Space Flight Center in Greenbelt, Maryland. “We designed the Pandora spacecraft and its in-depth observing program to better understand this vexing issue.”
Artist’s concept of NASA’s Pandora mission, which will help scientists untangle the signals from exoplanets’ atmospheres and their stars.
NASA’s Goddard Space Flight Center/Conceptual Image Lab
The results of the mission will lay a firm foundation for interpreting measurements by NASA’s James Webb Space Telescope, as well as future observatories focused on finding habitable worlds. In fact, Pandora’s near-infrared detector is a spare originally developed for Webb.
“The spacecraft is healthy and all of the instruments are performing as well as we could have hoped,” said Jordan Karburn, Pandora’s deputy project manager at Lawrence Livermore National Laboratory in California. “Our team’s hard work throughout the commissioning process has paid off, and we can now confidently start science.”
This artist’s concept summarizes NASA’s Pandora mission and its science goals. Pandora will repeatedly observe multiple planets and their host stars in both visible and near-infrared light. These measurements will enable astronomers to separate chemical fingerprints detected in a planet’s atmosphere from potentially misleading signals originating from its host star.
Launched into low Earth orbit on Jan. 11, Pandora is an ambitious small satellite (SmallSat) funded by NASA’s Astrophysics Pioneers program. Pioneers are designed to explore compelling questions about the universe with fast-paced, low-cost missions that require a higher-than-usual tolerance for failure.
Three factors make Pandora unique. It carries a novel all-aluminum telescope about 18 inches (45 centimeters) in diameter, it will study planets and their host stars simultaneously in both visible and infrared light, and it will observe targets for a much longer time than flagship observatories like Webb are able to.
Telescopes can sample a planet’s atmosphere in systems where the planet passes in front of its star as seen from our perspective. During this event, called a transit, some starlight skims the planet’s atmosphere before making its way to us. As this light interacts with atmospheric molecules, their chemical fingerprints become embedded in it. For each molecule, astronomers see brightness dips at characteristic wavelengths.
But our instruments also see light from the whole star, not just what grazes the planet. Stellar surfaces aren’t uniform. They sport hotter, brighter areas called faculae and cooler, darker regions similar to sunspots. Both can grow, shrink, and change position as the star rotates.
“Water is one of the most important molecules we can measure to understand the composition and physical conditions of an exoplanet atmosphere,” said Benjamin Rackham, a team member at the Massachusetts Institute of Technology in Cambridge. “But features on the star can distort the water signal we’re searching for. Pandora is designed to disentangle the signals from the planet and the star, helping us to understand the planets more accurately and laying the groundwork for the eventual study of planets that could harbor life.”
Watch to learn more about NASA’s Pandora mission, which will revolutionize the study of exoplanet atmospheres. NASA’s Goddard Space Flight Center
Pandora’s telescope, jointly developed by Livermore and Corning Specialty Materials in Keene, New Hampshire, and its detectors make up the mission’s heart. The detectors will capture the star’s brightness in visible light and its near-infrared spectrum at the same time, while also obtaining a near-infrared spectrum from the planet when it transits the star. Over the course of its year-long primary mission, Pandora will observe at least 20 exoplanets 10 times with a long-duration stare covering 24 hours, with a transit included in each observation.
“Pandora’s advantage is its ability to observe targets for extended periods at multiple wavelengths, something high-demand flagship missions like Webb cannot regularly do,” said Knicole Colón, the mission’s project scientist at NASA Goddard. “Combining Pandora and Webb data will uniquely enable scientists to determine the properties of stellar surfaces and cleanly separate star and planetary signals.”
Pandora is led by NASA’s Goddard Space Flight Center. Lawrence Livermore National Laboratory provides the mission’s project management and engineering. Pandora’s telescope was manufactured by Corning and developed collaboratively with Livermore, which also developed the imaging detector assemblies, the mission’s control electronics, and all supporting thermal and mechanical subsystems. The infrared sensor was provided by NASA Goddard. Blue Canyon Technologies provided the bus, performed spacecraft assembly, integration and environmental testing, and is providing mission operations support. NASA’s Ames Research Center in California’s Silicon Valley performs the mission’s data processing. Pandora’s science data is available at the NASA Exoplanet Archive, which is operated by IPAC at the California Institute of Technology in Pasadena. The University of Arizona leads mission operations for Pandora and contributes to its science program. Many additional universities also support the science team.
To learn more about the Pandora mission, please visit:
Starstruck: NASA Research Shows How Sun’s Ancient History Shaped Earth
At the center of our solar system, the Sun influences every planet that orbits it. In two recent NASA-funded studies, scientists uncovered how ancient events in the Sun’s history may have helped create Earth’s unique climate and driven previously unexplained climatic shifts.
In new research, scientists at NASA’s SHIELD (Solar Wind with Hydrogen Ion charge Exchange and Large-Scale Dynamics) center — one of NASA’s DRIVE (Diversify, Realize, Integrate, Venture, Educate) Science Centers — trace the trajectory of the heliosphere, the massive bubble created by our Sun that envelops our solar system, as it moved through our galaxy and influenced Earth’s climate along the way. In another paper, a NASA scientist and coauthors investigate how the younger, dimmer Sun managed to heat Earth by seeding the production of potent greenhouse gases.
A Sun on the move
Over the last tens of millions of years, Earth’s climate has undergone significant shifts, including notable ice ages in which the global average temperature temporarily dropped by several degrees. During these periods, more frequent climate swings led Earth to warm and cool. To explain these periods of warming and cooling, scientists looked to factors internal to Earth, including orbital changes, greenhouse gases, and ice. But new research suggests changes to the Sun’s environment may be key to understanding Earth’s temperature swings.
Just as our planet is encased by an atmosphere, so our entire solar system is encased inside a kind of “atmosphere” created by the Sun. This protective bubble, known as the heliosphere, is formed by a continuous solar wind of charged particles streaming out from the Sun in all directions.
This conceptual animation begins with a view of the Milky Way Galaxy. As we zoom in, we travel to the Local Interstellar Cloud, and then to the heliosphere, the protective bubble that surrounds our solar system. The heliosphere is formed by a continuous stream of charged particles from the Sun, called the solar wind.
NASA’s Goddard Space Flight Center Conceptual Image Lab
Our heliosphere orbits around the center of our galaxy, the Milky Way. Throughout the Sun’s 4.6-billion-year existence, our heliosphere has traversed various regions within our galaxy. In a paper published on Aug. 21 in Annual Review of Astronomy and Astrophysics, researchers at NASA’s SHIELD used computer modeling to reverse-engineer the path of the heliosphere through our galaxy, revealing that the environments it passed through may have triggered changes on Earth.
Merav Opher, SHIELD’s principal investigator at Boston University, and her team ran simulations that showed the Sun has encountered frigid expanses of gas and dust at least three different times in the past few million years. In these instances, massive interstellar “cold clouds” pushed against the heliosphere to such an extent that it shrank to smaller than Earth’s orbit, stranding our planet outside the Sun’s protective shield.
These exposures — approximately 2 to 3 million years, 6 to 7 million years, and 13 to 14 million years ago — would have exposed Earth’s atmosphere to totally different surroundings. The simulation results match geologic evidence: Elements prevalent in interstellar dust appear in deep-sea sediment core samples, Antarctic snow, and lunar samples during these timelines.
This animated illustration shows Earth and the Sun protected by the heliosphere, the massive bubble created by our Sun. As our solar system traverses through the galaxy, encounters with massive interstellar “cold clouds” pushed against the heliosphere and caused the heliosphere to shrink past Earth, exposing the planet to cosmic radiation and elements from interstellar space.
NASA’s SHIELD DRIVE Science Center/Merav Opher/Harvard Radcliffe Institute
These heliosphere collapse events may also explain ancient climatic patterns on Earth. In the simulations, when Earth’s atmosphere was exposed to a cold, dense galactic hydrogen cloud, it increased water vapor content and shifted upper-atmospheric dynamics, ultimately altering the conditions at the surface. In summary, our heliosphere’s trips through colder regions in our galaxy may be a key factor in driving some of Earth’s ancient changes in climate, including possible ice ages.
Next frontier in studying heliophysics
The SHIELD center is one of several that NASA funds to unlock the next generation of heliospheric research. As a DRIVE Science Center, SHIELD builds a team of researchers with differing expertise, approaches, and opinions to develop a model, or “digital twin,” of the heliosphere that helps reveal how the heliosphere interacts with its surroundings, including dense interstellar clouds. Understanding our unique, habitable solar system will help unravel the mysteries of life’s evolution on Earth and potentially uncover other habitable star systems.
Young Sun
In another paper, Vladimir Airapetian, a scientist at NASA’s Goddard Space Flight Center in Greenbelt, Maryland, focuses on a long-standing mystery of how the ancient Sun warmed early Earth enough to sustain life. Three billion years ago, the young Sun was 70% as bright as it is today. Under these dimmer conditions, Earth should have been frozen solid. Yet geological evidence shows stable liquid water already existed long before that. This puzzle — a balmy Earth under a cooler, dimmer Sun — is known as the Faint Young Sun paradox.
One clue to resolving the paradox comes from young Sun-like stars elsewhere in the galaxy. These “toddler” stars are prone to throwing fits. Specifically, data from NASA’s retired Kepler space telescope shows that young Sun-like stars regularly erupt with massive superflares, flinging high-energy particles in all directions on a daily basis. If our young Sun was like these other stars, Airapetian proposes, the barrage of high-energy solar particles could have triggered chemical reactions that were key to warming early Earth.
Airapetian’s team simulated early Earth’s atmosphere in a sealed chamber, mixing molecular nitrogen, ammonia, carbon dioxide, and carbon monoxide. They then fired protons into the mixture, simulating the onslaught of particles from superflares. This proton bombardment triggered several changes including the production of nitrous oxide, a greenhouse gas 300 times more potent than carbon dioxide. The research was published in Astrophysical Journal Letters.
This nitrous oxide could help Earth hold onto heat. But not all the nitrous oxide would last. The young Sun’s intense ultraviolet radiation would break some of it down, splitting the molecule back into nitrogen and oxygen. But even if only 10% of the nitrous observed in the experiment survived, Airapetian’s team’s computer simulations confirmed, it would still warm Earth’s equatorial regions to about 41 degrees Fahrenheit (5 degrees Celsius), above water’s freezing point. This smaller amount of nitrous could even accelerate prebiotic synthesis: just-above-freezing temperatures have been found to be more efficient for building complex chains of amino acids than warmer temperatures.
Unearthing secrets of our star-planet system
Together, these two studies show that the Sun can lead to surprising implications for Earth. While our planet stands alone in many ways, it was formed and has always existed as part of a star-planet system. Understanding that unique relationship promises new insights about both Earth and the star that sustains it.
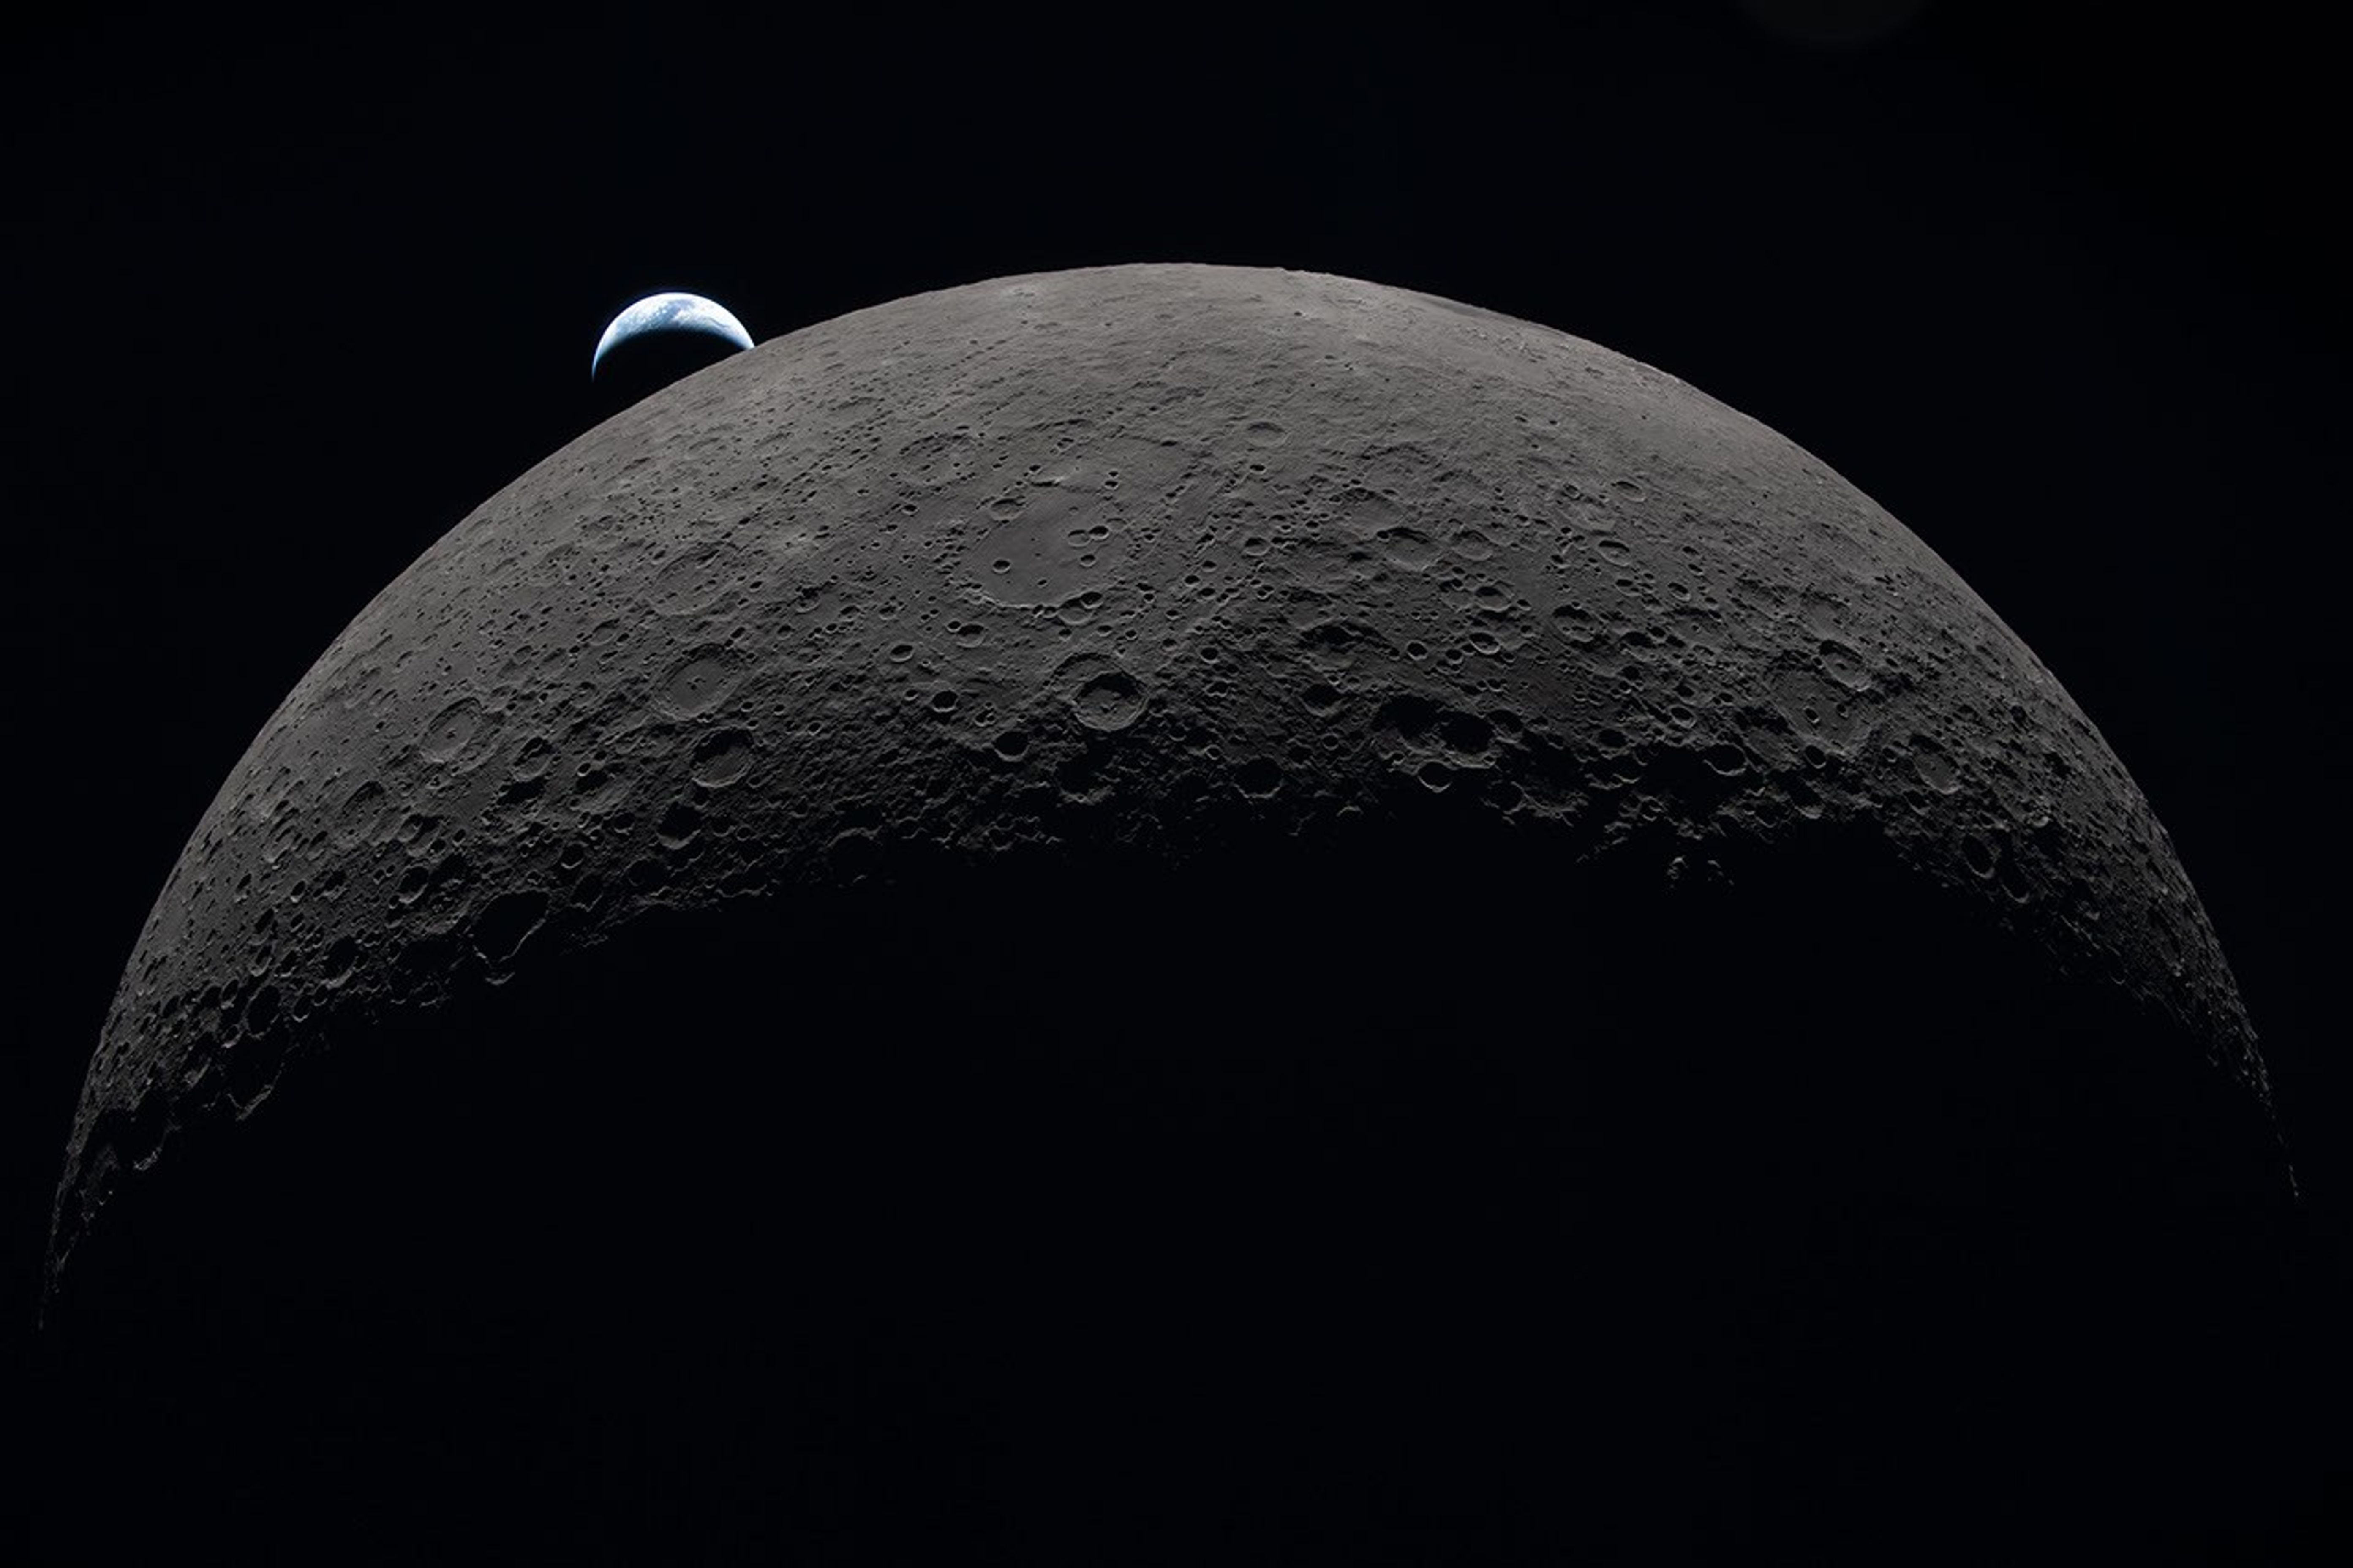
This image was taken by an Artemis II astronaut from the Orion capsule in April 2026, as the spacecraft traveled past the Moon and back over 10 days. The gray-brown, heavily cratered Moon dominates the frame against black space, with a partially lit crescent Earth setting behind its upper-left edge.
Some of Earth’s microbes likely to hitch a ride to space with human explorers could survive in the shaded nooks and crannies of the Moon’s South Pole region, NASA scientists say.
Published on Aug. 19, 2026, in Science Advances, these findings highlight a need to better understand microbial persistence in extreme lunar environments. As humans build a permanent presence on the Moon, it may become difficult to distinguish ancient lunar chemistry from contamination delivered by visiting astronauts. The concern extends beyond the Moon and on to Mars, scientists say.
“Humans are natural explorers, and with them come their voices, their memories … and their microbes,” said Prabal Saxena, a planetary scientist who led the study from NASA’s Goddard Space Flight Center in Greenbelt, Maryland. “For some scientists, myself included, that reality can be unsettling. But it also creates an opportunity to turn an imperfect situation into a useful experiment.”
Bringing microbes along is unavoidable: Humans have, on average, 1 million bacteria living on each patch of skin the size of a pencil eraser, for example. These bacteria vent from spacesuits and habitats. Though the paper’s authors worry about contamination interfering with the search for chemical clues to ancient geology or biology, they also argue that the Moon should be used as a natural lab. In shaded areas around the South Pole, scientists could carefully test the real-life limits of microbial survival in an environment that can’t easily be reproduced on Earth.
The Apollo program landed six pairs of astronauts on the Moon between 1969 and 1972. All six landing sites are near the lunar equator. In this visualization, the Apollo sites are contrasted with the South Pole, an area with enormous potential for future exploration. Time passes as we zoom toward Shackleton crater at the South Pole, revealing illumination conditions quite different from those near the equator. While many craters remain in permanent shadow, some nearby mountains and ridges are in persistent sunshine, making them attractive candidates for solar power and long-term habitation.
Before any surface science can happen, scientists need a baseline measurement of what contaminants humans bring, the authors say.
“We need to understand what was there before us, because when we go to Mars to search for signs of life beyond our planet, we will want to make sure it’s not stuff we brought,” said Andrew Needham, a NASA Goddard-based paper co-author who is an Artemis contamination‑control scientist for lunar samples.
Even with strict sterilization procedures, some organisms are stubbornly resilient. A good example is Aspergillus niger, which is a fungus that thrives in warm, damp places like household bathrooms and heating, ventilation, and air conditioning systems. Astronauts have sampled it inside the International Space Station, and experiments demonstrate that the fungus can survive outside the station as well. Aspergillus niger was one of five microbes, including bacteria and fungi, selected for this study because of its known toughness in spaceflight environments.
That microbes survived on the space station’s exterior surprised scientists. These species are typically not considered “extremophiles” that can withstand harsh conditions, such as the vacuum of space, according to Aaron Regberg, a geomicrobiologist at NASA’s Johnson Space Center in Houston.
“I would have expected these microbes to have dried out,” said Regberg, who studies space station bacteria and was a co-author on the paper.
NASA astronaut Kate Rubins on Oct. 14, 2016, collecting microbes in the Japanese Experiment Module aboard the International Space Station.
JAXA/Takuya Onishi
He pointed out that NASA often bakes robotic spacecraft at temperatures above 400 degrees Fahrenheit to reduce the number of living organisms on them. But that’s not possible with astronauts, so contamination concerns take on new meaning in crewed exploration of the Moon’s south polar environment.
A clearer picture of where microbes might survive comes from understanding how sunlight behaves at the poles. Survival in this study means the microbe can stay alive for at least one Earth day, which does not mean that it can grow and reproduce.
Because the Moon has a very small tilt on its axis, the view from its poles is of a Sun that appears to hover just above the horizon, skimming the surface like a flashlight laying on a table. As a result, elevated parts of the surface, including crater ridges, mountains, and even small bumps, block light from reaching low-lying terrain. This produces pockets of shadowed areas that can remain cold and preserve water, as well as shield fragile molecules and possible microorganisms from lethal radiation.
With that scientific context in mind, the team set out to test which Earth microbes could survive extreme polar conditions. They focused on organisms commonly found in spaceflight environments and those common on human skin. Besides Aspergillus niger, these included Bacillus subtilis, Staphylococcus aureus, Deinococcus radiodurans, and several species of Fusarium. Based on an analysis of previous studies, the scientists noted the maximum amount of heat and ultraviolet (UV) radiation each organism can withstand.
Then, the organisms were tested in simulations of three regions near the lunar South Pole — Nobile Rim, Connecting Ridge, and De Gerlache Rim. Those simulations used detailed environmental maps built from elevation and temperature data collected by instruments aboard NASA’s Lunar Reconnaissance Orbiter, combined with models of how radiation strikes the surface.
The models showed maps of “survivable niches” that range in size from a miles-wide crater floor to an astronaut’s boot print. Aspergillus niger, which was most resistant to UV radiation, was able to survive even in areas with some sunlight exposure. UV radiation is so deadly to most microbes that it’s used for sterilization in hospitals.
“When we think of the Moon, we don’t typically think of biology,” said Heather Graham, a paper co-author at NASA Goddard who helps develop tools and techniques for detecting biology that may look nothing like Earth’s. “But the Moon is a place where a cell can survive, so our first exploration of these sites should pay extra attention to our microbial hitchhikers and work hard to characterize lunar chemistry before our visits change what we will find.”
The authors note that while some microbes can survive in a dormant state in regions around the South Pole, and thereby confuse some future scientific investigations, there is no evidence the Moon has key ingredients to sustain growth and replication. Such ingredients include liquid water, which typically requires an atmosphere and moderate temperatures.
International Observe the Moon Night, Sept. 19, 2026
Each year, observers around the world come together to celebrate Earth’s Moon through direct observations, hands-on activities, lunar-themed music, artwork, readings, and more.
The Moon
From lighting up our skies to preserving evidence of our solar system’s history, Earth’s closest neighbor plays a pivotal role in the study of our planet and beyond.
About the Author
Lonnie Shekhtman
Senior Science Writer
Shekhtman helps communicate NASA planetary science to the world through news and feature stories on NASA.gov, videos for NASA+ and YouTube, and by working with the media. She reports on lunar and Mars science and exploration; NASA’s search for life; missions to Venus, Titan, and Jupiter’s Trojan asteroids; and many other topics related to NASA’s exploration of our solar system and beyond.
NASA’s LRO Images Falcon 9 Crater on Moon, Learns New Details
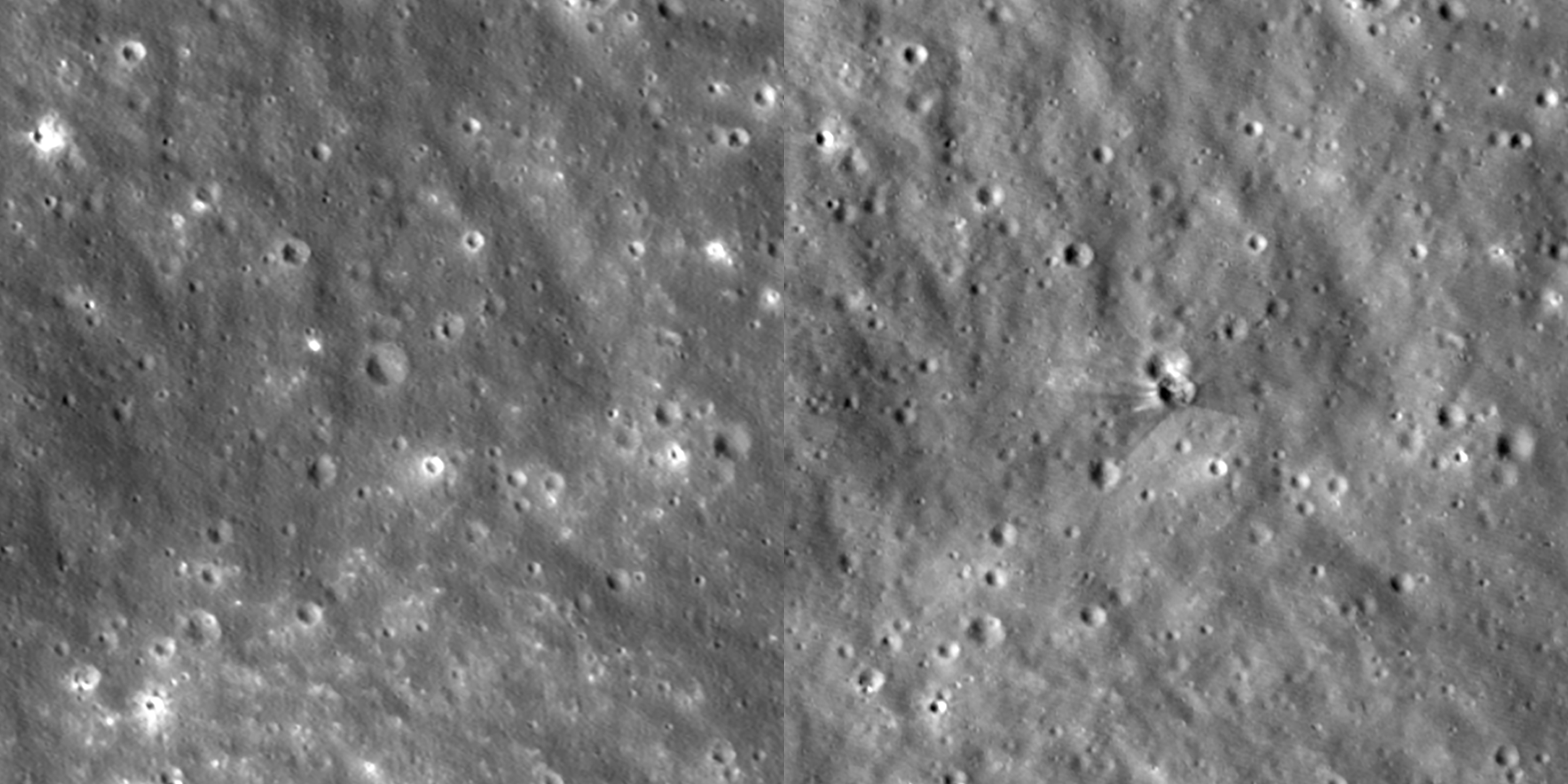
This is an animated before-and-after view of the crater formed after a Falcon 9 upper stage struck the Moon’s surface on Aug. 5, 2026. These images were taken between Aug. 11 and 12 by the Narrow-Angle Camera on NASA’s Lunar Reconnaissance Orbiter. These images are enlarged three times from the original, with north facing up, and they cover an area about a quarter of a mile wide.
NASA Goddard/Intuitive Machines
Between Aug. 11 and 12, NASA’s Lunar Reconnaissance Orbiter (LRO) captured a series of images of a new crater on the Moon. The crater formed on Aug. 5, when a SpaceX Falcon 9 upper stage impacted the surface following its January 2025 launch of the Firefly Blue Ghost 1 mission.
To capture imagery of the impact, engineers tilted the spacecraft so its cameras would point toward the crater each time LRO passed about 60 miles above the Moon, traveling 1 mile per second. The orbiter circles the Moon from pole to pole every two hours, while the Moon slowly rotates underneath it. To photograph a specific spot, the spacecraft must wait until that location turns into view, which took six days in this case.
Getting the pointing right was only half the challenge; timing had to be accurate as well. If the camera snapped even 10 seconds too early or too late, the target would drift off-center by 10 miles.
An artist concept video showing NASA’s Lunar Reconnaissance Orbiter circling the Moon.
NASA’s Goddard Space Flight Center Conceptual Image Lab
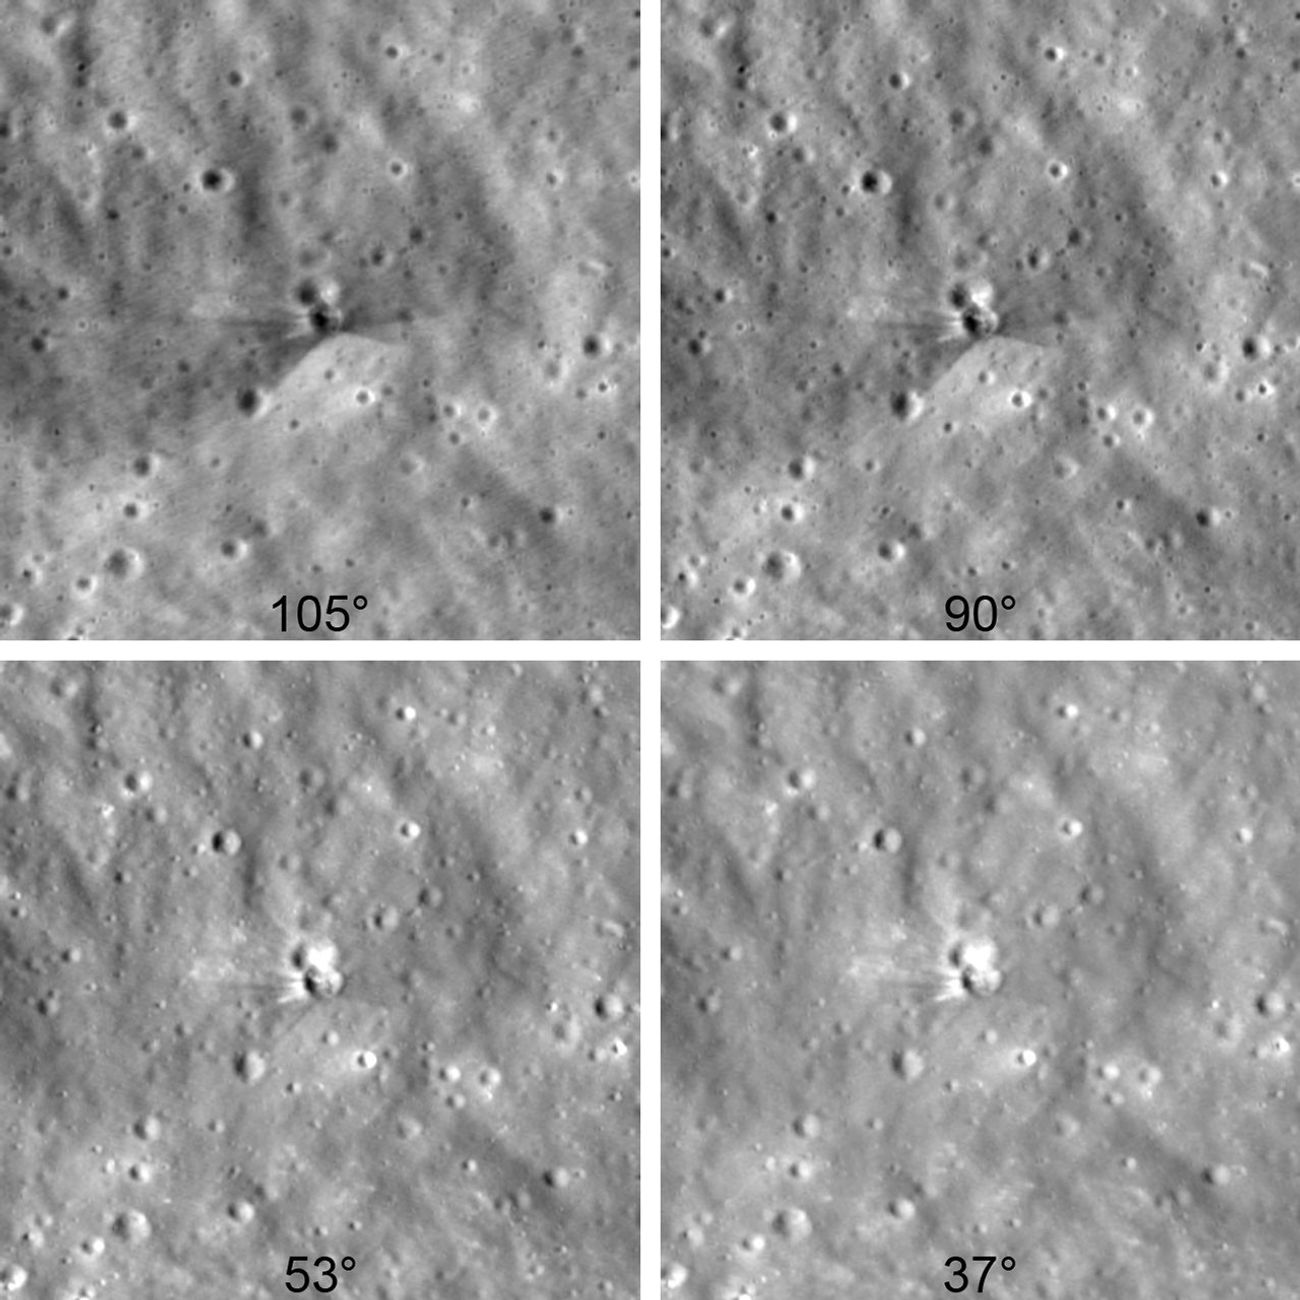
Because of the variety of viewing angles, scientists could see the crater under multiple lighting conditions that revealed unique features. In images where the crater rim stood out, scientists measured its 60‑foot width. Scientists also determined the crater is less than 10 feet deep based on the length of its shadow.
To capture these details, LRO used its Narrow-Angle Camera, which can spot features as small as 3 feet wide.
Collected between Aug. 11 and 12 by NASA’s Lunar Reconnaissance Orbiter, six days after a Falcon 9 upper-stage booster impacted the Moon, these images were taken from different viewing angles, bringing out different features. The darker area that fans around the crater in the upper-left image is rougher than the surroundings, as this surface material has been altered over a long time by solar wind, galactic cosmic rays, and micrometeorite impacts. The brighter rays and splotch above the crater in the lower-right image is fresher material that was excavated from deeper below the surface. The pictures are arranged in the order they were taken, starting at the top left and moving toward the bottom right, with the lighting angle from the Sun gradually changing from one image to the next. Each image is enlarged two times and shows an area of the Moon about 1,000 feet wide.
NASA Goddard/Intuitive Machines
The images above show bright and dark rays stretching out from the crater. The darker streaks are made of surface dust and rocks altered over a long time by solar wind, galactic cosmic rays, and micrometeorite impacts. This weathered material was excavated by the collision from 1.5 feet into the lunar surface. The brighter streaks near the crater rim are made of fresh material excavated from deeper underground.
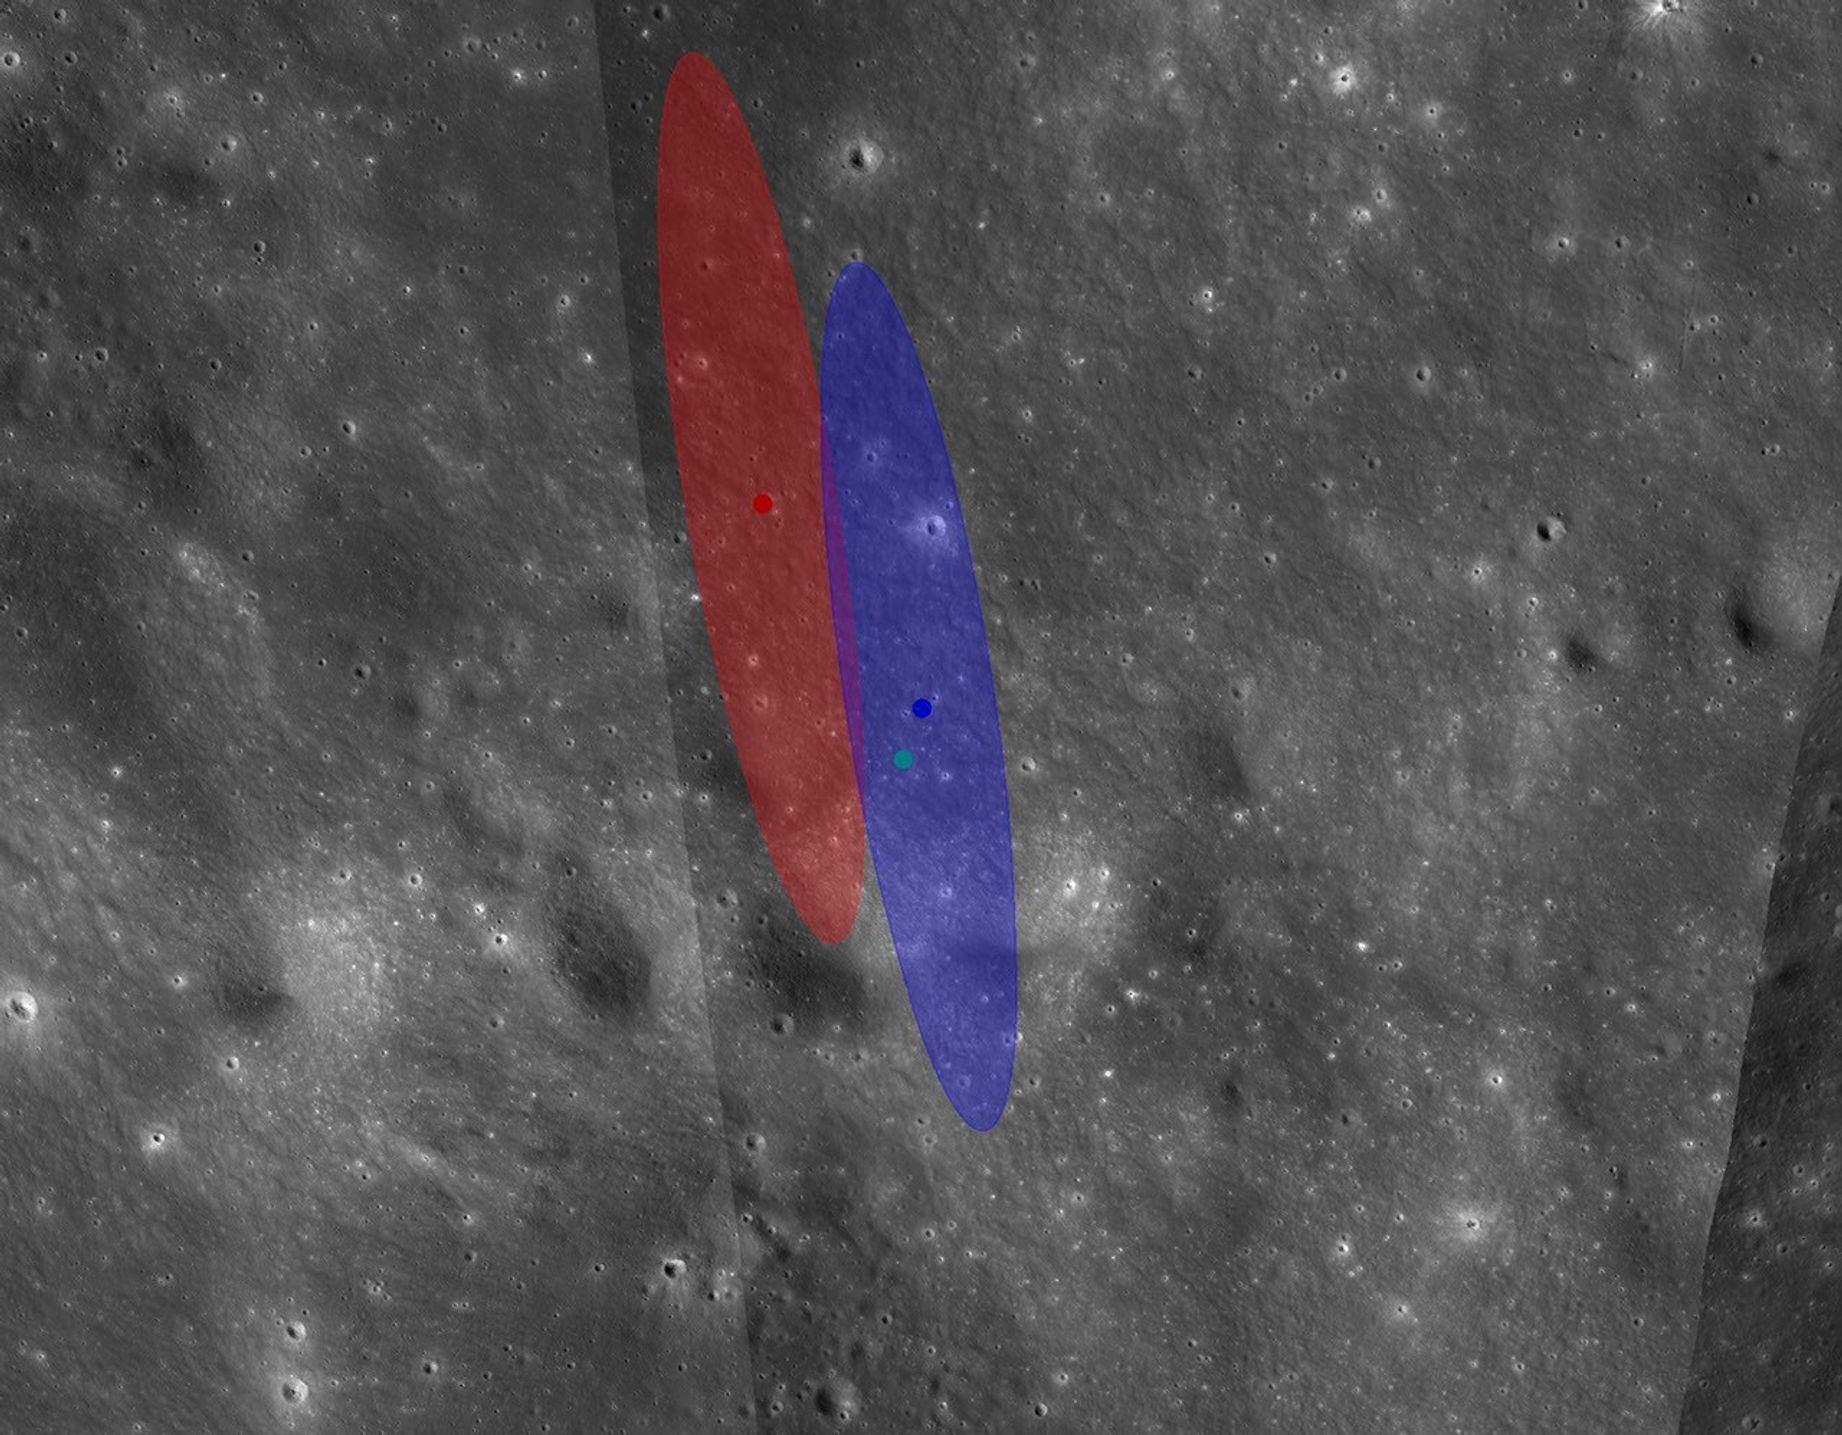
This image from NASA’s Lunar Reconnaissance Orbiter shows two oval regions where the Falcon 9 upper stage was likely to impact the Moon, based on calculations by engineers with NASA’s Center for Near Earth Object Studies. Both ellipses are 2.1 miles long and 0.4 miles wide. Both predictions use the same booster-trajectory calculations, but only the blue ellipse takes into account the lunar terrain. The red and blue dots show predicted impact locations, whereas the cyan dot shows the actual impact site.
NASA/JPL-Caltech
Finding the impact site took global coordination among experts and hobbyists. Independent astronomers first identified the rocket’s trajectory using publicly available data. NASA’s Center for Near Earth Object Studies, which tracks natural objects that could pose hazards to Earth for the agency’s Planetary Defense program, used this opportunity to test and validate tools and techniques for predicting impacts.
Based at NASA’s Jet Propulsion Laboratory in Southern California, the center incrementally refined the trajectory until identifying the location of impact, which it provided to the Republic of Korea for their Korea Pathfinder Lunar Orbiter (Danuri) team. The team used the high-resolution LUTI camera on Danuri a few hours later to image the crater, finding the prediction was accurate to about 0.6 miles.
After capturing images of the crater, the Danuri mission sent coordinates to NASA’s LRO team to help refine their follow-up imaging sequence. Comparing their new crater images with the pre-impact images, the LRO team updated the crater center coordinates: 19.4759°N, 266.7138°E, 511 meters elevation.
Preparations for Next Moonwalk Simulations Underway (and Underwater)
A busy street in Addis Ababa, Ethiopia’s capital, which is the subject of NASA-led air quality research.
Ninaras (CC BY-SA 4.0)
A NASA-funded air pollution monitoring network has provided one of the most detailed long-term views yet of the role of black carbon, or soot produced by fires, diesel vehicles, and other combustion sources, in Ethiopia’s capital, Addis Ababa. The detailed measurements show how pollution changes by time of day and season, including increases associated with rush-hour traffic and holiday celebrations. The findings are relevant to cities around the world, including in the United States.
In a new paper published in ES&T: Air, scientists analyzed data collected throughout Addis Ababa between 2022 and 2025 from 10 air-quality monitoring sites deployed by NASA’s Multi-Angle Imager for Aerosols (MAIA) project.
The research comes as Ethiopia is taking steps aimed at improving air quality. In 2024, the country became the first in the world to ban the import of internal combustion engine vehicles, while cities have been adding bike lanes and electric vehicle infrastructure. The MAIA project’s measurements provide researchers with a baseline for understanding how air quality changes over time as Addis Ababa continues to grow and evolve.
The study focuses on particulate matter that is 2.5 micrometers or less in diameter, also known as PM2.5. The 2025 State of Global Air Report, cited in the paper, estimates that exposure to PM2.5 is associated with approximately 4.9 million deaths globally each year. Among the many kinds of PM2.5, black carbon has been has been studied for its potential effects on human health.
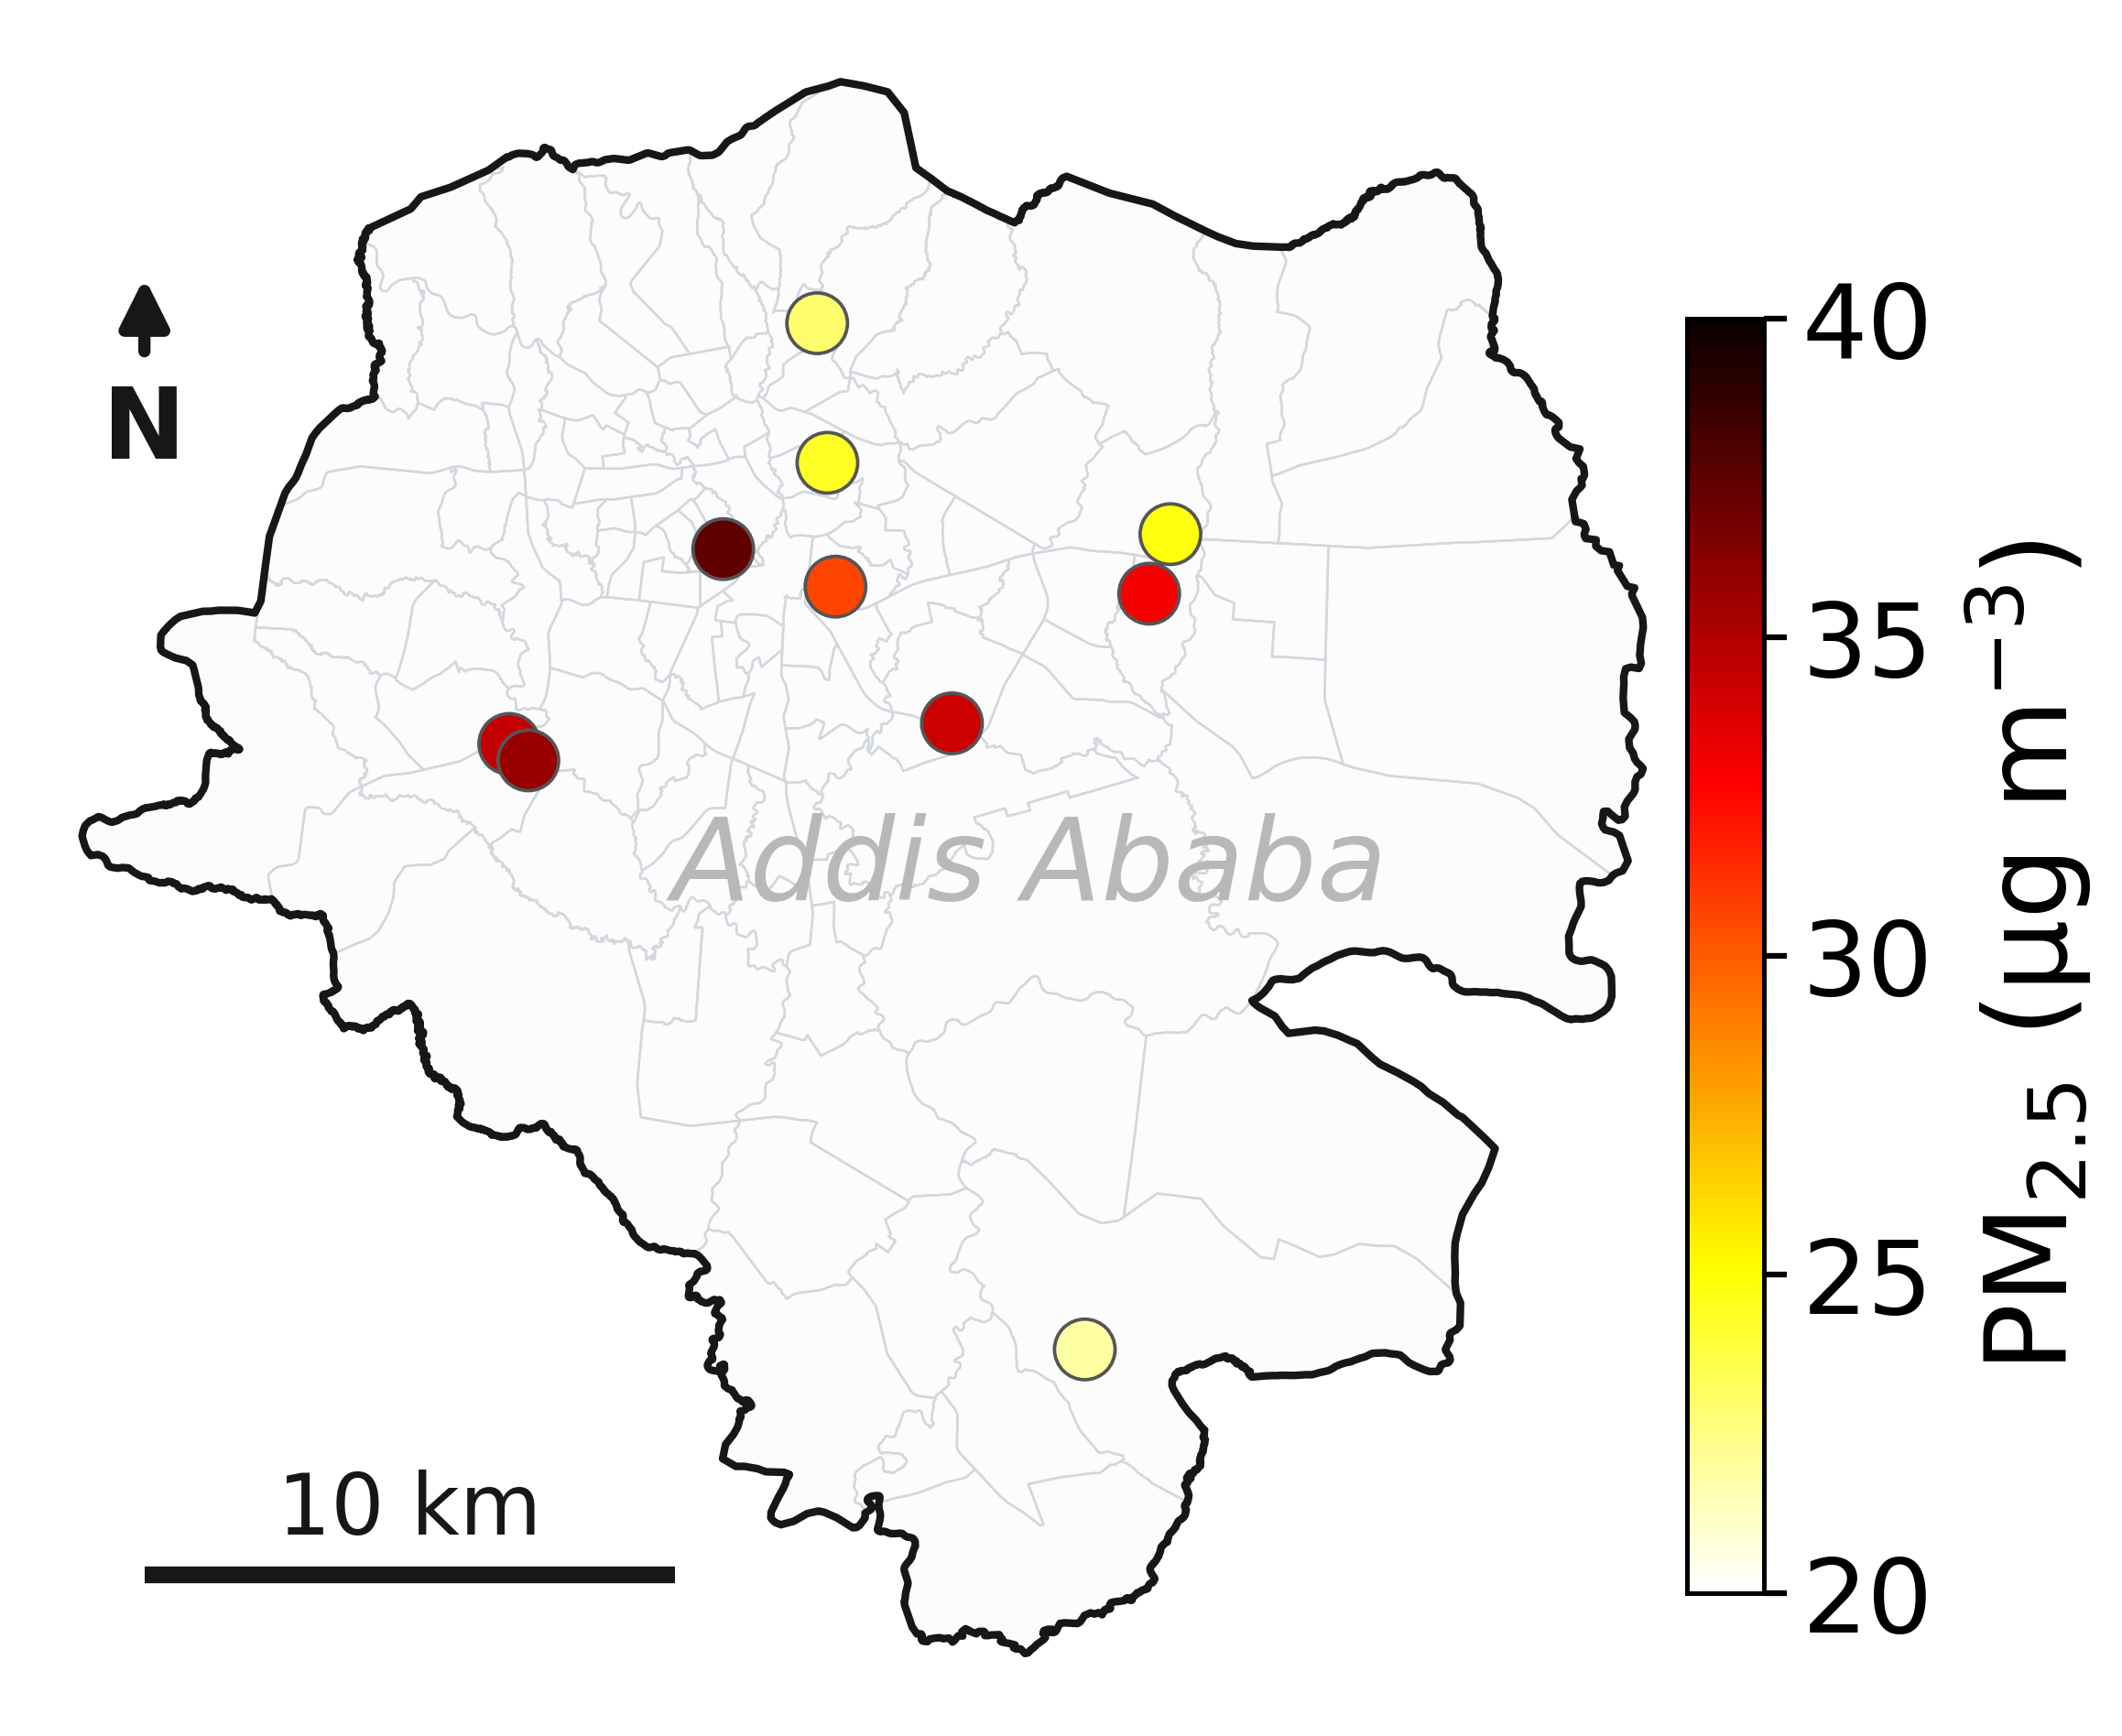
The paper found that Addis Ababa’s three-year average PM2.5 concentration was 30 micrograms per cubic meter, which is more than three times the level of the U.S. Environmental Protection Agency’s health-based annual PM2.5 standard. The new paper cites data from MAIA’s ground sensors indicating that average black carbon levels in Addis Ababa were approximately four to nine times higher than those measured in the three U.S. metropolitan areas the mission is monitoring.
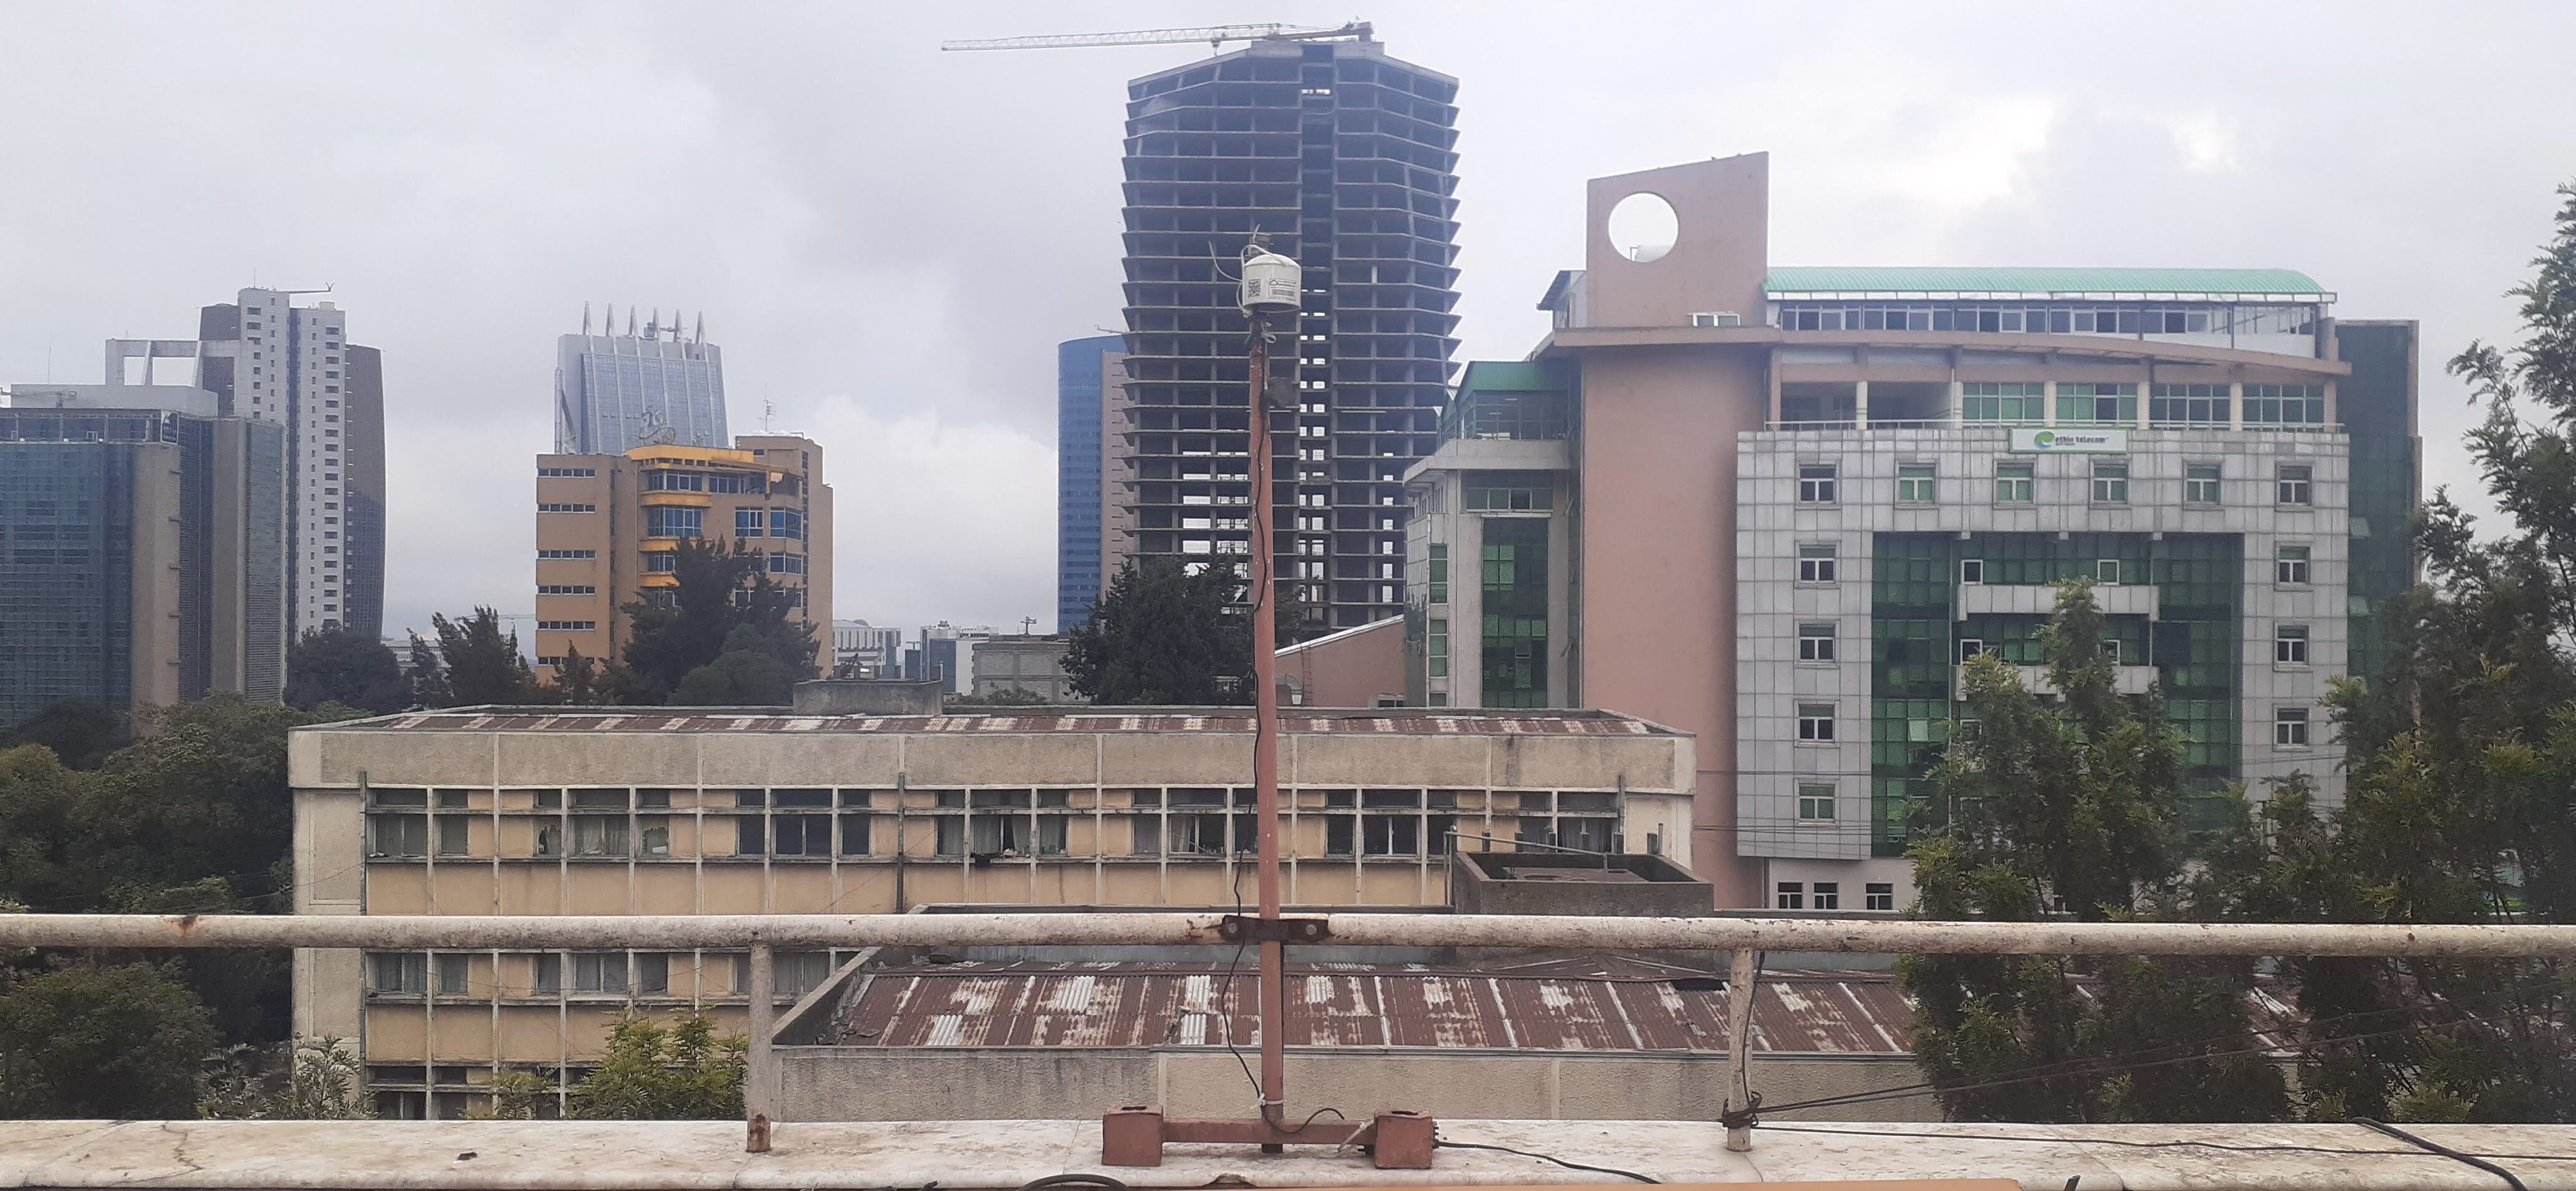
This roof-mounted air sensor in Addis Ababa, the capital of Ethiopia, is one of 10 used by NASA’s MAIA mission to study the city’s air quality. MAIA’s air sensors provide a detailed look at PM2.5, one of the world’s deadliest forms of air pollution.
NASA/JPL-Caltech
“To our knowledge, this is the first long-term, multisite study of continuous PM2.5 and black carbon measurements in Ethiopia,” said Sina Hasheminassab, a coauthor of the paper and MAIA’s deputy principal investigator at NASA’s Jet Propulsion Laboratory in Southern California. “Many rapidly growing cities have limited long-term monitoring, so these measurements provide an important baseline for understanding how pollution changes across space and time.”
The composition and sources of PM2.5 can differ substantially between cities, depending on their local geography, traffic, industries, and more. Desert cities, for example, may have more dust, while those near coal-fired power plants may have higher concentrations of sulfate. Long-term surface measurements remain limited in many parts of the world.
NASA is supporting MAIA’s air pollution research in a dozen metropolitan areas around the globe, including three in the U.S.: Los Angeles, Atlanta, and Boston. The mission consists of a ground-based network of sensors already in operation as well as a space observatory, which uses a JPL-built camera that will be launched by the Italian Space Agency (ASI) on an ASI satellite no earlier than late 2027.
The camera is designed to identify different types of PM2.5 aerosols based on how they reflect light, making it possible to map particle concentrations over each city that the mission studies. Mounted on a gimbal, the camera captures data from multiple angles using JPL-pioneered technologies that make particles stand out more prominently against the surface background to provide valuable information about their shape and size.
The MAIA mission is the first NASA project to include public health researchers among a space mission’s team. These researchers will use MAIA’s PM2.5 concentration maps alongside health data to study potential relationships between different particle types and health outcomes. By developing a better understanding of particulate matter pollution, researchers can potentially advance how air quality is studied and managed.
“This paper shows how valuable the air sensor data is on its own, but combining the sensor network and satellite observations will be a game-changer,” said, Kyan Shlipak, the paper’s lead author, who worked on the research while interning at JPL.
Tracking black carbon
The greater Addis Ababa urban area is home to nearly 6 million people, and according to United Nations projections, that figure is expected to surpass 10 million by 2050.
This map of Addis Ababa, the capital of Ethiopia, shows the locations of 10 air sensors that NASA’s MAIA mission is using to provide one of the most detailed looks ever at the city’s air pollution.
NASA/JPL-Caltech
“It’s a cosmopolitan city with many international communities,” said Araya Asfaw of Addis Ababa University, a coauthor of the paper and the MAIA project’s lead Ethiopian collaborator. “Think of it as Africa’s version of Brussels, where the European Union is based.”
“Even at night, when traffic dies down, you see high emissions from the burning of charcoal and other fuels,” Asfaw said.
The MAIA sensor network detected increases in black carbon during two major holidays in Addis Ababa that involve bonfires and was able to distinguish between particles originating from the fires and those from fossil fuel combustion. The findings demonstrate how detailed measurements can help researchers identify different sources of particulate matter and better understand how air quality varies across a city and over time.
Next Generation of Planetary Scientists Learn Public Engagement Skills
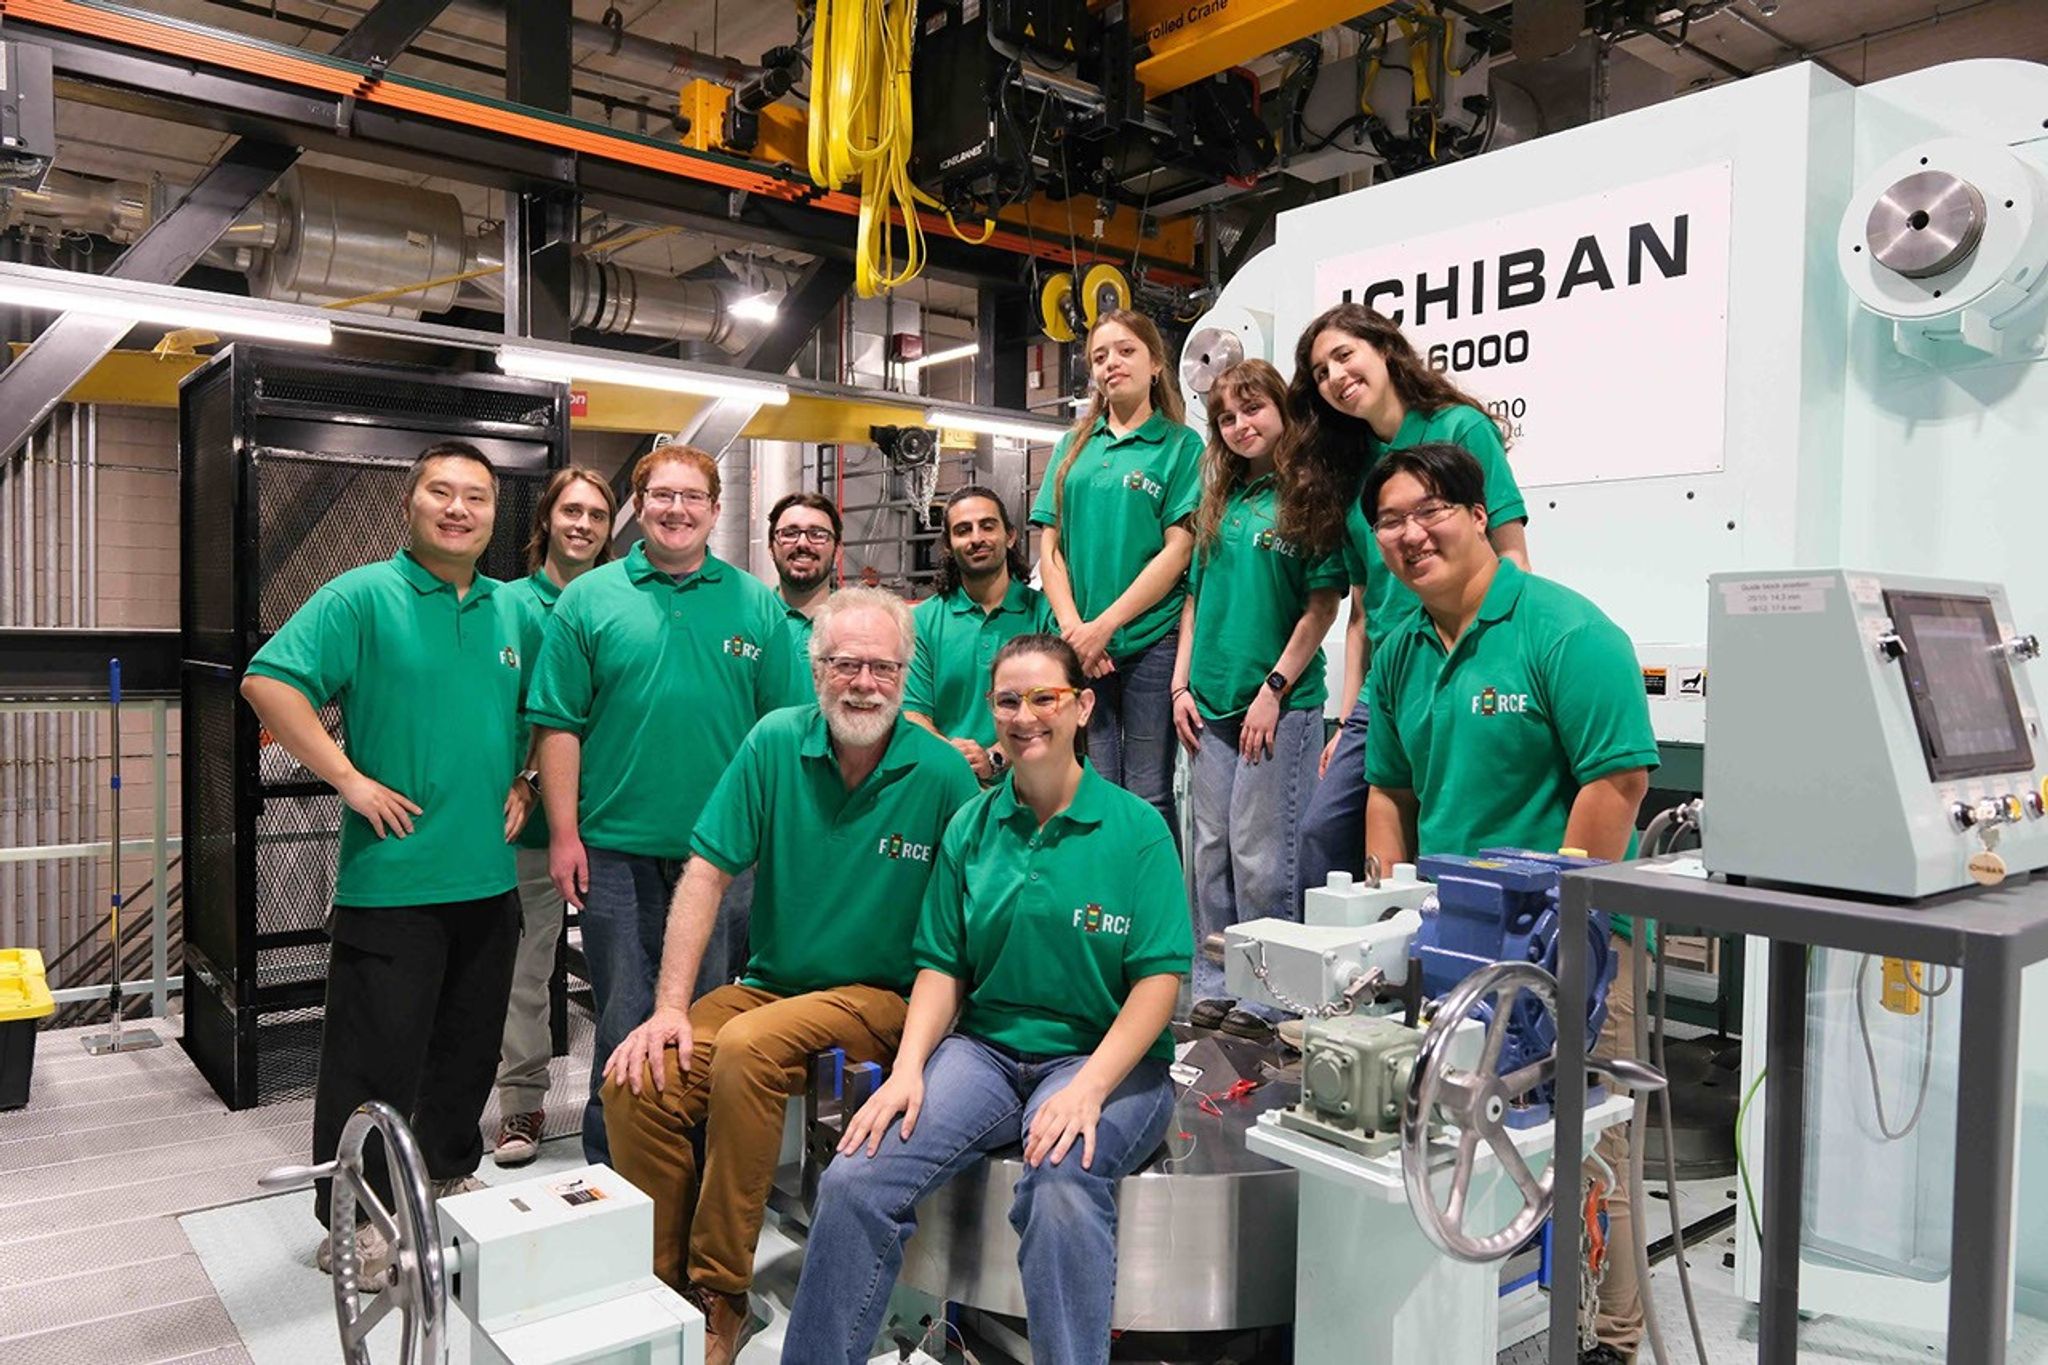
Group photo of undergraduate research interns and FORCE leaders standing together beside the high-pressure laboratory equipment.
The NASA Science Mission Directorate (SMD) Community of Practice for Education (SCoPE) – part of the NASA Science Activation (SciAct) Program portfolio – enables Earth and Space Science and Engineering Subject Matter Experts (SMEs) – especially NASA-funded SMEs – to efficiently and effectively share their science with support from SciAct education experts.
In Summer 2026, NASA SCoPE partnered with Arizona State University’s Facility for Open Research in a Compressed Environment (FORCE) Summer School to help seven undergraduate student interns build the science communication skills needed to share their research with a variety of audiences. FORCE is a world-class laboratory that uses high-pressure experimental equipment to recreate the extreme conditions found deep within Earth and other planetary bodies, enabling researchers to better understand how planets form, evolve, and behave under immense pressures.
As part of the Summer School, SCoPE facilitated two hands-on workshops on June 25 and 26, followed by office hours the following week, to help interns translate their technical research into compelling stories for non-expert audiences. The training focused on identifying the central themes of their work, developing clear and engaging messages, planning effective visitor interactions, and thinking through the logistics of public engagement. Interns also received guidance on preparing both their research posters and individual outreach stations.
The training culminated in two complementary outreach experiences. The first was the FORCE Open House, which welcomed approximately 50 members of the general public for an inside look at the laboratory. Visitors toured the facility, met the research team, explored the specialized equipment used to simulate the interiors of Earth and other planets, and interacted with interns at themed outreach stations designed to explain the science behind the experiments in accessible, engaging ways.
At the second event, a poster session for ASU faculty, staff, and students, the interns presented their research, providing an opportunity to discuss their scientific findings with members of the university community and receive feedback on their presentations.
By integrating science communication training into the Summer School experience, NASA SCoPE helped equip emerging planetary scientists with practical skills for engaging both scientific peers and public audiences. The poster session and Open House demonstrated how thoughtful communication training can strengthen researchers’ confidence while building stronger connections between cutting-edge planetary science and the communities it serves. NASA SCoPE is supported by NASA cooperative agreement award number 80NSSC21M0006 and helps enrich and enhance the impact of the NASA Science Activation Program portfolio, which connects learners with authentic NASA science experiences through partnerships with educators and community organizations.
Certain kinds of clouds are misbehaving – appearing more often and lower in the sky than they used to. To help identify the factors influencing these changes (e.g. shifts in Earth’s long-term weather patterns), scientists have asked people around the world with cameras to submit fresh images of these clouds as a part of the NASA-supported Space Cloud Watch project. Now, one volunteer has developed a new tool to help other Space Cloud Watch volunteers work more efficiently.
The misbehaving clouds are “noctilucent” or “night-shining” clouds (NLCs). These clouds scatter light from the Sun long after sunset and long before sunrise, giving them a silvery glow. But despite this glow, it can be hard to differentiate NLCs from lower-altitude look-alikes. That confusion has meant extra work for project leaders.
Volunteer Namai Chandra shared, “I noticed that NLC images were being manually verified by the project leaders. It felt like a task well-suited for a human-in-the-loop machine learning pipeline, one that could handle the repetitive screening automatically, while keeping human judgment central for the images that matter most.” In other words, Namai found a way to help observers verify when they are indeed seeing NLCs and when they’re not.
Namai reached out to the Space Cloud Watch scientists Drs. Chihoko Cullens and Brentha Thurairajah, who were delighted with his idea. Namai soon developed a machine learning pipeline, training it on a variety of cloud images, including both the NLCs and the lower altitude look-alikes that are often submitted to Space Cloud Watch. The pipeline combines image pre-screening, cloud classification, and confidence-based review routing. After several rounds of development, testing, and refinement, he released his NLC identification tool to the project. This tool is now being used by cloud contributors who are unsure whether they have observed NLCs, as well as project scientists that want to flag images for review.
Grab a camera and join the Space Cloud Watch project today! If you’ve hesitated to contribute to Space Cloud Watch because you were not certain if what you were seeing was a noctilucent cloud, you now have a way to check before you share – thanks to Namai.
Namai Chandra, Space Cloud Watch volunteer and creator of the Noctilucent Cloud Detector tool.
Photo by Surabhi Chandra.
Learn More and Get Involved
Space Cloud Watch
Photograph clouds just after sunset or before dawn to investigate our changing atmosphere.
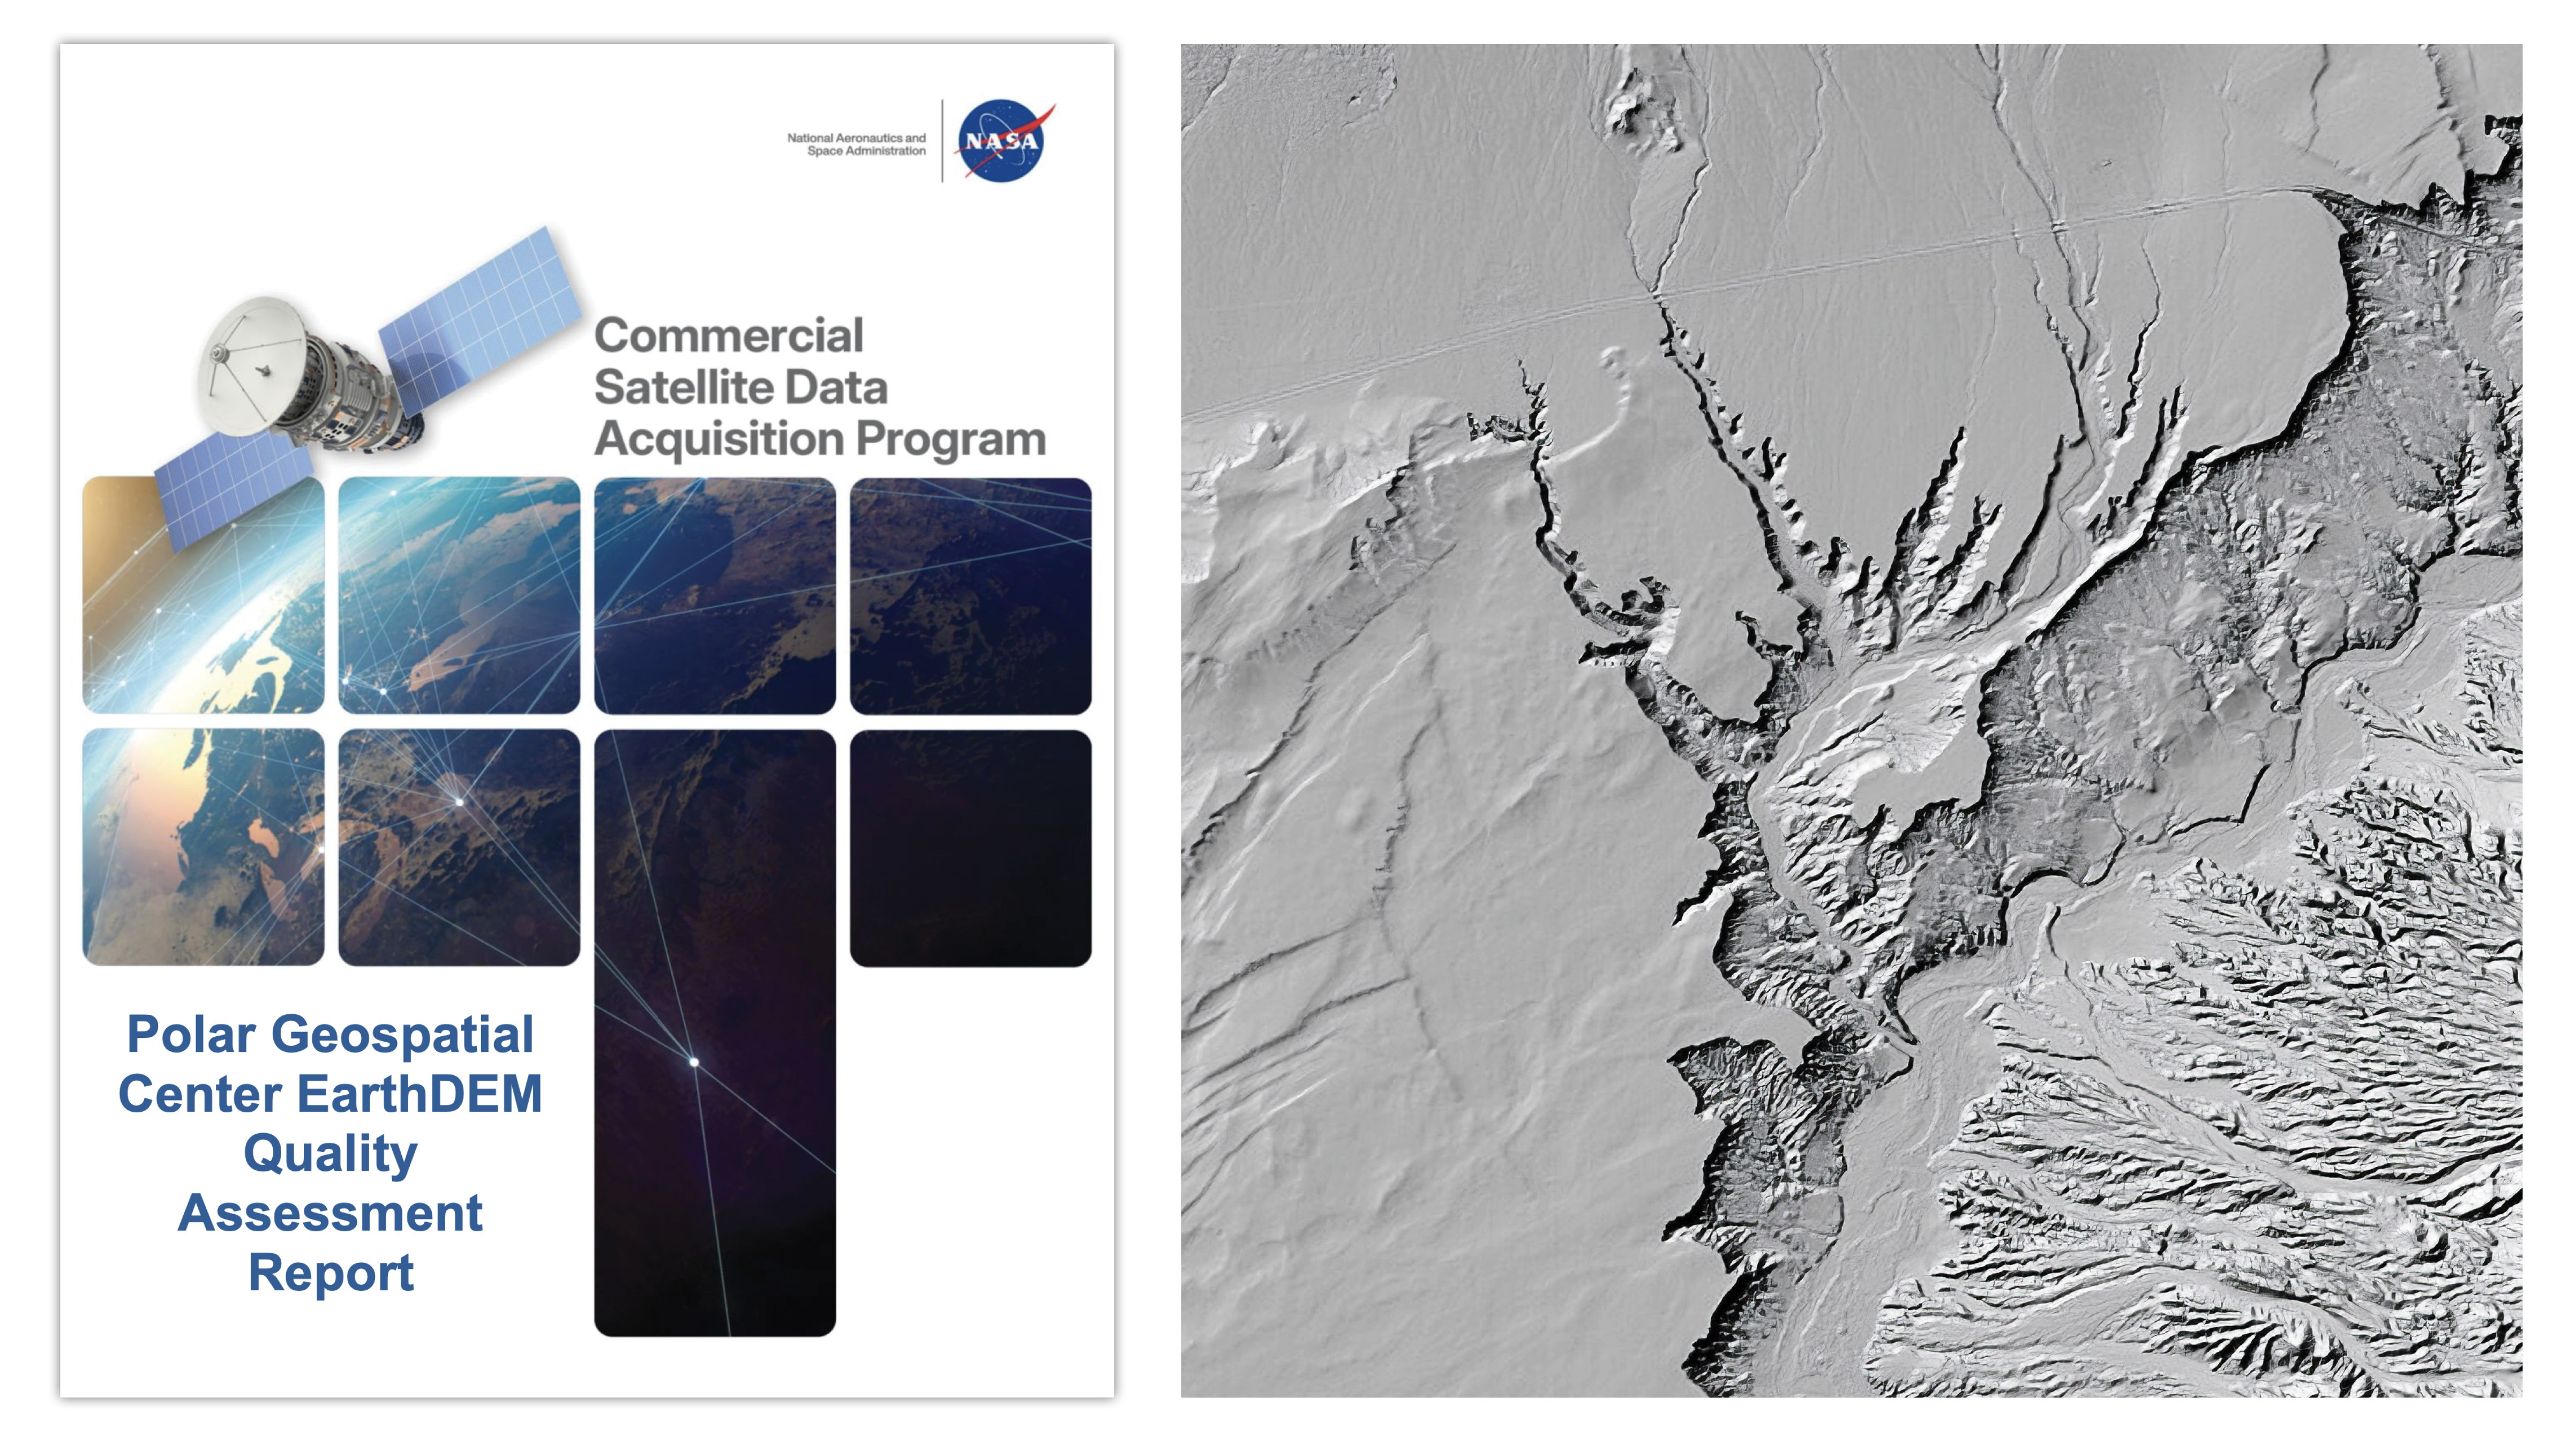
A new quality assessment report from NASA’s Commercial Satellite Data Acquisition (CSDA) program evaluates data from the Polar Geospatial Center’s (PGC) EarthDEM product. The results of the evaluation help inform NASA program management and the user community about the quality of commercial Digital Elevation Models (DEMs) for use in NASA science.
At left, the cover of the Commercial Satellite Data Acquisition programs’s recently released Polar Geospatial Center EarthDEM Quality Assessment Report. At right, a shaded relief rendering of EarthDEM data showing the Virgin River in Nevada. DEM derived from Vantor imagery.
Credit: NASA CSDA program/EarthDEM Project
Issued August 8, 2026, the CSDA Polar Geospatial Center EarthDEM Quality Assessment Report was conducted by NASA Digital Elevation Model (DEM) subject matter experts (SMEs) enlisted to evaluate the horizontal and vertical accuracy of two PGC EarthDEM1 (i.e., Digital Elevation Model) products: the center’s “Mosaic Tile” and “Strip” Digital Surface Models (DSMs).
To assess the vertical and horizontal accuracy of the EarthDEM Strip DSM and Mosaic Tile products over a variety of surface characteristics, the SMEs compared them to airborne lidar data samples from across the United States and Senegal. They found the horizontal accuracy of the EarthDEM products (Strip DSM: 0.5-meter (m) Root Mean Square Error Horizontal (RMSEH); Mosaic Tile: 0.3 m RMSEH) agreed with the specifications provided by the PGC and graded them “Excellent.” The vertical accuracy results of the EarthDEM Strip DSM (5.6 m Root Mean Square Error Vertical (RMSEV)) and the Mosaic Tile (4.9 m RMSEV) products varied by land cover type, with all land cover types exceeding the specification provided by the PGC (0.5 m RMSEV). Strip DSM vertical accuracy was found to vary from 4.6-6.8 m RMSEV depending on the cloud cover metadata field generated by the PGC. Given this variation, the vertical accuracy compliance for the EarthDEM products was graded as “Basic.”
Overall, the assessment report supports the use of EarthDEM data for NASA Earth science research and applications, as long as the data characteristics (e.g., vertical accuracy, poor cloud masking, missing surface features, data voids, etc.) are compatible with the specific science objectives and use cases.
The report also provides a Data Provider Documentation Review for the EarthDEM product that evaluated information from the PGC website, as well as a series of peer-reviewed publications by researchers at The Ohio State University’s Byrd Polar and Climate Research Center. (Only documents listed in this report were considered in the evaluation.) The report’s authors found that, overall, the EarthDEM product is “well documented,” with most information present within the product User Guide, a series of peer reviewed papers, or the PGC GitHub repository.
About the CSDA Program
The CSDA program was established to identify, evaluate, and acquire data from commercial sources that support the NASA Earth science research and application goals. NASA’s Earth Science Division recognizes the potential impact commercial satellite constellations may have in encouraging/enabling efficient approaches to advancing Earth System Science and applications development for societal benefit. Commercially acquired data may also provide a cost-effective means to augment and/or complement the suite of Earth observations acquired by NASA, other U.S. government agencies, and international partners.
1. According the authors of the report, “it should be noted that the PGC EarthDEM product is not technically a commercial product…. EarthDEM is a digital elevation dataset derived from imagery collected from the Vantor (formerly Maxar) fleet of optical satellites.”
The fully-integrated LEMS (Lunar Environment Monitoring Station) ready for environmental testing. A small suitcase-size instrument suite built at NASA Goddard, LEMS is designed to carry out continuous, long-term monitoring of the seismic environment at the Moon, including surface motion caused by moonquakes and meteorite impacts in the lunar south polar region.
NASA Goddard/Mike Guinto
NASA has declared “wrenches down” on the first completed payload designed for Artemis astronauts to deploy on the Moon’s surface. Engineers working on NASA’s Lunar Environment Monitoring Station, or LEMS, have completed hardware development and testing and the payload is ready for its permanent home near the lunar South Pole. With the hardware complete, LEMS is ready to support one of the Artemis program’s core goals: enabling sustained lunar science and exploration.
The LEMS instrument package contains two highly sensitive seismometers that will monitor ground vibrations from moonquakes and meteorite impacts, providing scientists with insights into the Moon’s interior and the seismic hazards astronauts might encounter at the surface. Its modular design allows the system to be adapted or expanded to host new instruments in the future, creating a reusable platform that can evolve as scientific priorities grow.
The payload will remain in a clean room at NASA’s Goddard Space Flight Center in Greenbelt, Maryland, where it was built, until it is assigned to an Artemis mission for deployment to the lunar surface.
“The completion of the LEMS scientific instrument is a major step in a new era of lunar surface science. Innovative science experiments will uncover, measure, and reveal the Moon’s secrets while astronauts open new frontiers for discovery,” said Joel Kearns, deputy associate administrator for exploration, Science Mission Directorate, NASA Headquarters in Washington. “And, behind the scenes, countless teams across NASA and our partners are pushing the boundaries of what surface instruments can do, building the tools that will make future exploration possible and safer.”
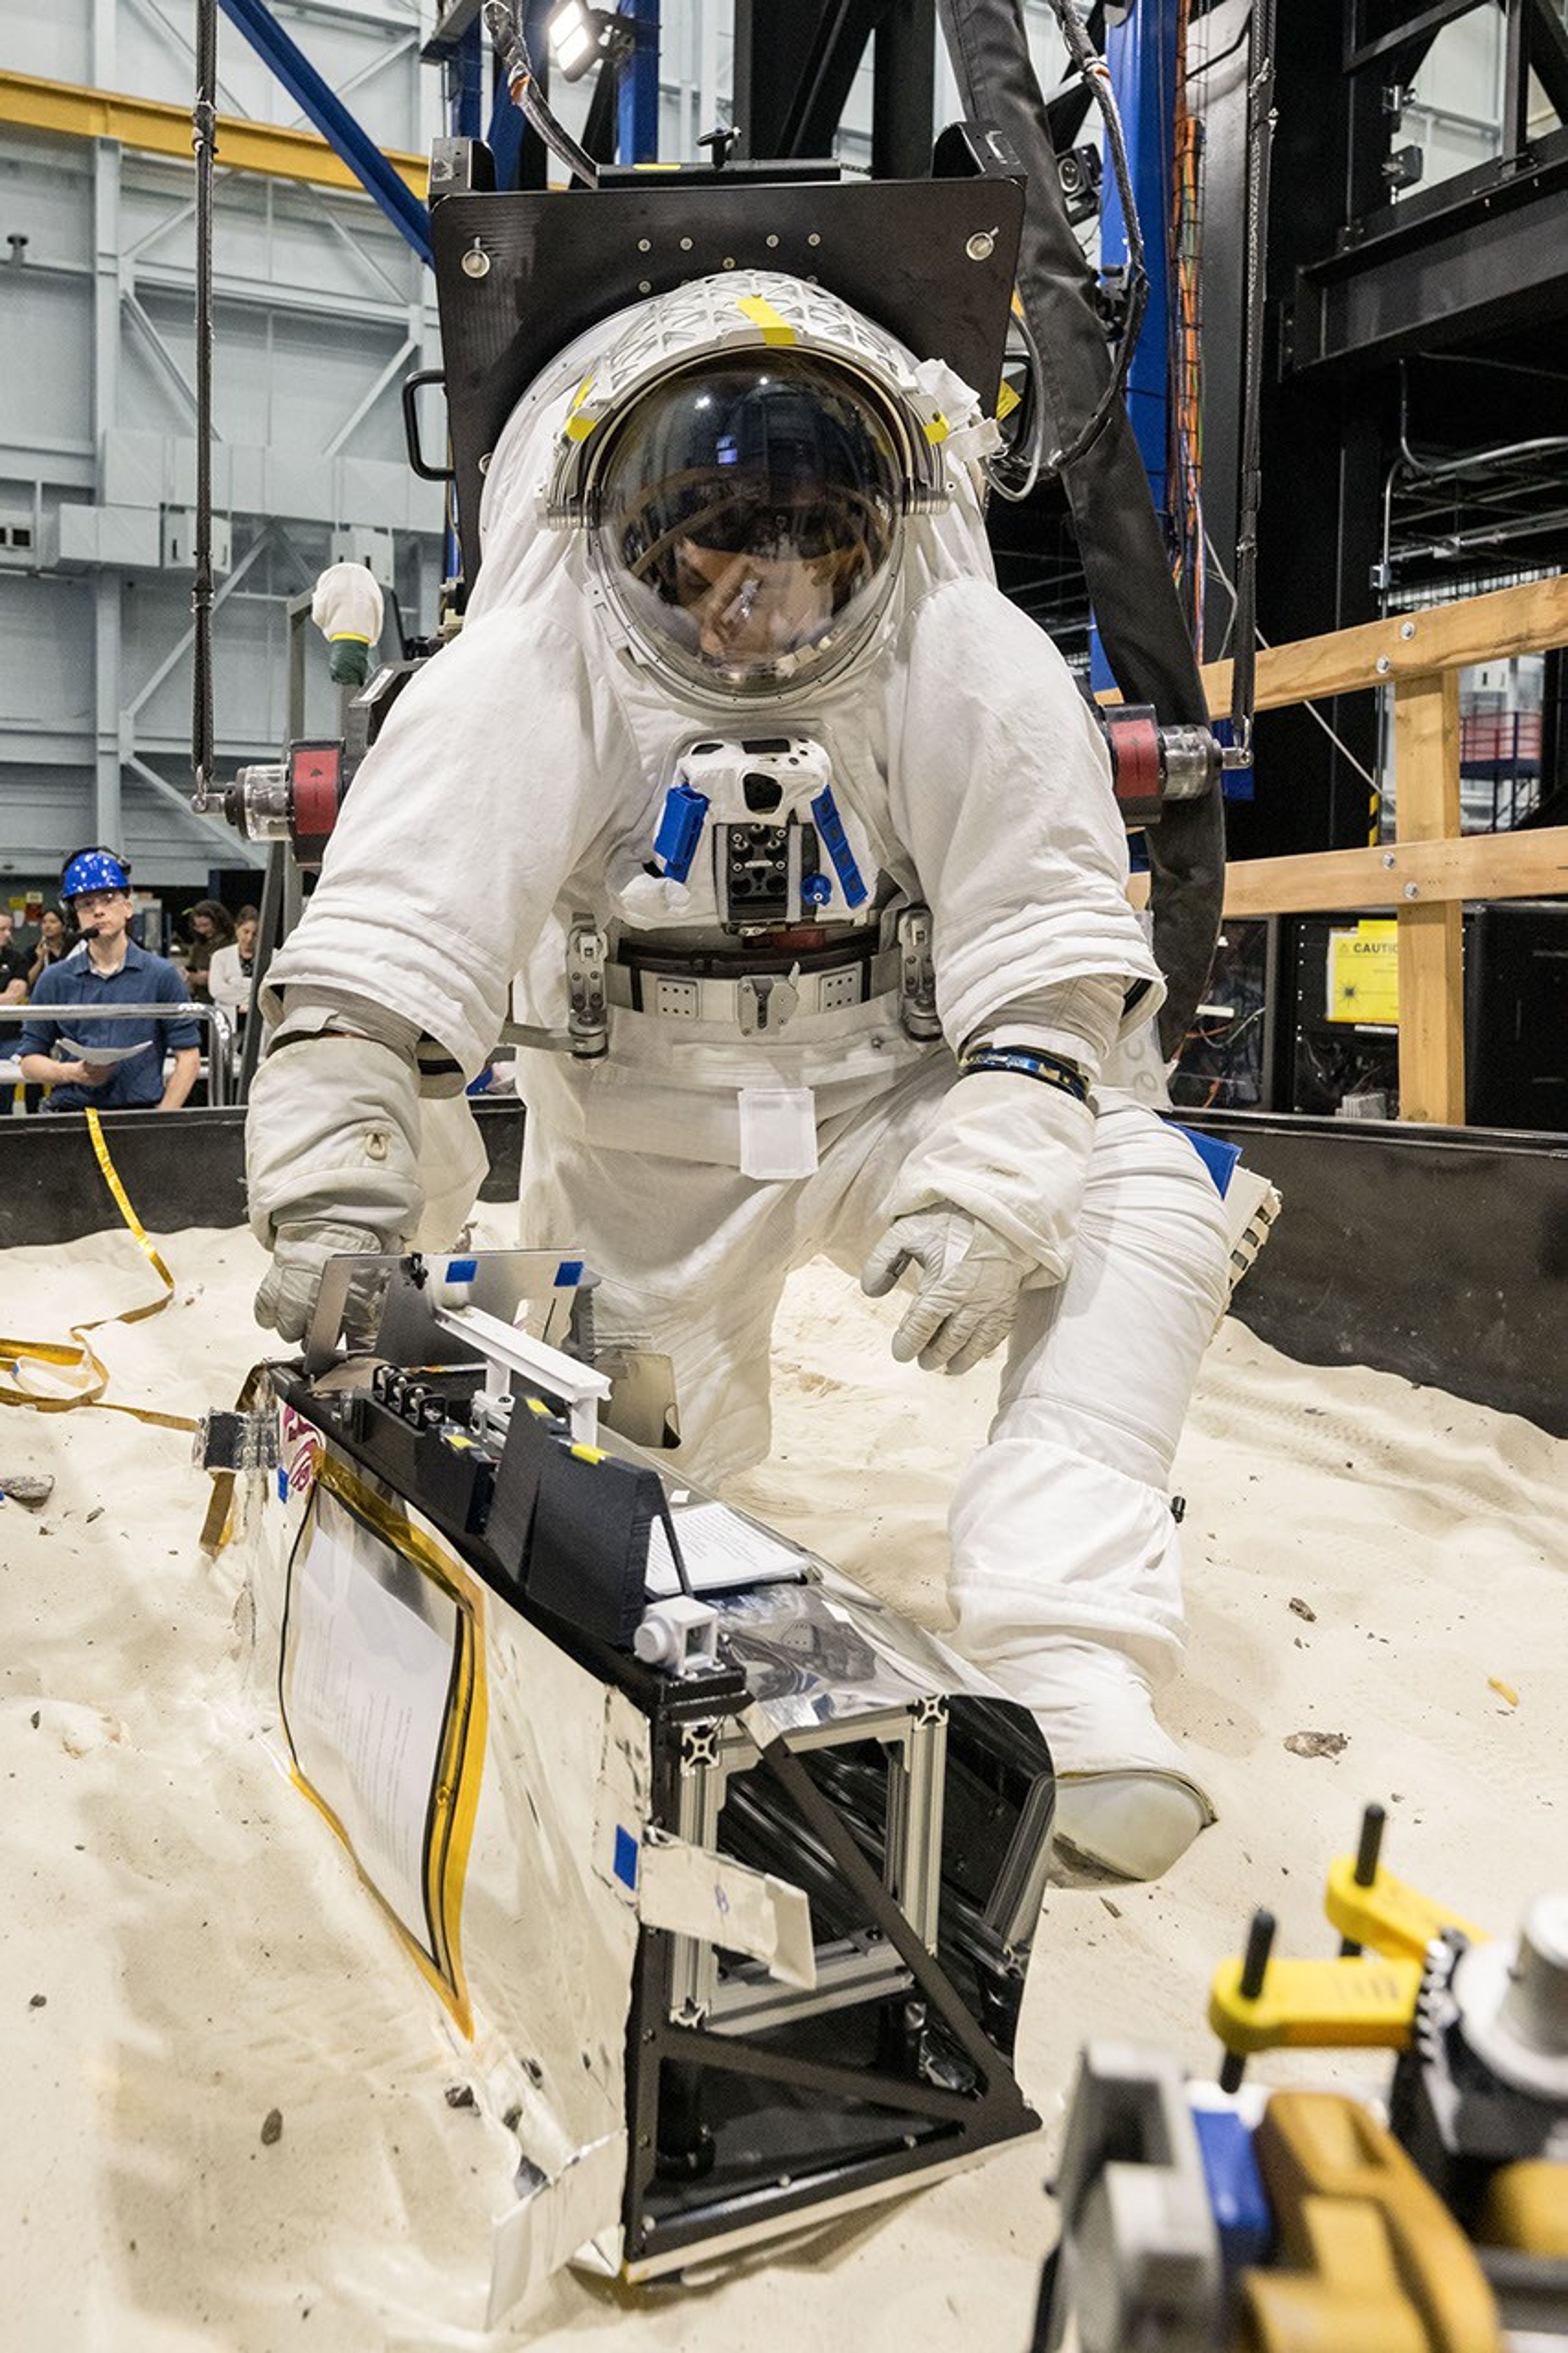
A scientist wearing NASA’s xEMU prototype space suit is testing the handling of a mockup version of NASA’s Lunar Environment Monitoring Station, or LEMS. The testing took place at the Active Response Gravity Offload System, a simulated reduced gravity environment at NASA’s Johnson Space Center in Houston.
NASA Johnson
The LEMS payload builds on a legacy of lunar seismic tracking. Apollo astronauts deployed a network of seismometers on the Moon’s nearside equatorial region between 1969 and 1972. Those instruments operated until 1977, recording about 13,000 moonquakes and other ground vibrations that helped scientists begin to understand the composition of the Moon’s interior. For decades, researchers have hoped to spread more seismometers, updated with new technologies, across the lunar surface.
Now, LEMS will carry the first seismometers to be deployed by future astronauts to listen for faint ground vibrations, collecting new clues to the Moon’s internal structure and ongoing seismic activity. The sensors will be the most compact, sensitive, and energy-efficient seismometers ever built for planetary exploration.
LEMS itself is about the size of a small suitcase, weighing 11 pounds in the Moon’s low-gravity environment. It will carry not just these seismic sensors, but everything it needs to function independently of humans after deployment. LEMS is built to manage its own power production via a lightweight, flexible solar array that conforms to the shape of the LEMS unit. It also will manage its operational activities to ensure continuous data collection based on a preset plan, and monthly data transmission to Earth. The payload will do all this while maintaining a stable internal temperature throughout the massive day-to-night temperature swings of the South Pole region.
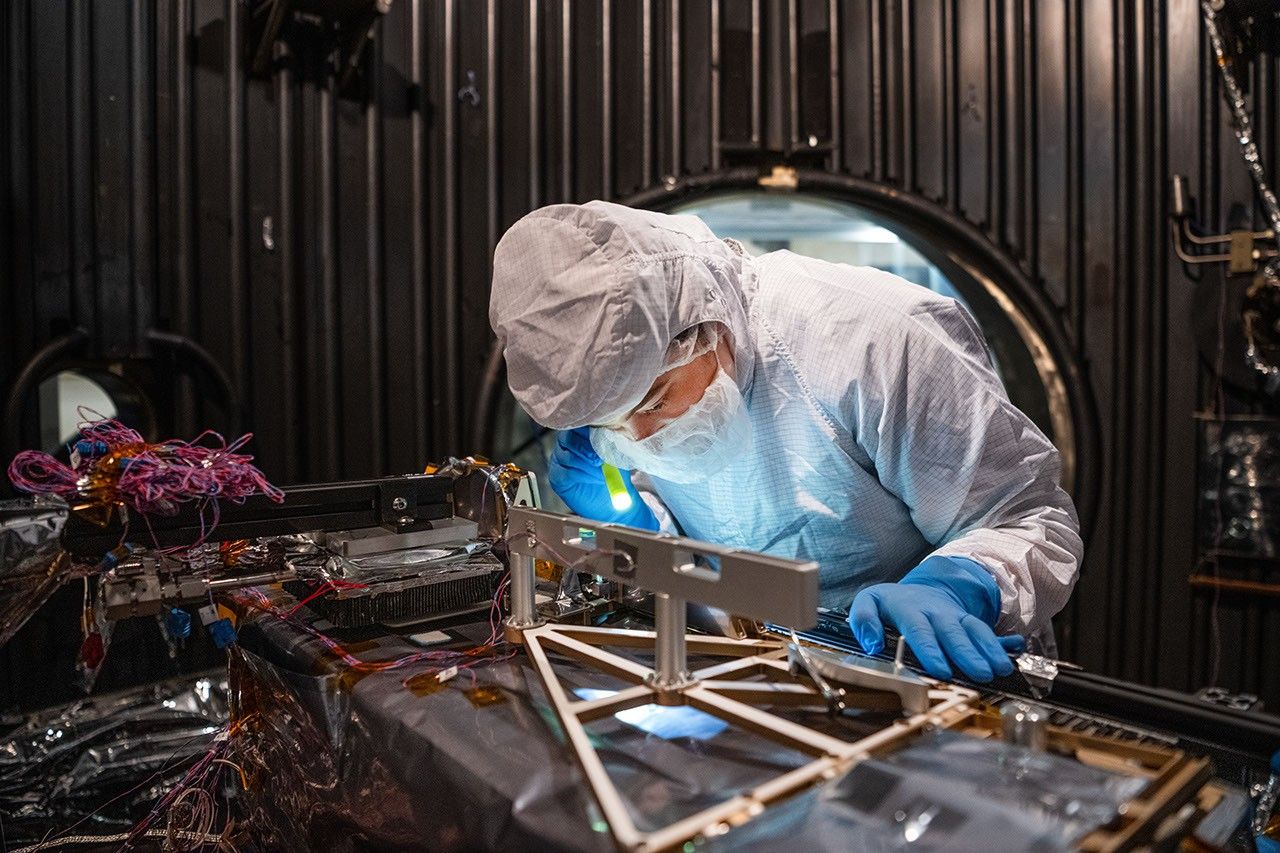
Mechanical Engineer Brie Ludwig inspects the Lunar Environment Monitoring Station (LEMS) in preparation for testing in a thermal vacuum chamber at Goddard Space Flight Center in Greenbelt, Maryland, on March 31, 2026. LEMS is a compact, autonomous, and self-sustaining seismometer suite designed to carry out continuous, long-term monitoring of the lunar seismic environment at the South Polar region.
NASA/Denny Henry
“When we conceived of LEMS, we weren’t just thinking about the next mission, we were thinking about the next generation of lunar exploration,” said Mehdi Benna, a University of Maryland Baltimore County scientist who leads LEMS from NASA Goddard. “Our vision was to create a scientific buoy for the Moon. Like an ocean buoy on Earth, LEMS is designed to be easy to build, adaptable to different scientific objectives, and capable of operating independently for years.”
Before any surface science could happen, Benna and his team had to ensure that LEMS could survive the trip to the Moon and the harsh environment of its surface. Over the past five months, LEMS and its components have been subjected to a demanding series of environmental and operational tests. Engineers verified LEMS can endure the violent shaking of launch, the journey to the lunar surface, and the Moon’s temperature and radiation environment. The team also showed that the instrument package’s mechanical and electrical design is safe for astronaut handling.
The LEMS payload was built to operate through the lunar night, which lasts two Earth weeks, without external power assistance or a heat source. Past lunar surface instruments relied on radioisotope heaters for warmth and power. But LEMS instead will withstand temperatures that dip to minus 400 degrees Fahrenheit in some areas by using advanced insulation materials, low-thermal-conductivity cables that minimize heat loss, and a thermal regulator that conducts heat away during the day to prevent overheating and helps retain heat at night.
These innovations reduce mass and power needs, setting the stage for lighter, energy-efficient instruments that can operate continuously at future Artemis landing sites and the NASA-led Moon Base.
The LEMS payload is led by University of Maryland Baltimore County and University of Maryland College Park. Technical implementation is led by NASA Goddard. The University of Arizona, in partnership with Silicon Audio, Inc., supplied LEMS’ two state-of-the-art seismometers. Morehead State University in Kentucky provided LEMS’ telecommunication system and will operate the instrument on the surface. Washington University in St. Louis will manage the instrument’s data processing and dissemination to the larger scientific community.
Preparations for Next Moonwalk Simulations Underway (and Underwater)
This annotated composite of nine images taken by Perseverance’s Mastcam-Z on July 2, 2026, shows Earth — the small bright dot moving from upper left to lower right — passing behind the Martian moon Phobos. The images in the inset were captured from the same rectangular patch of sky outlined in black.
NASA/JPL-Caltech/ASU/MSSS/SSI
The timecode annotations in the inset show the local solar time on Mars during which five individual images of the occultation were captured by NASA’s Perseverance on July 2, 2026. Earth disappears — and then reappears — behind the Martian moon Phobos.
NASA/JPL-Caltech/ASU/MSSS/SSI
Earth and the Martian moon Phobos dance together in a series of images recently acquired by NASA’s Perseverance Mars rover. Earth appears as a point of light in the Martian sky, disappearing behind the crescent of Phobos, the larger of Mars’ two moons.
This is the first time humanity has captured from the surface of another planet an observation of Earth disappearing behind an object.
The image sequence was taken by the rover’s Mastcam-Z instrument at about 7 p.m. local solar time (the Martian evening time where the rover is located) on July 2, the 1,907th Martian day, or sol, of the mission. In the composite image, Earth travels from the upper left of the frame toward the lower right while Phobos, moving from lower left to upper right, sweeps across its path. In the third frame of the sequence, the two meet, and our planet winks out behind the little moon’s shadowed edge.
“The composite image makes for a unique Earth self-portrait, taken from the surface of another planet, with a Phobos photobomb,” said Justin Maki, the Mastcam-Z deputy principal investigator and imaging scientist for Perseverance at NASA’s Jet Propulsion Laboratory in Southern California.
From where Perseverance sits on the rim of Mars’ Jezero Crater, the two objects could hardly look more different. Phobos, a lumpy, potato-shaped moon about 17 miles (27 kilometers) across at its widest, orbits so close to Mars (4,850 miles, or 7,800 kilometers, away) that when the images were taken, Phobos appears roughly one-third the width of Earth’s Moon as seen from our planet. Some 195 million miles (314 million kilometers) away at the time, Earth is reduced to a single, pixel-size dot.
“Phobos crosses the Martian sky three times a day, and Earth is visible for months at a stretch, but catching one directly behind the other takes planning and a little luck,” said Mark Lemmon, a Mastcam-Z co-investigator at the Space Science Institute in Boulder, Colorado, who planned the observation and assembled the composite.
This composite of seven images of Earth passing behind the Martian moon Phobos was acquired from data taken on July 2, 2026, 1,907th Martian day, or sol, of the mission. The black background is the result of image processing that removed extraneous light in the background to enhance detail.
NASA/JPL-Caltech/ASU/MSSS/SSI
Transits, occultations, eclipses
Astronomers call the event captured in this observation an occultation: when a larger-appearing body completely blocks the one behind it from the viewer’s standpoint. By contrast, an eclipse occurs when one object moves into the shadow of another. When the Moon passes through Earth’s shadow, it’s called a lunar eclipse; when one object that appears to be the same size as another blocks it, like when the Moon passes before the Sun, it’s known as a solar eclipse.
When the roles are reversed, with a smaller-looking object crossing the face of a larger-looking one, astronomers call that a transit. Perseverance has observed those, too: when Phobos or Deimos crosses the disk of the Sun as seen from Mars. These are sometimes described informally as “Martian solar eclipses.”
More about Perseverance
NASA’s Jet Propulsion Laboratory in Southern California, which is managed by Caltech, built and manages operations of the Perseverance rover on behalf of the agency’s Science Mission Directorate in Washington, as part of NASA’s Mars Exploration Program portfolio. Arizona State University leads the operations of the rover’s Mastcam-Z instrument, working in collaboration with Malin Space Science Systems in San Diego, on the design, fabrication, testing, and operation of the cameras.
The Moon’s rocky, uneven, and otherworldly surface features are highlighted by the terminator – the difference between light and darkness.
NASA
Using ground-based telescopes and space-based assets, NASA and SpaceX are tracking a used Falcon 9 upper stage from a commercial mission expected to impact the Moon on Wednesday, Aug. 5, near the Einstein and Bell craters. The impact poses no danger to Earth and NASA scientists are planning to collect lunar data from the event and refine techniques for tracking objects in space.
On Jan. 15, 2025, SpaceX launched the Falcon 9 rocket and successfully deployed Firefly Aerospace’s Blue Ghost 1 lunar lander to the Moon under NASA’s CLPS (Commercial Lunar Payload Services) initiative. Solar activity and gravitational forces caused the stage’s unplanned return to the Moon. NASA and SpaceX remain in communication about the upper stage and its flight path.
Independent astronomers first identified the trajectory using publicly available data. NASA’s Center for Near Earth Object Studies at the agency’s Jet Propulsion Laboratory in Southern California, which tracks natural objects that could pose hazards to Earth, later confirmed the stage has a 100% chance of impacting the Moon. NASA will continue tracking it as part of training operations.
Because the Moon has no atmosphere to slow incoming objects, it is struck by meteoroids daily. Human‑made object impacts are far less common but do occur. The rocket stage is expected to create a crater about 60 feet wide and 12 feet deep and throw dust and rock outward as ejecta. For comparison, a meteoroid with the same energy as the upper stage hits the Moon about every six days, so the lunar surface is constantly absorbing impacts with the same force. Despite the disturbance, observing impacts gives scientists valuable insight by revealing how ejecta plumes behave, helping to understand the Moon’s geology and refine models that guide future exploration and science missions.
The impact will not be visible to the naked eye on Earth, but NASA will attempt to observe it in real time. The Meteoroid Environments Office at the agency’s Marshall Space Flight Center in Huntsville, will use ground‑based telescopes to image the impact; however, weather and lighting conditions may make viewing difficult.
Additionally, NASA’s Lunar Reconnaissance Orbiter and the ShadowCam instrument aboard South Korea’s Korea Pathfinder Lunar Orbiter will look for chances to image the site before and after the impact. Image availability will depend on lighting, orbital timing, and spacecraft position, and it may take several days to receive imagery. Any data collected will help scientists better understand artificial impacts and their exploration implications.
Although unplanned in this instance, disposing of upper stages on the lunar surface is a technically accepted and safe method and, in some cases, can be the only practical option for missions in low lunar orbit. Many operators choose controlled impacts because they provide predictable and trackable end of life outcomes.
NASA is committed to debris mitigation and demonstrating responsible disposal practices that safeguard Earth, its orbital environment, and other planetary bodies while enabling discoveries that deepen our understanding of the solar system and benefit humanity.

 Login
Login