Login
Login
How 2 US, European Satellites Are Studying Hurricanes During El Niño
5 min read
Preparations for Next Moonwalk Simulations Underway (and Underwater)
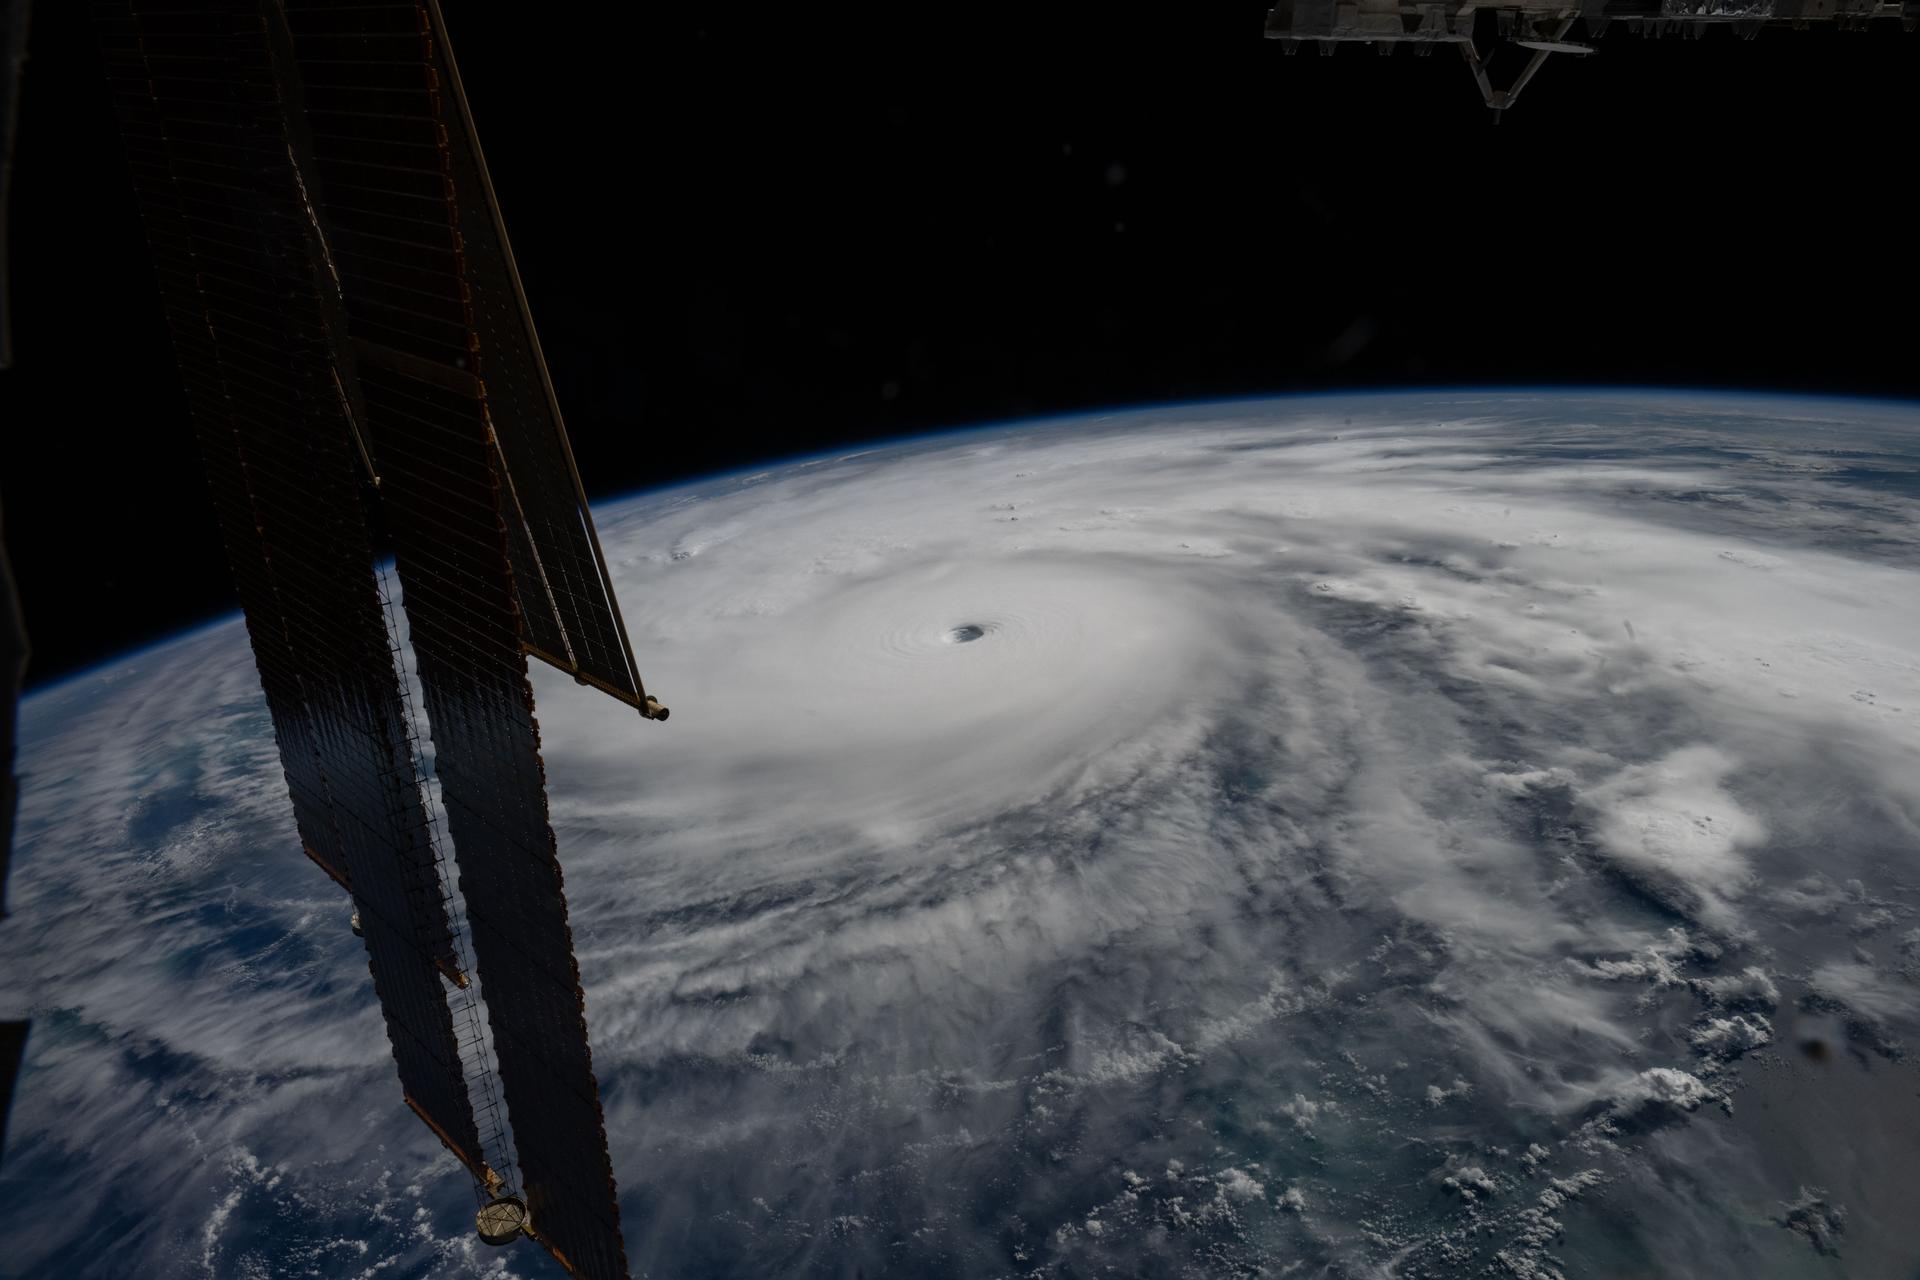
Last November, NASA and its European partners launched the Sentinel-6B satellite to improve hurricane forecasts, help protect infrastructure, and benefit commercial industries, including shipping. The satellite now is flying 30 seconds behind its predecessor, Sentinel-6 Michael Freilich. Both satellites are providing precise sea level height measurements during what oceanographers expect to be a historic El Niño, a naturally occurring oceanic phenomenon in which warmer-than-usual Pacific waters shift global weather patterns.
The two satellites make up the Copernicus Sentinel-6/Jason-CS (Continuity of Service) mission, the latest in a series of ocean-observing radar altimetry missions that have been monitoring Earth’s changing seas continuously since the early 1990s.
The data each satellite is collecting will not only allow scientists to better understand this year’s El Niño but will also help them create more accurate hurricane predictions.
“This El Niño was a late-bloomer,” said Josh Willis, Sentinel-6B’s project scientist at NASA’s Jet Propulsion Laboratory in Southern California. “It didn’t kick off until the middle of the year and is just now reaching a strength similar to what we’ve seen in the satellite record during significant El Niños in 1997 and 2015. We expect it to be big, and it’s already having big impacts.”
El Niños generally scramble weather patterns tied to rainfall and storms, including hurricanes. They also redistribute heat in the ocean, which affects sea level. Normally, Earth’s warmest ocean waters sit along the equator in the western Pacific. During El Niño, weakened winds, which usually blow westward along the equator, result in heat spreading east toward South America. The change in ocean heat shifts hurricane activity from the Atlantic to the Pacific Ocean.
Predicting hurricane strength
On July 15, Sentinel-6B began delivering low-latency data to scientists that could be used for weather predictions. That data will take some time to work its way into the research models on which meteorologists and climate scientists rely, but when it does, those improved models could save lives.
Data from Sentinel-6 satellite missions feeds into hurricane tracking algorithms used by federal and state agencies. Those predictions can activate disaster response efforts, mobilizing resources ranging from sandbag placement to National Guard activation. They also can lead to evacuation orders that require quick but well-informed decisions about logistics at a local level. More severe events may require engaging larger organizations, such as the Federal Emergency Management Agency.
A tropical storm can take a week or more to become a hurricane and make its way to a coastline, but a hurricane can rapidly intensify in the 48 hours prior to landfall, leaving planners little time to prepare.
“Hurricanes have been known to speed up quickly at the last moment, so the window in which to decide what to do is short,” said Deirdre Byrne, an oceanographer and altimetry expert with the National Oceanic and Atmospheric Administration (NOAA). “The goal is to forecast how much and how rapidly intensification will happen so that officials can make the right calls.”
Byrne oversees one of the country’s most crucial hurricane forecasting algorithms, NOAA’s Satellite Ocean Heat Content Suite, which has been operating since 2012.
Each Sentinel-6 satellite measures ocean height, as well as the size of waves and marine wind speed, using a radar altimeter, which bounces thousands of radar pulses a second off the crests and troughs of waves. Ocean height varies from place to place and provides insight into the ocean’s heat content, since warm water expands. That, in turn, helps forecast how fast hurricanes will grow.
The satellites each carry a second instrument, called the Global Navigation Satellite System – Radio Occultation (GNSS-RO), which measures atmospheric properties, such as humidity, pressure, and temperature.
Among the measurements Sentinel-6 is gathering, Byrne is most anticipating the ocean height data, which she plans to begin incorporating into the current Satellite Ocean Heat Content Suite algorithm by the end of the year.
“In terms of data quality, the Sentinel-6 missions are unparalleled,” Byrne said.
Together, the missions are also extending a precise dataset deep into its fourth decade. This record of sea level observations traces back to the TOPEX/Poseidon mission, which launched in 1992, and continues through to the present day with Sentinel-6 Michael Freilich. Sentinel-6B will take over for its predecessor as the reference satellite for global sea level measurements later this year.
“The key is consistency, measuring the same way, every time,” said Severine Fournier, Sentinel-6B deputy project scientist, JPL. “That’s what lets us predict hurricanes, and, in turn, protect coastal communities and infrastructure.”
More about Sentinel-6B
Sentinel-6 Michael Freilich, named after a former director of NASA’s Earth Science Division, is one of two satellites that compose the Copernicus Sentinel-6/Jason-CS mission.
Sentinel-6/Jason-CS, a part of the European Union’s Earth observation program called Copernicus, was jointly developed by ESA (European Space Agency), EUMETSAT (European Organisation for the Exploitation of Meteorological Satellites), NASA, and NOAA, with funding support from the European Commission and technical support on performance from the French space agency CNES (Centre National d’Études Spatiales). Spacecraft monitoring and control, as well as the processing of all the altimeter science data, is carried out by EUMETSAT on behalf of the European Union’s Copernicus Programme, with the support of all partner agencies.
NASA JPL, a division of Caltech in Pasadena, contributed three science instruments for each Sentinel-6 satellite: the Advanced Microwave Radiometer, the GNSS-RO, and the Laser Retroreflector Array. NASA also contributed launch services, ground systems supporting operation of the agency’s science instruments, the science data processors for two of these instruments, and support for the United States members of the international Ocean Surface Topography Science Team.
For more about Sentinel-6B, visit:
https://science.nasa.gov/mission/sentinel-6B
-end-
Media Contacts
Andrew Good / Andrew Wang
Jet Propulsion Laboratory, Pasadena, Calif.
818-393-2433 / 626-379-6874
andrew.c.good@jpl.nasa.gov / andrew.wang@jpl.nasa.gov
2026-060
Details
Explore More
Discover Related Topics
Explore Earth Science
From its origins, NASA has studied our planet in novel ways, using a fleet of satellites and ambitious airborne and ground-based…

Earth Science at Work
NASA Earth Science helps Americans respond to challenges and societal needs — such as wildland fires, hurricanes, and water supplies…
Earth Science Data
Open access to NASA’s archive of Earth science data
Earth Science Missions
In order to study the Earth as a whole system and understand how it is changing, NASA develops and supports…