As predominantly indoor creatures, it’s important to maintain a healthy habitat for the hacker. [Kishan Pratap Singh] designed a clever solution in AirSense, an ESP32-powered air filter.
If you’re thinking of cleaning the air in your environment, you might also want to know some properties about the air coming out of the filter. AirSense measures PM2.5 dust concentration, Air Quality Index (AQI), temperature, humidity, and atmospheric pressure. The various sensors are mounted along the exhaust path of the filter, which lets your know what kind of air it’s pumping out.
The system drives a 150 mm exhaust fan mounted in a 3D printed cap that pulls air through a cylindrical Xiaomi HEPA filter inside a perforated metal trash can enclosure. The ESP32 and an LCD readout of the environmental data also live in the cap, giving the device a sleek look. While [Singh] chose to run the filter continuously, we wonder if it might be interesting to set it up to only filter the air if air quality drops below a certain level to conserve power, especially if you’re on a time-of-use power plan. That would require redesigning the sensor assembly (or running the unit in reverse), so maybe it’s over-complicating things?
Wildland fire activity in Canada ramped up in July 2026, a time of year when lightning ignitions typically increase, according to a seasonal outlook published by several North American fire agencies. The blazes sent smoke plumes pouring across the U.S. and Canada, affecting air quality in both countries.
This animation tracks brown carbon, the organic aerosols emitted by fires that give smoke plumes their characteristic yellow, orange, and brown tint. Brown carbon is a major component of a fire’s PM2.5 emissions, a type of air pollution that can aggravate cardiovascular and respiratory conditions. Here, the plume drifts across North American skies from July 14 through July 20, 2026.
Data for the animation come from a version of the GEOS (Goddard Earth Observing System) model, which assimilates data from satellites, aircraft, and ground-based observing systems. In addition to satellite observations of aerosols and fires, the model also incorporates meteorological data such as air temperature, moisture, and winds to project the plume’s behavior.
On July 14, at the start of the animation, numerous fires had already cropped up, including more than 180 in Ontario and several in northern Minnesota. Winds carried the smoke southeast, and by July 15, skies turned hazy and air quality declined from southern Ontario in Canada to the Upper Midwest and Northeast in the U.S. July 16 and 17 saw air quality in many areas continue to plummet, including in Detroit, where it stayed in the hazardous range for several consecutive days. Toronto, Chicago, New York City, and Washington, D.C., saw air quality ranging from unhealthy to hazardous.
On July 19 and 20, smoke continued to affect air quality downwind, including in the Great Lakes region, according to the National Weather Service. Storms began clearing it away in parts of the East, where air quality improved to good or moderate. Meanwhile, fires in the Pacific Northwest began degrading air quality there.
The brown carbon shown in this animation represents organic carbon that comes specifically from wildfire smoke. Wildfires also emit black carbon, or soot, which contributes to their PM2.5 output. Black carbon has long served as a tracer for smoke plumes, but human sources—such as vehicle exhaust and industrial combustion—produce it too, blending in with the black carbon from fires. The GEOS model has been able to make that distinction for brown carbon since February 2026, when an update enabled it to split organic carbon into its anthropogenic and biomass-burning components.
New NASA Earth Missions Gear Up to Start Science Flights
Satellite imagery captured wildfires burning hot enough to generate pyrocumulonimbus clouds north of Lake Superior in July 2026. NASA aircraft will help scientists study the powerful storms as they develop.
Credits: CSU/CIRA & NOAA
Landslides in Alaska. Air quality in Atlanta. Fire clouds out West. From the Arctic fringes to farm country, NASA’s newest class of suborbital Earth Venture missions is gearing up to deliver science that will benefit communities in the United States and beyond.
The six projects will mobilize hundreds of scientists and pilots from NASA, the U.S. Navy, universities, and other institutions over the next several years. While the investigations range across topics, a defining feature of suborbital missions is the use of sensors mounted on aircraft.
Airborne remote sensing serves as a bridge between ground-based instruments and satellites. Data collected via planes, helicopters, drones, and balloons can fill in gaps in computer models used by weather forecasters, city planners, and others.
When wildfires create their own weather
The first project to take wing this summer is Injected Smoke and PYRocumulonimbus Experiment (INSPYRE), led by the Naval Research Laboratory. From mission headquarters in Colorado, the team will chase one of the least understood forms of severe weather on Earth: towering “fire clouds” generated when extreme wildfires burn hot enough to brew their own thunderstorms.
Pyrocumulonimbus clouds crackle with lighting in imagery captured over Utah and Colorado by the GOES-18 satellite in early July 2026.
CSU/CIRA & NOAA
Smoky and crackling with lightning, these unique storms can create blind spots for aviators above and spark new blazes below. Measuring and mapping the dangerous storms as they develop in real-time will help scientists forecast them in the future. Several aircraft, including NASA’s high-altitude ER-2, flying out of Montana, will carry a large suite of instruments over wildfire-generated storm systems. Among them will be two state-of-the-art infrared wildfire trackers, which were developed at NASA’s Jet Propulsion Laboratory (JPL) in Southern California and will be flying as part of the agency’s FireSense program.
Testing the air over farmland, megacities
Agricultural emissions represent an important and understudied part of Earth’s land and atmosphere systems. The FarmFlux mission, which kicks off this year, will deploy more than a dozen sensors to measure ozone, methane, ammonia, particulates, and other pollutants rising from agricultural lands and animal farms stretching from the Midwest to California’s Central Valley. These emissions affect human health, global climate, and stratospheric ozone. The mission is led by NASA’s Goddard Space Flight Center in Greenbelt, Maryland, along with Colorado State University, and Boston University.
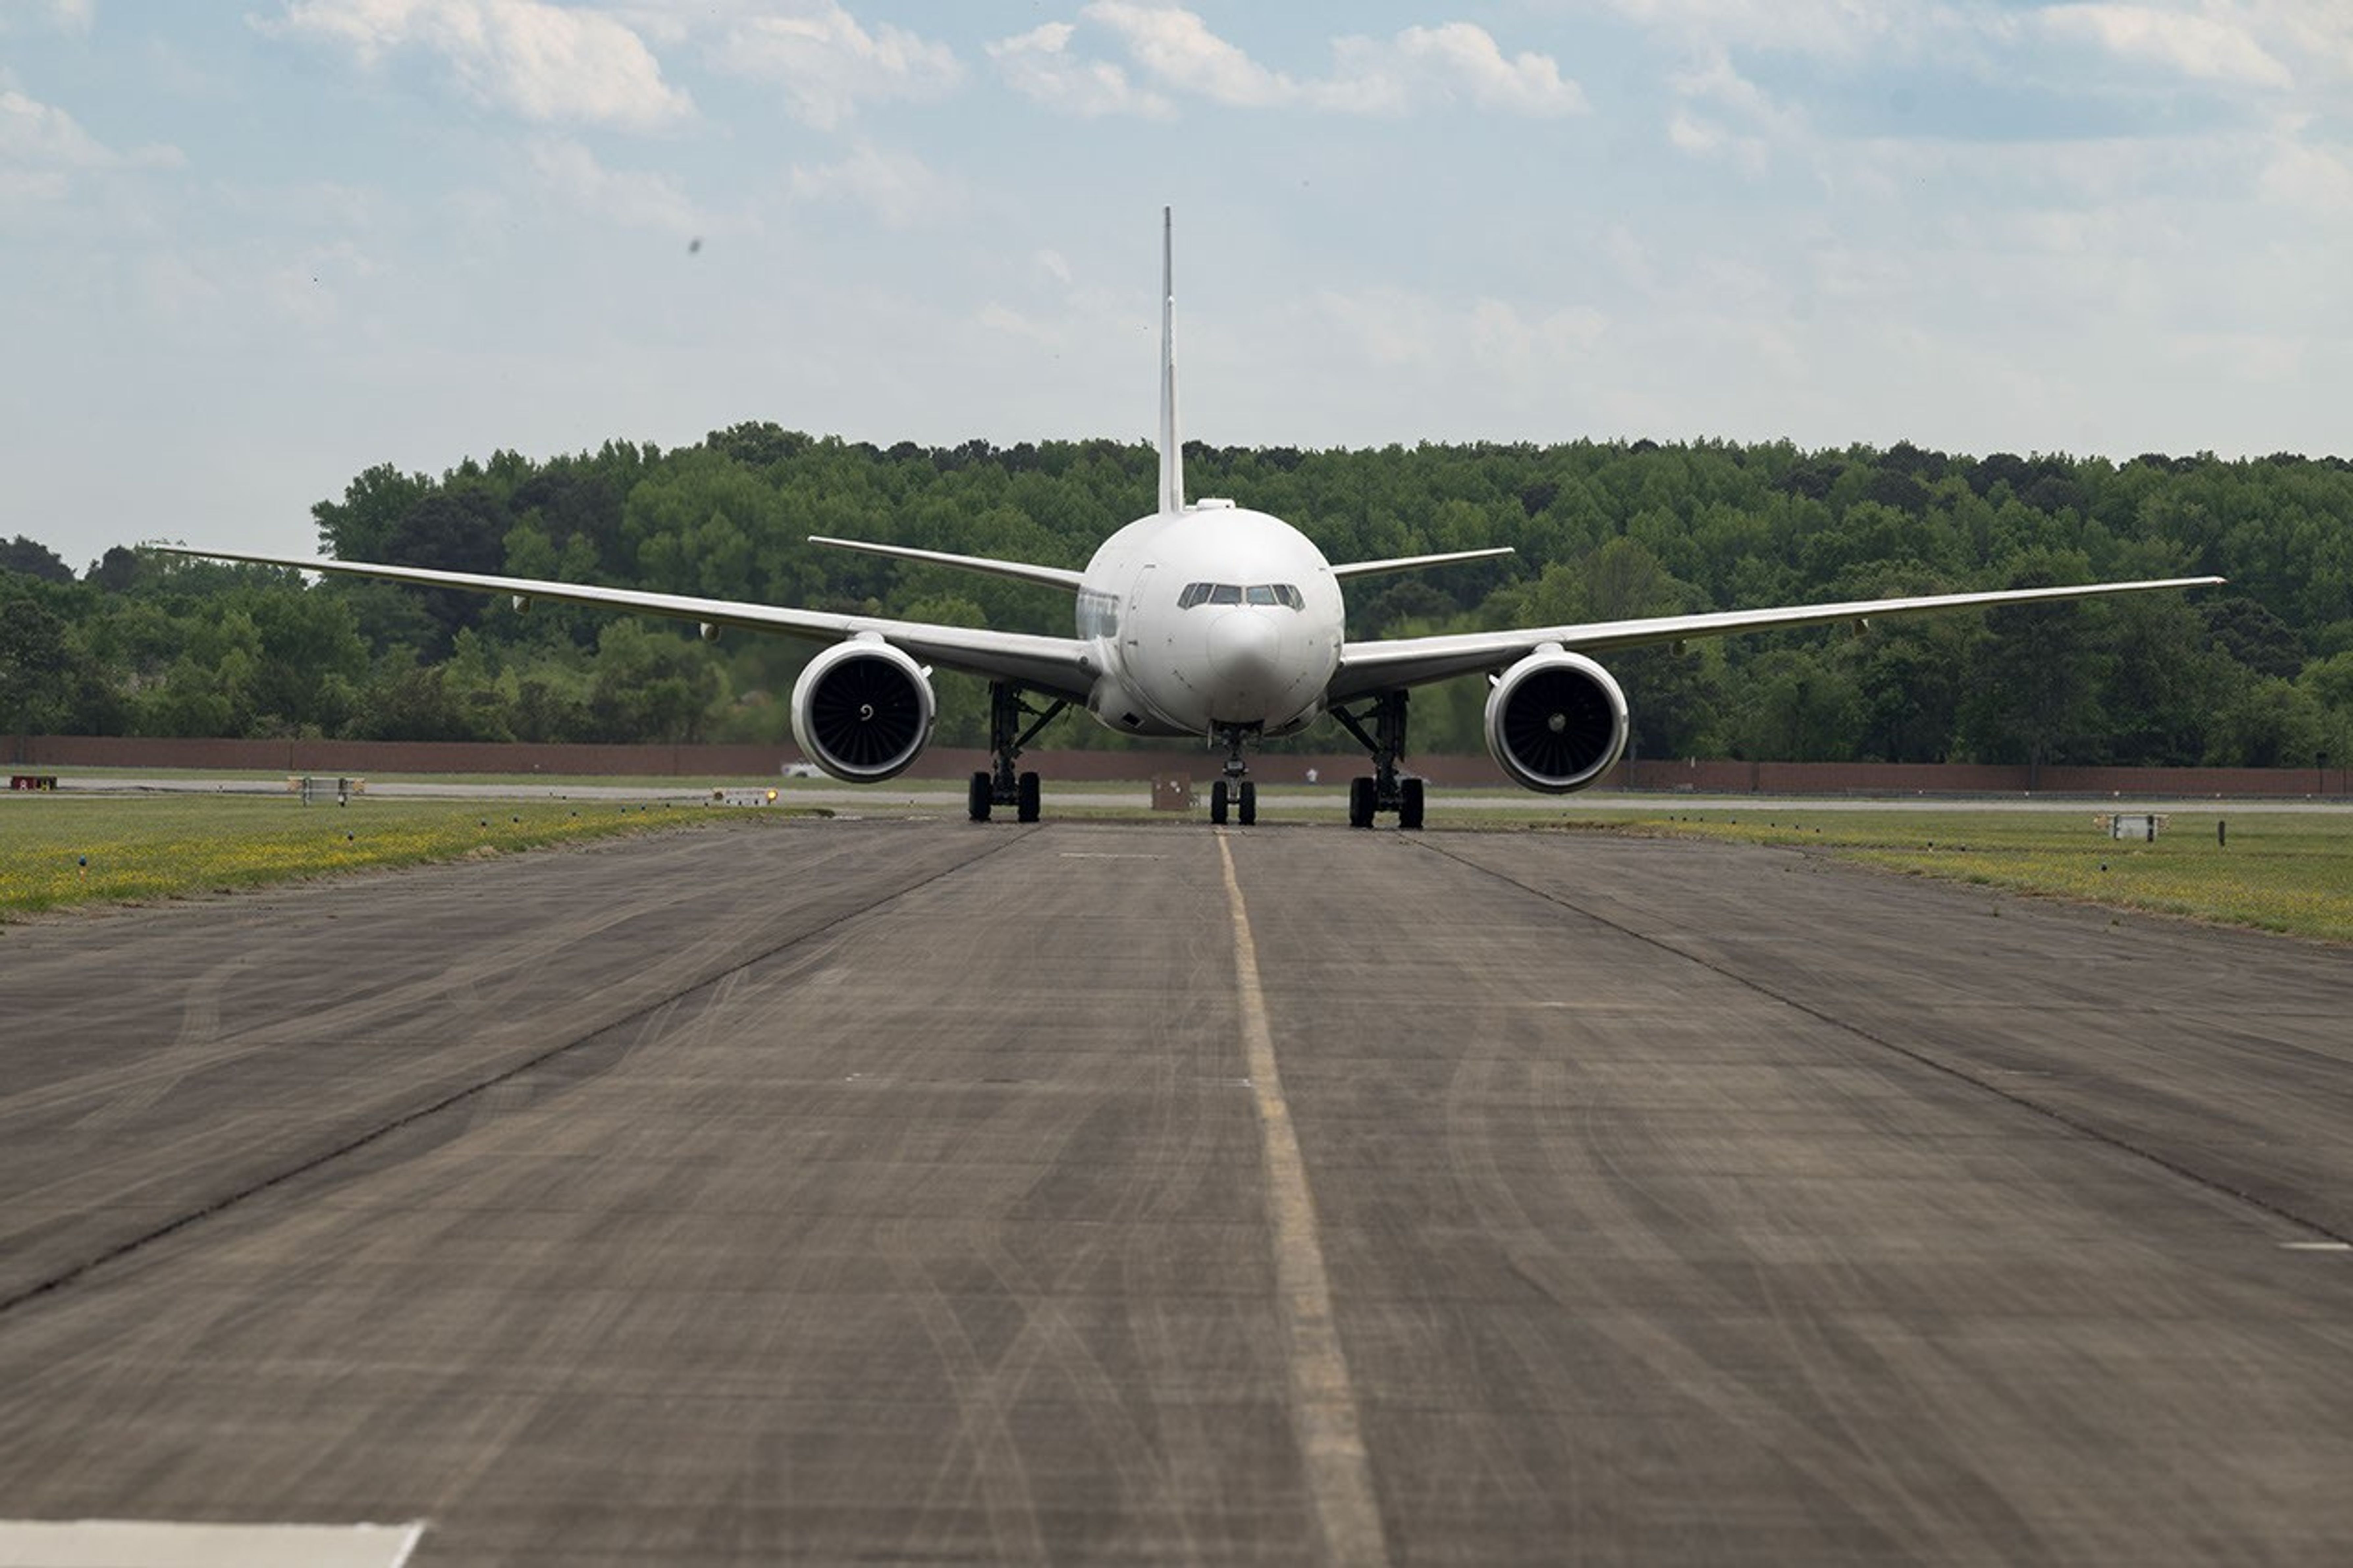
NASA’s 777 aircraft is gearing up to start science flights. Structural modifications – like enlarged cabin windows and instrument portals – have transformed the former passenger plane into a flying laboratory. It’s seen here at Langley Research Center in Hampton, Virginia, in April 2026.
NASA/Ryan Hill
Two North American cities with air quality concerns are Atlanta and Mexico City. But the causes differ, with weather and terrain playing a role. To explore these differences, the Hemispheric Airborne Measurements of Air Quality (HAMAQ) mission will investigate areas of poor air in the two capitals and test how satellite information can help forecasting and mitigation efforts. The team will deploy two aircraft at different altitudes: NASA’s P-3B will fly close to the surface, directly measuring fine particle and gaseous pollutants, while the recently acquired 777 science jet will soar high above, mapping pollution with remote sensors. NASA’s Langley Research Center in Hampton, Virginia, is leading the mission.
Fast-changing north
As the Arctic warms at least twice as fast as the rest of Earth, data collected today can help guide communities on the front lines of change.
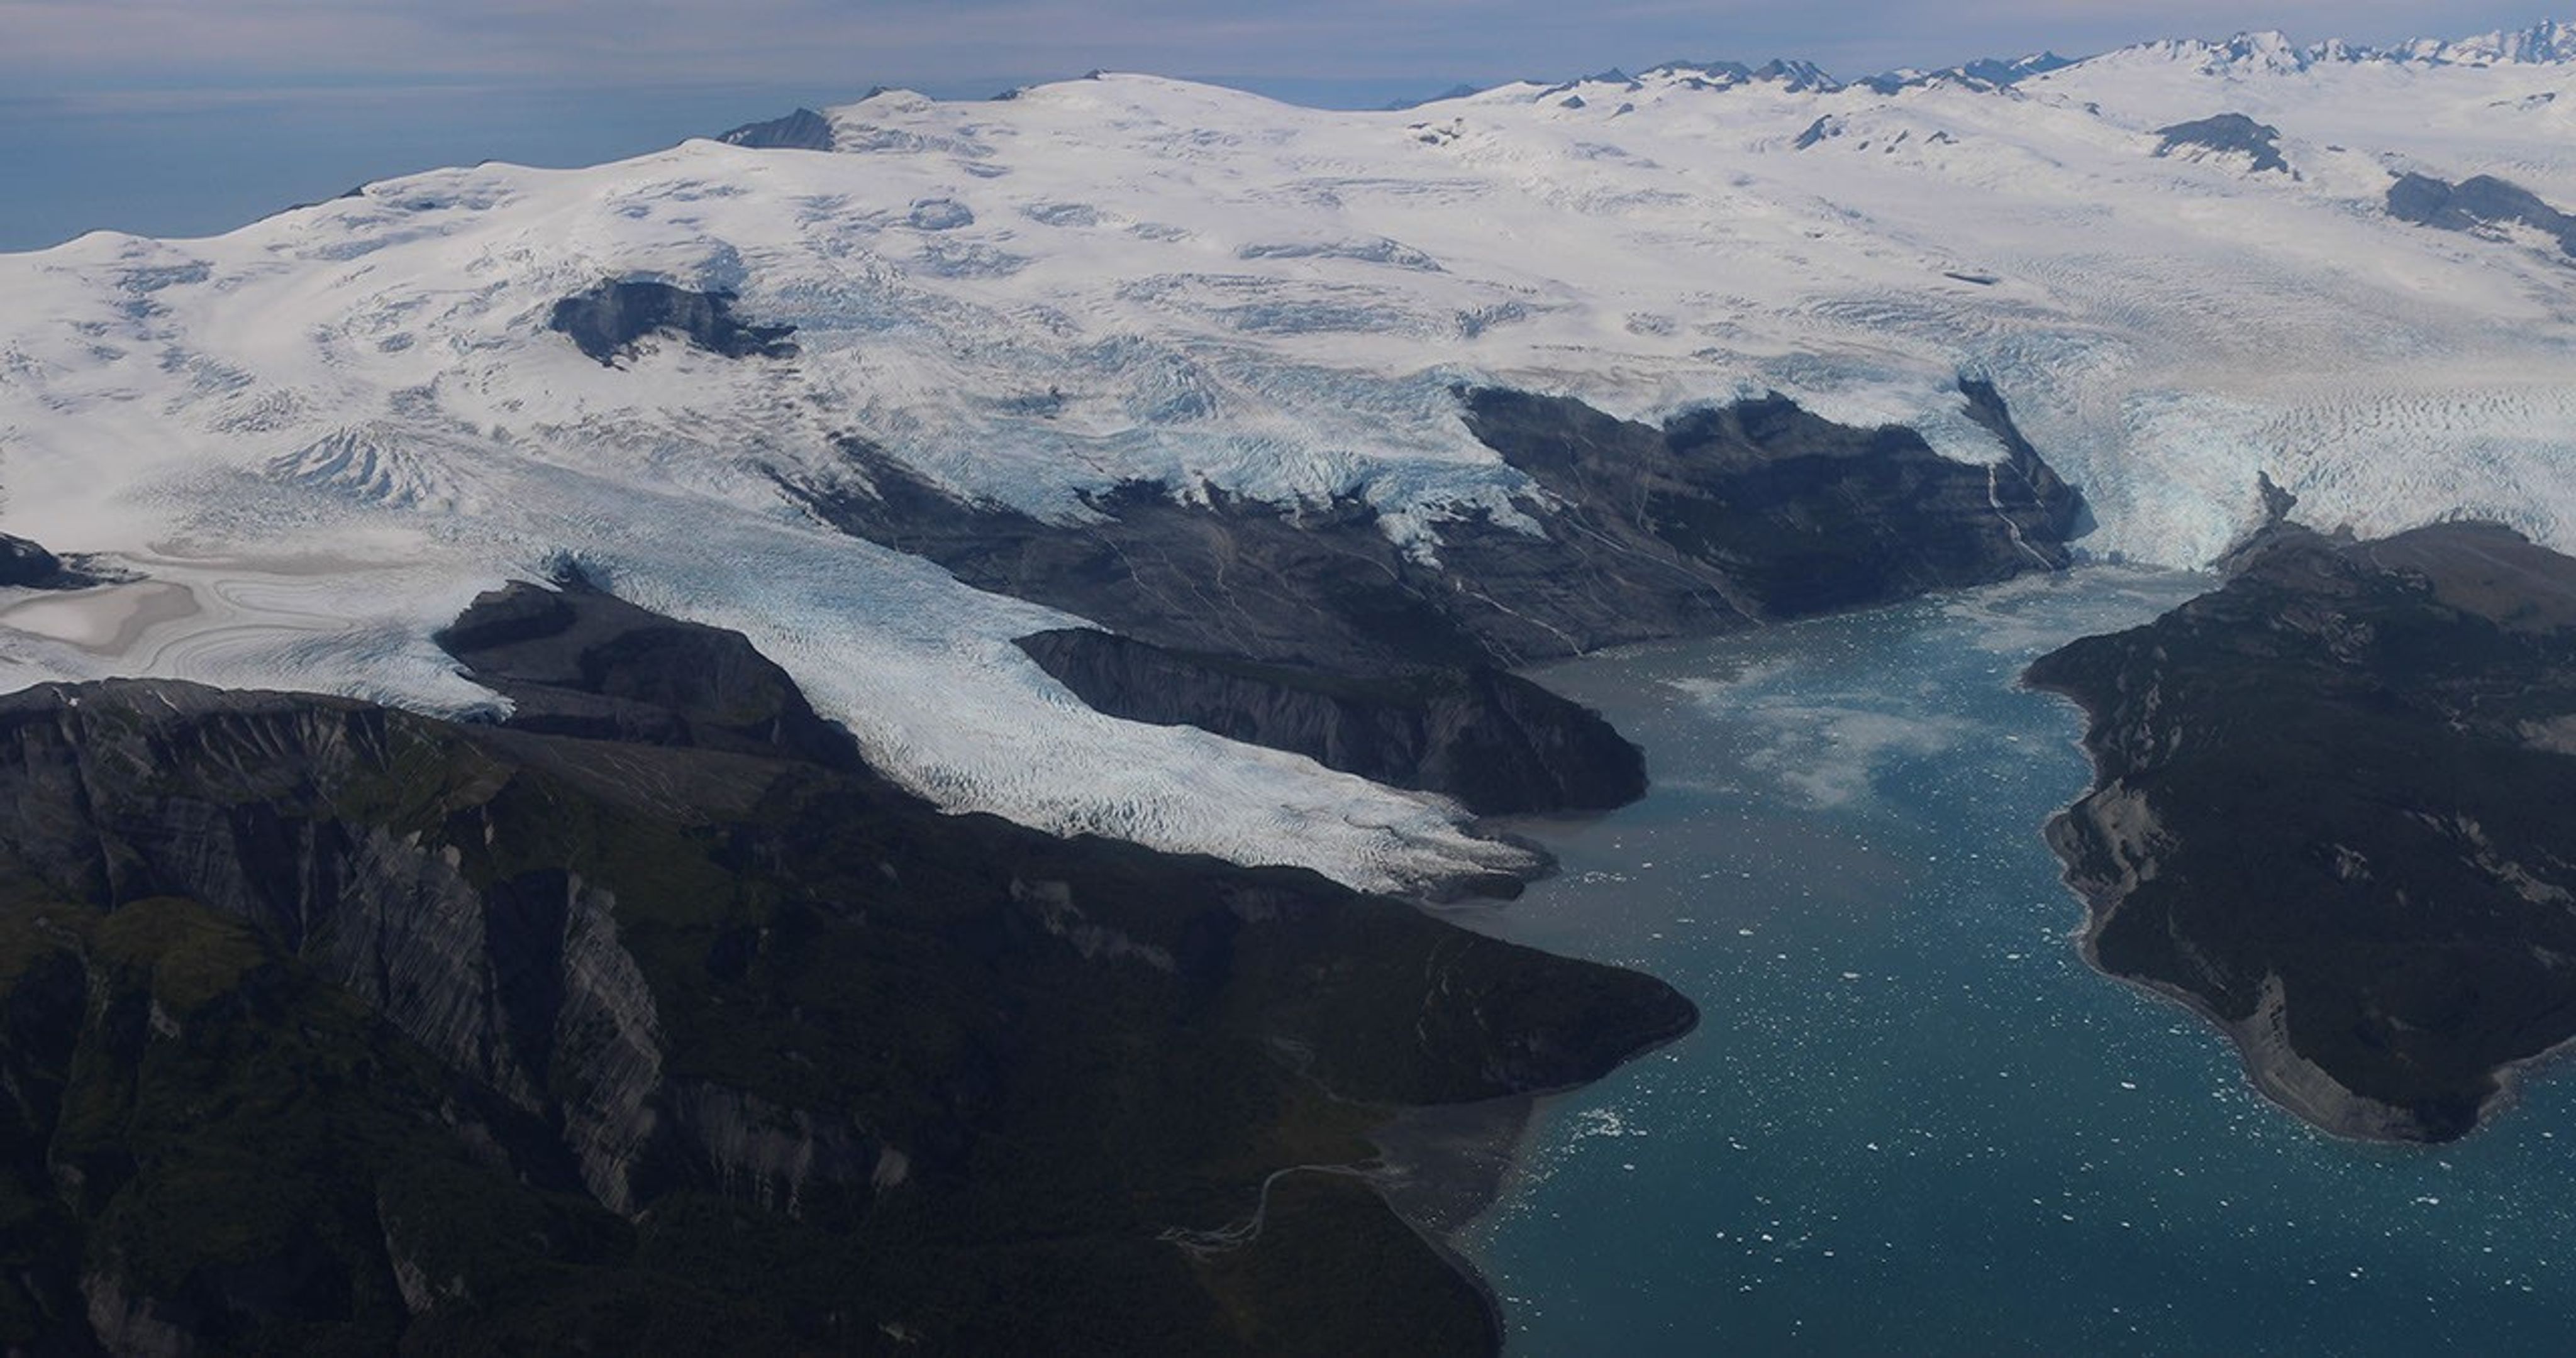
Alaska’s glaciers are losing ice and contributing to sea level rise. NASA is tracking the changes from land, air, and space.
NASA
The Snow4Flow campaign, led by the University of Arizona, seeks to measure and model how far and fast glaciers are retreating in the far north. Traversing remote icescapes across Alaska, the Yukon, Arctic Canada, Greenland, and Svalbard, Norway, they’ll sound both the near-surface and frozen depths of hundreds of glaciers while flying over in a modernized WWII-era aircraft outfitted with a scanning laser altimeter and two custom radars. Their observations, combined with satellite data and advanced models of snowfall and glacier flow, will advance our understanding of how glaciers behave in different regions of the Arctic. The mission seeks to uncover not just what these glaciers look like beneath the surface today, but the processes that will drive changes in the future.
As permafrost thaws, rivers on the doorstep of the Arctic become conveyor belts of carbon and sediment. NASA Goddard, and the City College of New York lead a multidisciplinary team studying how rivers, lagoons, and estuaries across Alaska’s North Slope interact with the Arctic Ocean. The project, called Frontlines of Rapidly Transforming Ecosystems (FORTE) will combine optical and radar measurements from satellites, planes, high-tech research vessels, drones, and underwater autonomous systems to track microscopic marine life, water flow, and chemistry. The team will collaborate with local and tribal communities to sustain observations over time and apply NASA assets to address emerging local needs and decision-making priorities.
Landslide triggers
When a slow-moving landslide in California suddenly collapsed and buried a section of coastal highway in 2017, scientists at NASA JPL wanted to know how precipitation swings played a role. JPL studies how water infiltrates and destabilizes hillslopes all over the world. The Landslide Change Characterization Experiment (LACCE) project will combine airborne synthetic aperture radar with land-based sensors to track how slopes in California are responding to a world of intensifying droughts and downpours. The project also takes aim at emerging landslide hazards in Alaska, where rapidly retreating glaciers are accelerating slope movements that have the potential to create mega-tsunamis.
This series of images shows the collapse of the Mud Creek landslide in May 2017 along the Big Sur coast in Central California, and the subsequent repairs to Highway 1, which was damaged during the event.
Andy Ritchie/USGS Pacific Coastal and Marine Science Center
NASA’s Earth Venture Suborbital program, designed to be nimble and high impact, was established following a recommendation by the National Research Council in 2007. In the decades since, teams have studied phenomena, including blizzards, coral reefs, and ocean whirlpools.
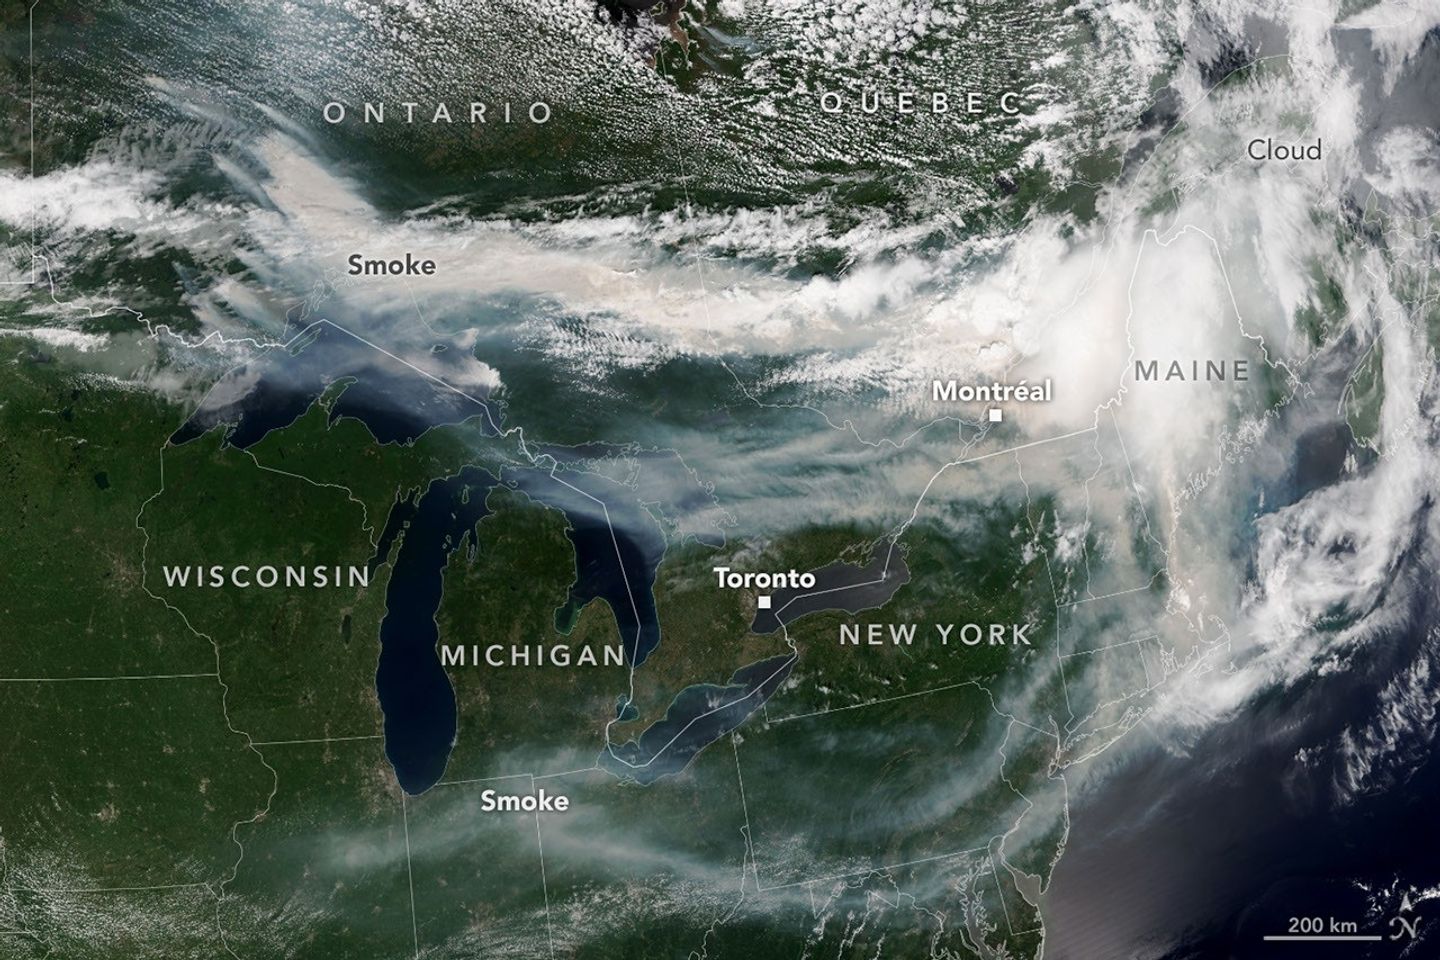
Smoke from wildland fires pours eastward over Canada and the U.S. in an image captured on the afternoon of July 14, 2026, by the VIIRS (Visible Infrared Imaging Radiometer Suite) on the NOAA-21 satellite.
NASA Earth Observatory/Lauren Dauphin
After a slow start to Canada’s 2026 fire season, activity picked up by the end of June amid dry, warm conditions and returned closer to the 25-year average. By mid-July, almost 850 fires were actively burning across the country, according to the Canadian Interagency Forest Fire Centre. More than 180 of those were burning in Ontario.
This NOAA-21 image, acquired on the afternoon of July 14, 2026, shows smoke billowing from the Ontario fires. Winds carried the smoke primarily southeast over much of the southern part of the province, as well as parts of Quebec and the U.S. Midwest and Northeast, tinting the sky shades of gray and yellow and the Sun orange in many areas.
The smoke’s impact on air quality varied, depending largely on altitude. In areas where smoke was high in the atmosphere, air quality impacts were negligible; where it drifted closer to the ground, conditions worsened. Air quality in Toronto, for instance, reached unhealthy levels, according to AirNow. People in the southern parts of the province were also grappling with a heat wave, compounding the health risks.
Much of the smoke came from fires in Northwestern Ontario, where eight blazes saw significant growth on July 13 and 14. The fires prompted officials to issue evacuation orders for several communities in this part of the province, according to news reports.
As of July 14, fires across Canada have burned 1.9 million hectares (4.7 million acres) since the start of the year—still well below the season totals from the extreme fire years of 2023 and 2025. How the rest of the season plays out remains to be seen. A seasonal fire outlook—compiled by wildland fire experts from the U.S., Canada, and Mexico—shows where fire conditions are more or less likely through July, August, and September.
NASA Earth Observatory image by Lauren Dauphin, using VIIRS data from NASA EOSDIS LANCE , GIBS/Worldview , and the Joint Polar Satellite System (JPSS). Story by Kathryn Hansen.
Downloads
July 14, 2026
JPEG (3.96 MB)
References & Resources
AirNow (2026, July 15) Wildfires. Accessed July 15, 2026.

 Login
Login