Normal view

There are new articles available, click to refresh the page.
Before yesterdayMain stream

Peatland Fires Darken Skies in Indonesia

3 September 2026 at 00:01


No Fire Detections
Fire Detections

Thick gray plumes of smoke stream from large numbers of fires scattered across the island of Borneo.
NASA Earth Observatory / Lauren Dauphin

The locations of MODIS fire detections are depicted with small red circles. Most are visible on the southern side of the island.

Thick gray plumes of smoke stream from large numbers of fires scattered across the island of Borneo.
NASA Earth Observatory / Lauren Dauphin
The locations of MODIS fire detections are depicted with small red circles. Most are visible on the southern side of the island.

No Fire Detections

Fire Detections


If there were an apex predator among fires, tropical peatland fires would be a top contender. These fires, which burn in dried wetland soils, are slow-burning, highly polluting, and notoriously difficult to extinguish because they smolder at low temperatures and often burn underground through expansive deposits of peat. By one estimate, peat fires generate three times more fine particulate matter than other tropical forest fires, five times more sulfur dioxide, three times more organic carbon, and two times more methane and carbon monoxide.

Fire season was underway in Indonesia when the MODIS (Moderate Resolution Imaging Spectroradiometer) on NASA’s Aqua satellite captured this image on September 1, 2026. In the map on the right, each red dot depicts one “fire detection.” A fire detection is a pixel in which the sensor and an algorithm determined there were thermal anomalies indicative of fire. Multiple detections can be generated by a single fire.

Peat fires are a recurring challenge in Indonesia, which is home to about 36 percent of the world’s tropical peatlands. When parched by drought, the archipelago’s peat landscapes have become unrelenting infernos on several occasions over the past three decades, with fires producing blankets of smoke for weeks on end and upending daily life for millions of people.

While fires occur in Indonesia every year, previous El Niño years—1997 and 2015 especially—produced the most extreme burning in recent decades. The climate pattern, assessed by NOAA as present and strengthening in August, typically leads to sharp reductions in rainfall in Indonesia, particularly when combined with a positive phase of the Indian Ocean Dipole, which was also present.

“Indonesia is only about three weeks into its fire season, but we’re seeing fire activity track sharply upward, similar to 2015,” said Robert Field, a Columbia University researcher who developed a tool called the Global Fire Weather Database that produces experimental, real-time fire weather forecasts. “The strong El Niño is making the dry season drier over the fire-prone parts of the country and exacerbating burning—just as we anticipated it would,” he said. In 2015, after burning for more than three months, Indonesia’s fires had released 1.75 billion tons of greenhouse gas equivalents—more than Japan emits in a year. As of September 2, Indonesia’s 2026 fires, having burned for about a month, have released roughly 10 percent as much as the 2015 fires.          

As in 2015, Indonesia was in the midst of a severe and widespread drought in summer 2026. About 90 percent of the country received little to no rainfall in early August, according to data from the Indonesian meteorological agency. Normally, it’s too wet for fires to spread through underground peat deposits in Kalimantan, Sumatra, and Papua, but they can in dry conditions. “Surface fires are less of a concern, but when fires get underground, they just won’t stop,” Field said. “They’ll keep burning until the rains come in October or November.” 

The Indonesian government uses NASA and NOAA observations from the MODIS and VIIRS sensors to track active fires in near-real-time. Indonesia’s Ministry of Forestry MODIS- and VIIRS-based fire-monitoring platform SiPongi, for instance, tallied 946 hotspots on August 31, 2026.

However, it’s difficult for MODIS and VIIRS to detect fires through thick smoke or clouds, within the forest understory, or underground in peat deposits. When Indonesian fires become the most intense, the number of fires recorded by VIIRS or MODIS can actually decrease. “The worst smoke events, paradoxically, can be the hardest to observe from space with MODIS and VIIRS,” said Mark Cochrane, an ecologist at the University of Maryland Center for Environmental Science who has conducted field research on peat fires in Indonesia for nearly a decade.

The large-scale construction of irrigation canals and drainage of peat swamps in the 1990s, part of an effort to establish massive rice farms, contributed to the flammability of the region today by significantly lowering the water table in wetland areas, Cochrane said. He also noted that oil palm and other plantation forestry is common in this region. Yet after an unusually grim fire season in 2015, governments and other organizations have worked to dam up some irrigation canals and restore wetlands. There have also been renewed efforts to improve firefighting capacity and reduce the number of fires that people accidentally ignite.

“This year will be a real stress test of the measures that were put in place after 2015,” said Shi Jun Wee, a University of Maryland graduate student. Wee is working on a team partnering with NASA and MapBiomas to develop new algorithms and techniques to detect more understory fires than MODIS and VIIRS can by tapping into shortwave infrared observations from Landsat and Sentinel-2 satellites. As the fires progress, he plans to track developments using NASA’s Worldview data browser, FIRMS (Fire Information for Resource Management System), HLS (Harmonized Landsat and Sentinel-2) observations, and GFED (Global Fire Emissions Database).

On the ground in Indonesia and neighboring countries, the smoke is already causing widespread disruptions. Indonesian officials have warned that large swaths of the population have been exposed to hazardous smoke. Some schools started shifting to remote learning, nine national parks have closed, and several flights have been delayed due to heavy smoke, according to news reports.

“People tend to focus on these fires during an El Niño and then forget about them,” Cochrane said. “We need sustained focus, even during the years when they aren’t as bad, to solve this,” he said. “These fires create a tremendous amount of emissions.”

NASA Earth Observatory image by Lauren Dauphin, using MODIS data from NASA EOSDIS LANCE and GIBS/Worldview. Story by Adam Voiland.

Downloads

The locations of MODIS fire detections are depicted with small red circles. Most are visible on the southern side of the island.

September 1, 2026

JPEG (3.34 MB)

References & Resources

You may also be interested in:

Stay up-to-date with the latest content from NASA as we explore the universe and discover more about our home planet.

Fighting Fire With Fire

3 min read

In fire-prone ecosystems in Australia’s Northern Territory, prescribed burns are lit to minimize the severity of fires later in the…

Article

Smoke Streams Across Eastern Washington

3 min read

Wildland fires in early August 2026 pushed air quality to unhealthy levels, destroyed hundreds of structures, and triggered mandatory evacuations…

Article

Cottonwood Fire Chars Utah

5 min read

The blaze burned more than 150 square miles and swept through parts of a ski resort.

Article

Chasing Fire Clouds in Utah

17 August 2026 at 00:01
Natural Color
Brightness Temperature
Textured gray wildfire smoke streams east from a fire burning near Fishlake National Forest. A dark shadow is visible to the east of a tall plume near the fire front.
NASA Earth Observatory/Michala Garrison
A data visualization shows the cloud-top brightness temperature of the same scene. Tall, cold smoky clouds appear white, and warmer plumes at lower heights appear purple.
NASA Earth Observatory/Michala Garrison
Textured gray wildfire smoke streams east from a fire burning near Fishlake National Forest. A dark shadow is visible to the east of a tall plume near the fire front.
NASA Earth Observatory/Michala Garrison
A data visualization shows the cloud-top brightness temperature of the same scene. Tall, cold smoky clouds appear white, and warmer plumes at lower heights appear purple.
NASA Earth Observatory/Michala Garrison
Natural Color
Brightness Temperature
A smoke-infused pyrocumulonimbus (pyroCb) rises from the Widemouth 2 fire in Utah in these images captured by the MODIS (Moderate Resolution Imaging Spectroradiometer) on NASA’s Aqua satellite. The left image is natural color; the right image is false color, revealing cloud-top brightness temperatures below -40°C, a commonly used threshold for identifying pyroCbs. NASA Earth Observatory images by Michala Garrison.

Scientists have long known that volcanoes can launch large quantities of particles into the stratosphere. In the past few decades, it has become clear that wildfires do this, too, by generating towering, smoke-infused pyrocumulonimbus (pyroCb) clouds.

The largest pyroCbs are stunning weather-making features that generate massive thunderheads capable of unleashing lightning, hail, and heavy rain. A growing body of research shows that pyroCbs can also leave an outsized imprint on the upper atmosphere by channeling pulses of particles and gases into the stratosphere’s mostly dry, cloudless confines. Once there, smoke can spread widely and linger for months or years, sometimes circling the globe and likely influencing the ozone layer and Earth’s energy budget.

Understanding these enigmatic and dangerous clouds is why a team of atmospheric scientists—part of a NASA mission called INSPYRE (INjected Smoke and PYRocumulonimbus Experiment)—is spending the summer chasing them with NASA’s ER-2 aircraft, NSF/NCAR’s GV, and a suite of truck-based sensors. The team completed one of its first sampling runs of the summer on August 3, 2026, when the GV flew through a high-altitude pulse of smoke from the Widemouth 2 fire, one of Utah’s largest so far this year.

Lightning ignited the fire on July 27, 2026, but it remained relatively small until August 2, when it more than doubled in size amid intense winds and hot, dry conditions. That afternoon, soon after it had produced two pyroCb bursts, the MODIS (Moderate Resolution Imaging Spectroradiometer) on NASA’s Aqua satellite captured this image (above), showing a chimney of high-altitude cloud and smoke casting a shadow on low-altitude smoke below.

These bursts propelled clouds high enough that Aqua measured cloud-top brightness temperatures well below −40°C, a common threshold for identifying pyroCbs and a sign that the cloud tops were bubbling to the top of the troposphere and sometimes into the stratosphere. The brightness temperature measurements “reveal two discrete pulses of pyroCb action,” said Michael Fromm, a scientist at the U.S. Naval Research Laboratory. “The westernmost is the youngest pulse and stands out in the visible imagery by virtue of its shadow.”

Though relatively routine and minor, this pyroCb event followed a pre-dawn pyroCb from the same fire, imaged by the NOAA weather satellite GOES-West. “Morning pyroCbs are much more unusual,” Fromm said, because they don’t benefit from daytime heating that helps fuel convection. In this case, however, there appeared to be enough atmospheric instability and water vapor in the air to allow for pyroCb development. 

Multiple pyroCbs in a single day could have added unwanted complexity for forecasters and fire officials battling the blaze and organizing evacuations, said David Peterson, INSPYRE’s principal investigator. “Minimizing that sort of uncertainty for fire forecasters is a big part of the reason we’re out here studying this,” he added.

Remote sensing experts like Peterson and Fromm routinely study pyroCbs from afar with satellites, but it’s less common for pilots to chase and sample smoke plumes just hours after they form. In this case, the GV aircraft, on the ground in Colorado when the Widemouth 2 fire blew up, made a beeline for a high-altitude smoke plume as it drifted over New Mexico on August 3. The instruments on the plane sampled smoke at roughly 12 kilometers (8 miles) above the surface, collecting data at a height that isn’t typically incorporated into forecast models.

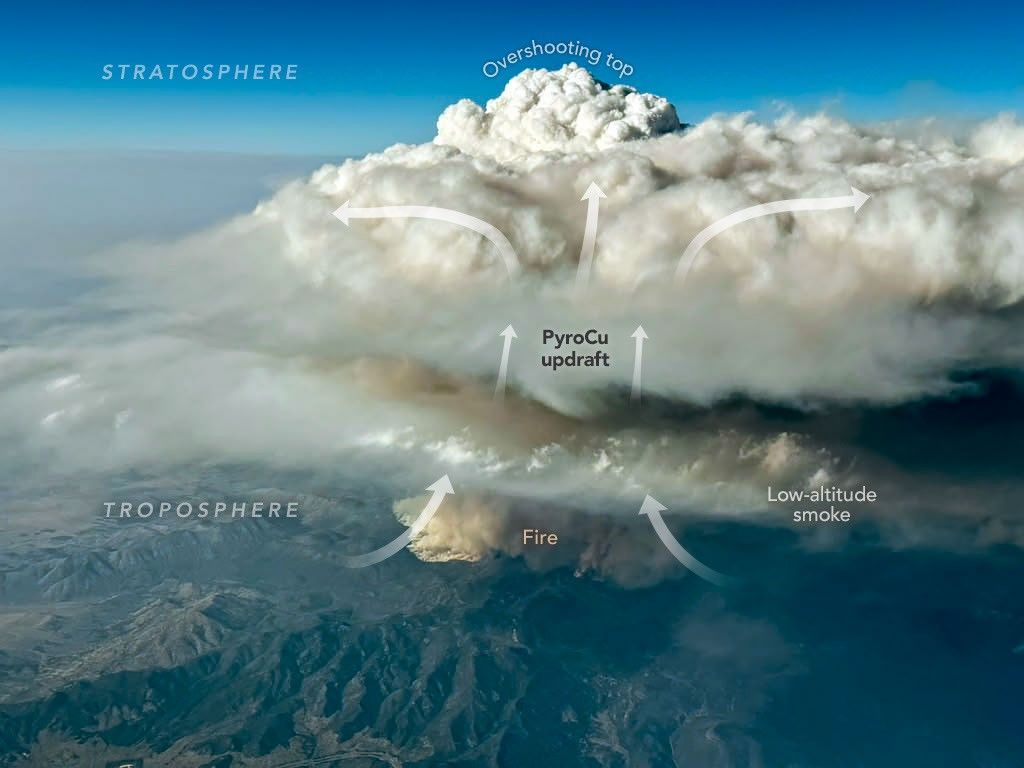
An aerial image shows a thick, puffy white cloud rising high above a patch of darker smoke visible near a surface of variable mountainous terrain.
A photo of the Widemouth 2 fire taken from an INSPYRE aircraft during a sampling flight on August 3, 2026, shows a smoke-infused cloud rising high above the fire.
Bernadett Weinzierl/University of Vienna

During that mission, a scientist on board captured this image (above) of a pyrocumulus (pyroCu) billowing up over the Widemouth 2 fire. While not as tall or energetic as pyroCbs, pyroCus are precursor clouds that share many of the same characteristics. Here, heat from the fire is fueling strong convective updrafts, forming a towering cloud with puffy overshooting tops that poke into the upper troposphere as lower-altitude smoke drifts below.

Satellites excel at identifying pyroCbs by measuring the temperature of the cloud tops that form above smoke plumes. Using this technique, researchers have established that wildfires produce about 70 pyroCbs per year, many in dense forests of Canada and Russia, though plenty also occur in grasslands and savannas in the United States and Australia. So far in 2026, Fromm and colleagues have identified at least 13 in the continental United States.

Since one of the first pyroCbs appeared in the scientific literature in the early 2000s, scientists have cataloged well over 700 events, and they now believe that wildfires may contribute up to 25 percent of the black carbon and organic aerosols in the lower stratosphere. The sheer frequency of pyroCbs means that the total mass of particles they inject over the course of a wildfire season may rival that of large volcanic eruptions.

Still, many questions about the enigmatic clouds remain unanswered. It isn’t clear what vegetation is most likely to fuel pyroCbs, why some form more lightning than others, why they form in only a small fraction of fires, and how to accurately forecast them.

“Whether it be their dangerous manifestations on the ground or their long-lasting imprint on the upper troposphere and lower stratosphere,” Fromm said, “pyroCbs continue to surprise us.”

NASA Earth Observatory images by Michala Garrison, using MODIS data from NASA EOSDIS LANCE and GIBS/WorldviewPhoto by Bernadett Weinzierl/University of Vienna. Story by Adam Voiland.

Downloads

Textured gray wildfire smoke streams east from a fire burning near Fishlake National Forest. A dark shadow is visible to the east of a tall plume near the fire front.

August 2, 2026: Natural Color

JPEG (1.63 MB)

A data visualization shows the cloud-top brightness temperature of the same scene. Tall, cold smoky clouds appear white, and warmer plumes at lower heights appear purple.

August 2, 2026: Brightness Temperature

JPEG (1.07 MB)

An aerial image shows a thick, puffy white cloud rising high above a patch of darker smoke visible near a surface of variable mountainous terrain.

August 3, 2026

JPEG (319.28 KB)

References & Resources

You may also be interested in:

Stay up-to-date with the latest content from NASA as we explore the universe and discover more about our home planet.

Cottonwood Fire Chars Utah
5 min read

The blaze burned more than 150 square miles and swept through parts of a ski resort.

Article
Ontario Wildfire Smoke Moves East
3 min read

Canadian wildfires sent plumes of smoke streaming over Ontario, Quebec, and parts of the U.S. Midwest and Northeast.

Article
Cascade Volcanoes Shrouded in Smoke
3 min read

From the International Space Station, astronauts photographed Mount Hood and Mount Rainier as wildfire smoke spread across the Pacific Northwest…

Article
❌
❌