A Cambridge-led study suggests comets rarely delivered useful quantities of life’s molecular ingredients to early Earth because impacts destroyed them and surviving material wouldn’t have stayed concentrated at the surface for long.
An anonymous reader quotes a report from CBS News: Greenhouse gas concentrations in the atmosphere rose to record highs in 2025, locking in climate impacts that will persist for centuries, the United Nations said on Tuesday. Levels of the three main greenhouse gases -- the climate-warming carbon dioxide, methane and nitrous oxide -- all rose to unprecedented figures in 2025, the U.N.'s weather and climate agency said. The World Meteorological Organization said the rise would lead to more long-term temperature increases for the planet.
The bulletin looks at greenhouse gas concentrations -- the amount of those gases in the atmosphere -- rather than new annual emissions amounts as the world burns more coal, oil and gas. In 2025, carbon dioxide concentrations were at 426.8 parts per million (ppm); methane at 1,948 parts per billion, and nitrous oxide at 339.1 parts per billion. That takes them, respectively, to 153%, 267% and 126% of the pre-industrial levels witnessed before 1750. Of the three major greenhouse gases, CO2 accounts for about 66% of the warming effect on the climate.
Around half of the total CO2 emitted each year remains in the atmosphere; the rest is absorbed by the land and oceans. From 2024 to 2025, the global average concentration of CO2 rose by 2.8 ppm -- smaller than the record surge from 2023 to 2024 of 3.6 ppm. WMO senior scientific officer Oksana Tarasova said this reflected the "recovery of the land carbon sinks and reduced fire carbon emissions in 2025 after the strong 2023/2024 El Nino," the naturally occurring, climate-warming weather phenomenon. "However, a 2.8 ppm annual increase is still a substantial addition of carbon to the atmosphere from fossil fuel burning." It is also above the average growth rate for the past decade of 2.6 ppm -- a figure that stood at 0.8 ppm in the 1960s. "Another year, another new record," said WMO Deputy Secretary-General Ko Barrett. "Greenhouse gases are trapping an unprecedented amount of heat in the atmosphere, providing energy for more extreme weather and associated risks to our economies and societies.
Further reading: UN Says Breaching 1.5C Warming Limit Is 'Imminent and Unavoidable'
Brazil's 80-year-old president Luiz Inácio Lula da Silva was re-elected Sunday, reports the Guardian, "defeating his far-right opponent, Flávio Bolsonaro, to claim a historic fourth term in power."
And the results could impact the climate, suggests the Associated Press, since under da Silva the annual deforestation rate in the Amazon fell to its lowest level since records began in 1988:
Official satellite data showed the rainforest lost 3,335 square kilometers (1,300 square miles) from Aug. 2025 through July 2026, the period used to calculate the annual rate...
During Jair Bolsonaro's presidency, from 2019 to 2022, Amazon deforestation surged by about 60%, with more than 45,000 square kilometers (17,400 square miles) cleared, according to official data. Under Lula, deforestation has fallen 71% since 2023, the government said. One of Lula's first moves after taking office in January 2023 for a third, non-consecutive term was to revive the Action Plan for the Prevention and Control of Deforestation in the Legal Amazon, known by its Portuguese acronym, PPCDAm. Launched in 2004 during his first administration, the plan had been shelved under Bolsonaro....
The plan has four pillars: strengthening monitoring and enforcement; promoting a sustainable economy; managing protected areas and determining how undesignated public forests should be used; and using regulations and financial incentives to curb deforestation. Measures included restoring sanctions for illegal forest clearing detected by satellites, a practice seen as the most effective tool to curb deforestation that was halted under Bolsonaro. The government also proposed barring properties with illegal deforestation from receiving bank loans and allocated more funding to priority Amazon municipalities that demonstrated reductions in forest loss. It also funded efforts to fight environmental crime and develop subsidized credit for sustainable businesses in the Amazon...
Deforestation and other land-use changes are Brazil's largest sources of greenhouse gas emissions, which drive global warming. The stakes are especially high in the Amazon, which stores vast amounts of carbon dioxide and generates atmospheric moisture that helps regulate weather far beyond South America... Degradation from wildfires, logging and drought affects about 40% of the Amazon and has outpaced clear-cutting in recent years. A strong El Niño, a periodic warming of the equatorial Pacific, could intensify those threats in 2026 and 2027 by bringing hotter, drier conditions that fuel wildfires.
The article notes that Lula's reelection campaign promised zero net deforestation by 2030, plus restoration to offset all forest loss, legal or illegal.
For the first time, the UN has declared that exceeding the Paris Agreement's 1.5C warming limit is "imminent and unavoidable." "We are now saying this window has closed, but we can open it again by making the overshoot as brief as possible," UN Environment Program Executive Director Inger Andersen said on a call with reporters. "This is about how to find a way back as shortly and as quickly as possible with as limited an overshoot as possible." CNN reports: Past reports have examined the distance between countries' emissions reduction commitments and what it would take to limit global warming to 1.5 C above preindustrial levels. However, this year's report redefines the gap. Instead, it examines new emissions overshoot scenarios, and what it would take to limit peak warming to just 1.7 to 1.8 degrees C before bringing temperatures back down to 1.5 C through emissions cuts and the use of carbon removal technologies.
The report makes clear that every additional fraction of a degree of warming above 1.5 C "raises the risk of irreversible changes including in ice sheets, permafrost carbon, ocean circulation, and coral systems, along with devastating human impacts." Each added fraction of a degree of warming can have an "immense" impact "as measured in terms of damage, cost and loss of lives," said climate scientist Michael Mann of the University of Pennsylvania. Mann was not involved in producing the UNEP report.
According to the UNEP, which is based in Nairobi, the lowest overshoot scenario would keep peak warming to between 1.7 and 1.8 degrees C and return global average temperatures to at or below 1.5 C by 2100. However, to follow such a pathway, global greenhouse gas emissions would need to be slashed by far more than anything currently on the table at the upcoming COP31 talks. This would require an 18% cut by 2030, 45% by 2035, and 69% by 2040, relative to 2025 levels.
Meeting this lowest-possible overshoot scenario would require a tripling of renewable electricity capacity by 2035, and dramatic cuts to fossil fuels, including the phaseout of coal by 2040, the report states. In addition, there would need to be a major scaling up of carbon removal technologies, which so far have not been proven to work at such a large scale. In stark contrast to these figures, the fulfillment of existing emissions reduction pledges would only yield a 5-to-8% emissions cut by 2030 and an 11-to-15% reduction by 2035, the report found. This would be associated with a peak warming of about 2.6 degrees C.
If countries simply follow their current policies, then warming could reach a peak of about 2.8 C. That estimate has increased since last year, in part because of the withdrawal of the United States from the Paris Agreement and retraction of its emissions reduction commitments, the report states. Even the scenario that assumes countries meet their existing reduction commitments, and nations with net-zero pledges succeed in fulfilling them, still brings warming to a peak of 2.1 C.
Gizmodo reports:
Roughly 84.4% of the world's coral reefs suffered bleaching-levels of heat stress during the last major marine heat wave from January 2023 to September 2025, with over half already lost compared to coral coverage in the 1950s... But there's some good news, thanks to a new study published this Wednesday in the journal Science Advances: Marine ecologists at Stanford have discovered that bleached corals can be revived via contact with a healthy coral neighbor, who (like a good neighbor) shares their photosynthetic, symbiotic algae (Symbiodiniaceae) with their peers.
"This incredible new result — that fast and full recovery is possible in bleached coral — can inspire solutions that eventually may be scalable," [Fiorenza Micheli, a marine ecologist with Stanford's Center for Ocean Solutions and study co-author, told the journal Nature]... Unlike their controls, bleached coral in contact with healthy coral recovered in just eight weeks... [T]he surprise discovery of this method alongside the other techniques that marine conservationists are now actively pursuing — including the successful deep-freezing and revival of at-risk coral sampled from Hawaii — could offer threatened reefs the lifeline they need. Coral contact could super-charge other efforts, like the selective breeding of heat-tolerant corals and the cultivation of protected coral nurseries
Google is expanding its Android Earthquake Alerts System from 98 to more than 200 regions worldwide, using smartphone sensors to detect early earthquake activity and warn users before potentially dangerous shaking begins. The update also enhances the system's "Be Ready" alerts with estimated earthquake magnitudes, epicenter information, maps showing affected areas, and additional safety guidance. From a Google blog post:
Be Aware: A straightforward alert for estimated light shaking, letting you know an earthquake has been detected nearby.
Be Ready: A detailed alert for stronger shaking, alerting you to prepare to take action.
Take Action: A full-screen alert for moderate to heavy shaking, giving you immediate advice on how to stay safe.
We've built-out our Be Ready alert with new helpful guidance. In the coming months, you'll see a map with a radius of where we've detected shaking, estimated earthquake magnitude, action you can take, and a button to learn more about the earthquake as information comes in.
This visualization compares three ocean data products, sea surface temperature anomaly, apparent visible wavelength, and sea surface height anomaly, over the same months in 2025 and 2026. Signals of El Niño in each map are highlighted with pop-up labels.
Credits: NASA’s Scientific Visualization Studio
A phenomenon rarer than a solar eclipse and more powerful than any single storm system is unfolding this fall, and NASA is tracking it closely.
El Niño is a natural climate pattern that emerges roughly every two to seven years marked by warmer-than-normal water temperatures in parts of the equatorial Pacific. NASA scientists are keeping watch as it flips trade winds, redistributes ocean heat, scrambles rain patterns, and raises sea surface height across parts of the Pacific.
As of October, the National Oceanic and Atmospheric Administration (NOAA) has said that there’s an 83% chance that the strongest El Niño since 1950 is currently unfolding. People around the world, including farmers, firefighters, and coastal communities, are already experiencing the effects in different ways.
Follow along with these maps as NASA tracks El Niño from its epicenter in the equatorial Pacific Ocean.
Sea surface height in flux
Lower-than-normal sea level conditions appear blue, and higher areas are orange and red in this map, which compares the ocean in 2025 (a weak La Niña year) and 2026. The map was created using altimetry data from the Sentinel-6 satellites, which measure water height for the entire ocean every 10 days, down to fractions of an inch.
Credit: NASA’s Scientific Visualization Studio
One of the first clues appeared in satellite imagery in January 2026, when a swell of warm water called a Kelvin wave was spotted near Micronesia in the western Pacific. Kelvin waves are slow-moving pulses of water thousands of miles long. Like underwater freeways, they transfer heat from west to east across the Pacific. The warm water heats the air directly above it, making it rise. The change in air pressures weakens or even reverses the trade winds that typically blow in the opposing direction, from the Americas toward Asia, causing sea levels in the eastern Pacific to rise further, and waters to warm even more. This chain reaction signifies the start of an El Niño.
The map above shows that by early April, those Kelvin waves had reached the eastern Pacific, and sea surface temperatures had begun to warm. Warm water expands in volume, elevating local sea levels in some areas by as much as 1 to 1.3 feet (30 to 40 centimeters). The higher-than-normal water can be seen sloshing toward South America then moving up the coast to California. Sea levels that are six to eight inches (15 to 20 centimeters) lower than normal are visible around Indonesia and northern Australia.
“Kelvin waves are like the heartbeat of El Niño,” said Josh Willis, project scientist for sea level missions at NASA’s Jet Propulsion Laboratory in Southern California. “And our sea level satellites let us peer into the ocean and watch every beat.”
Scientists have used satellite altimetry to track the height of the ocean with ultraprecision since 1993. That unbroken data record continues today with the Sentinel-6 satellites. State-of-the-art radar altimeters aboard these satellites survey millions of square miles of ocean in a single day, complementing NOAA’s fleet of ocean sensors and buoys drifting and diving through the water below.
Warming Pacific waters
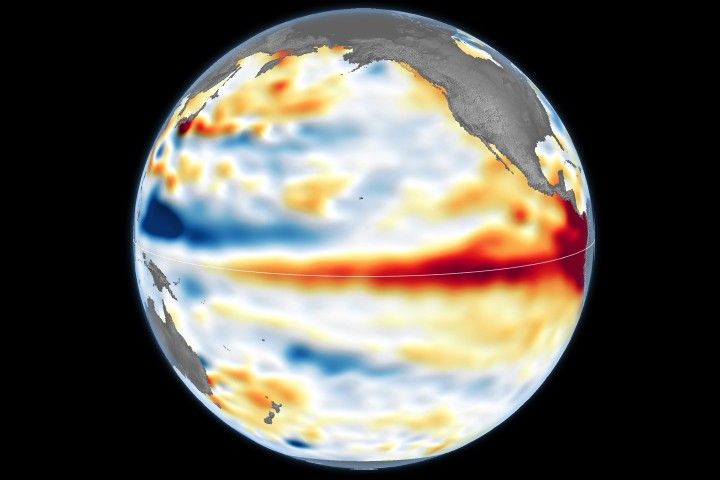
The map above compares sea surface temperatures in 2025 (a weak La Niña year) and 2026. Data are acquired from satellite instruments, buoys, and ship sensors.
Credit: NASA’s Scientific Visualization Studio
Warmer-than-normal seawater is one of the best-known indicators of El Niño. Already, sea surface temperatures in the eastern Pacific are about 3 degrees Fahrenheit (1.7 degrees Celsius) warmer than the long-term average and could jump another fraction of a degree in the coming months, Willis said.
Satellites carrying microwave and infrared radiometers can see through and around clouds to measure heat energy at the sea surface. Satellites in 2026 mapped the band of warmer-than-normal water as it expanded throughout the spring. The band, seen in dark red, stretches for millions of square miles from the heart of the Pacific to the coast of South America. Ocean temperatures can influence weather patterns around the world. Air above the water’s surface carries heat and moisture into the atmosphere, seeding rainstorms and rearranging weather patterns across the globe.
Ocean gets bluer
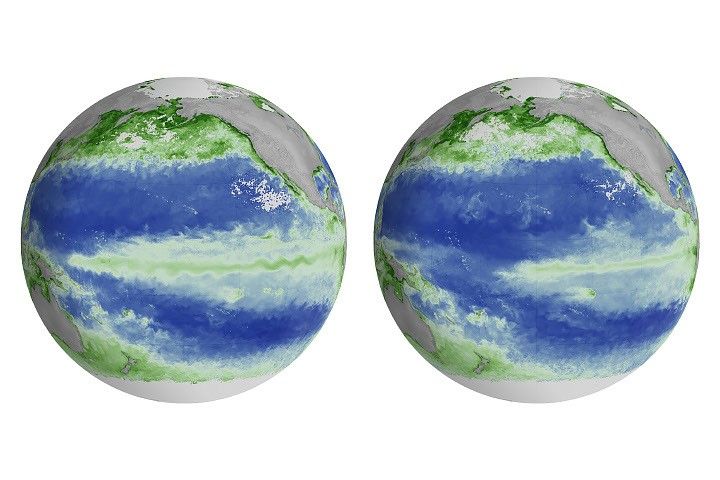
The map above compares Apparent Visible Wavelength from 2025 (a weak La Niña year) and 2026. Apparent Visible Wavelength is a data product from NASA’s PACE satellite utilizing ocean color data from the Ocean Color Instrument.
Credit: NASA’s Scientific Visualization Studio
El Niño’s warm waters also change the color of the ocean. A NASA satellite is tracking these subtle shifts in hues, as equatorial Pacific waters have become measurably more blue over the last several months.
“Some people think of water as being just blue, but it’s amazing the multitude of colors the ocean can be,” said Matthew Kehrli, a lead research scientist for the PACE (Plankton, Aerosol, Cloud, ocean Ecosystem) satellite team at NASA’s Goddard Space Flight Center in Greenbelt, Maryland.
This spectrum is in part thanks to microscopic plants called phytoplankton, which form the basis of the marine food web. There are thousands of different species of phytoplankton, which come in shades like teal, brown, or green. This year, in areas of the Pacific Ocean along the equator that are typically lush with phytoplankton and greener as a result, these hues are waning.
This is an expected effect of El Niño. Phytoplankton thrive in cool, nutrient-rich waters, but during an El Niño, the weakening trade winds reduce the upwelling of nutrient-rich deep water to the ocean surface. With limited food supply, phytoplankton abundance drops. This decline can trigger cascading effects across the marine food web, forcing other marine life to relocate to new feeding grounds.
This year’s El Niño is the first since PACE launched in 2024, providing new views of the phenomenon. The Ocean Color Instrument aboard PACE observes the ocean in hyperspectral color — across several hundred different wavelengths of visible, near-infrared, and ultraviolet light — monitoring phytoplankton and other ocean-color changes in near-real time. With PACE data, researchers calculate the average color of the ocean, simplifying spectra of light into a single number, known as apparent visible wavelength.
The 2026 map above shows the green area along the equator in the western Pacific Ocean shrink as a bluer shade fills in, indicating fewer phytoplankton. In contrast, the map from 2025 shows how the green-hued section stays steady over time.
“You have expectations of what you would think would happen,” Kehrli said. “But to visually see the results with the data products that you’re working with in real time is gratifying.”
NASA scientists will continue to monitor the signs and impacts of this El Niño with its fleet of Earth-observing satellites.
“El Niño touches almost all of us in some way every time it occurs,” Willis said. “While many have seen what it can do, we look to the ocean to understand why.”
NASA Campaign Explores Clouds Spawned by Wildfires
The Wildhorse grass fire in eastern Idaho erupted with a massive pulse of smoke. No one had expected it, but the wildfire had launched what’s known as a pyrocumulonimbus cloud, or pyroCb. It was an elusive weather phenomenon that scientists on NASA’s INSPYRE (INjected Smoke and PYRocumulonimbus Experiment) campaign spent weeks this summer hunting across western North America.
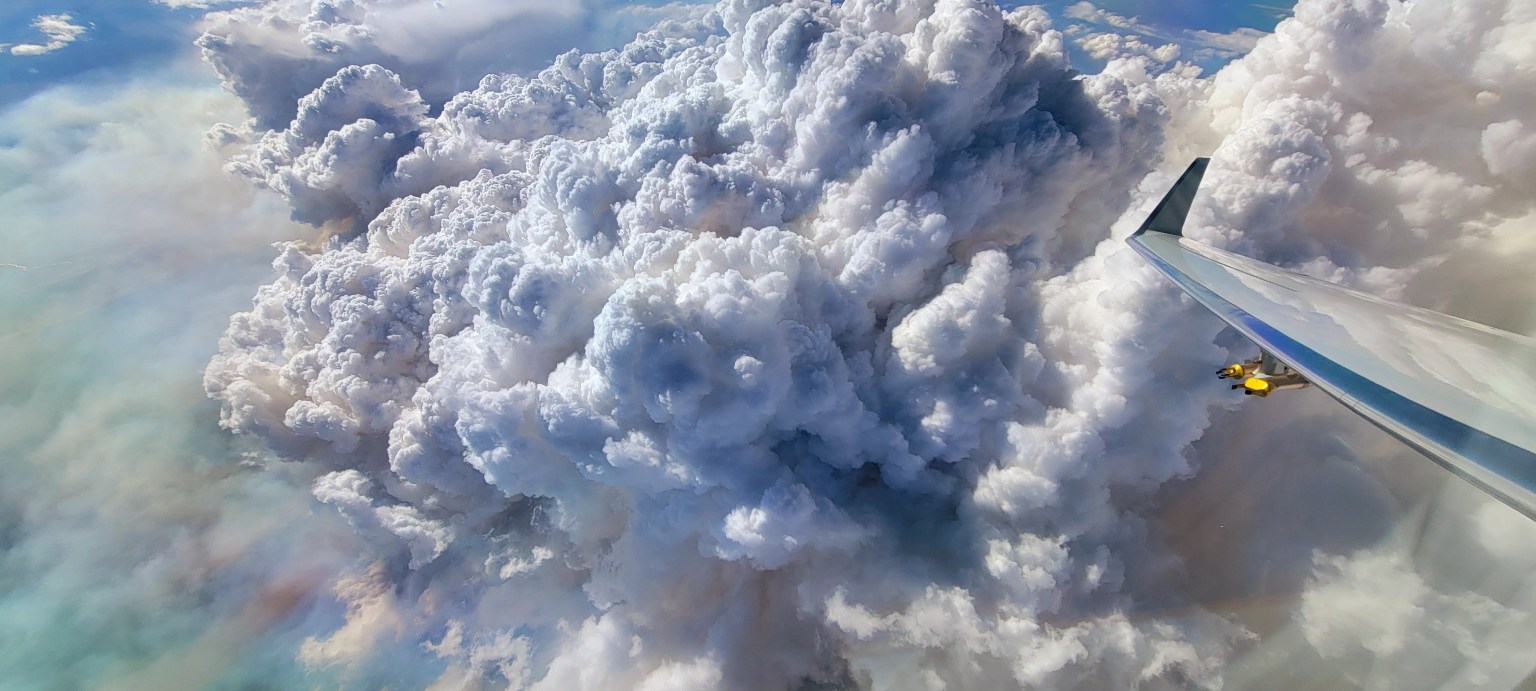
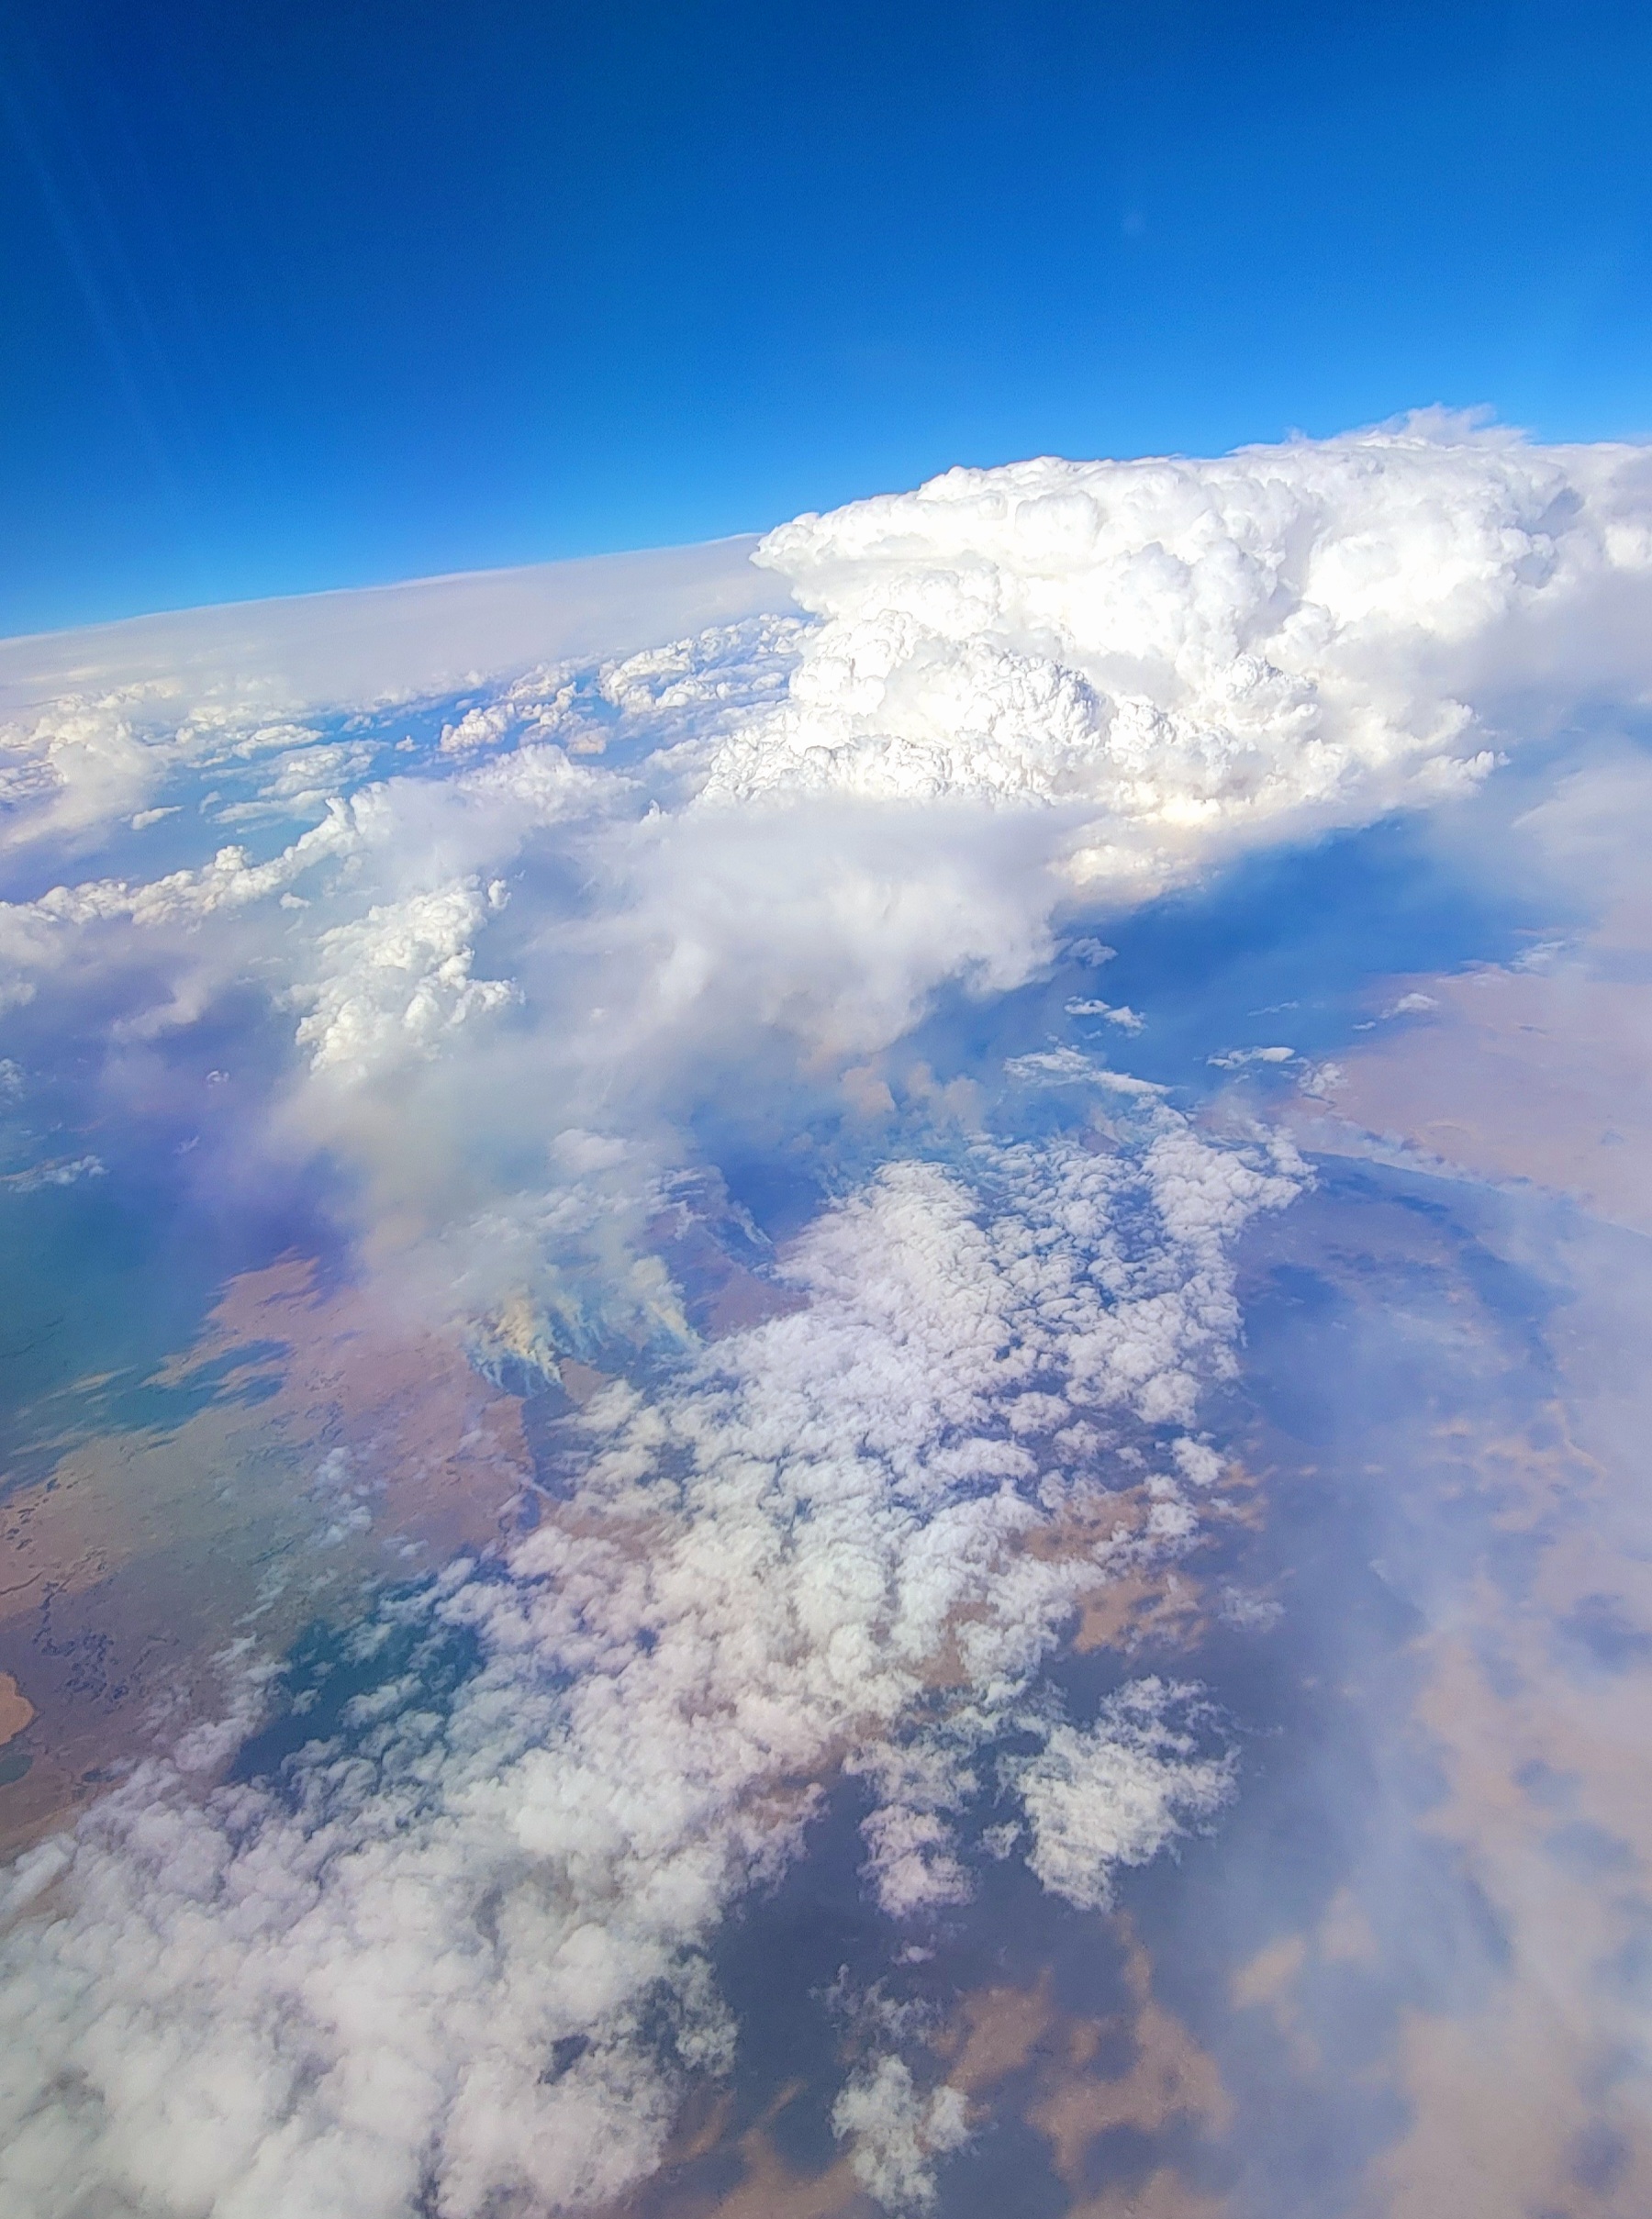
Fire-driven weather about the Widemouth 2 fire in Utah, as seen from the NCAR Gulfstream jet during the fourth INSPYRE campaign research flight on Aug. 3.
INSPYRE/Bernadett Weinzierl
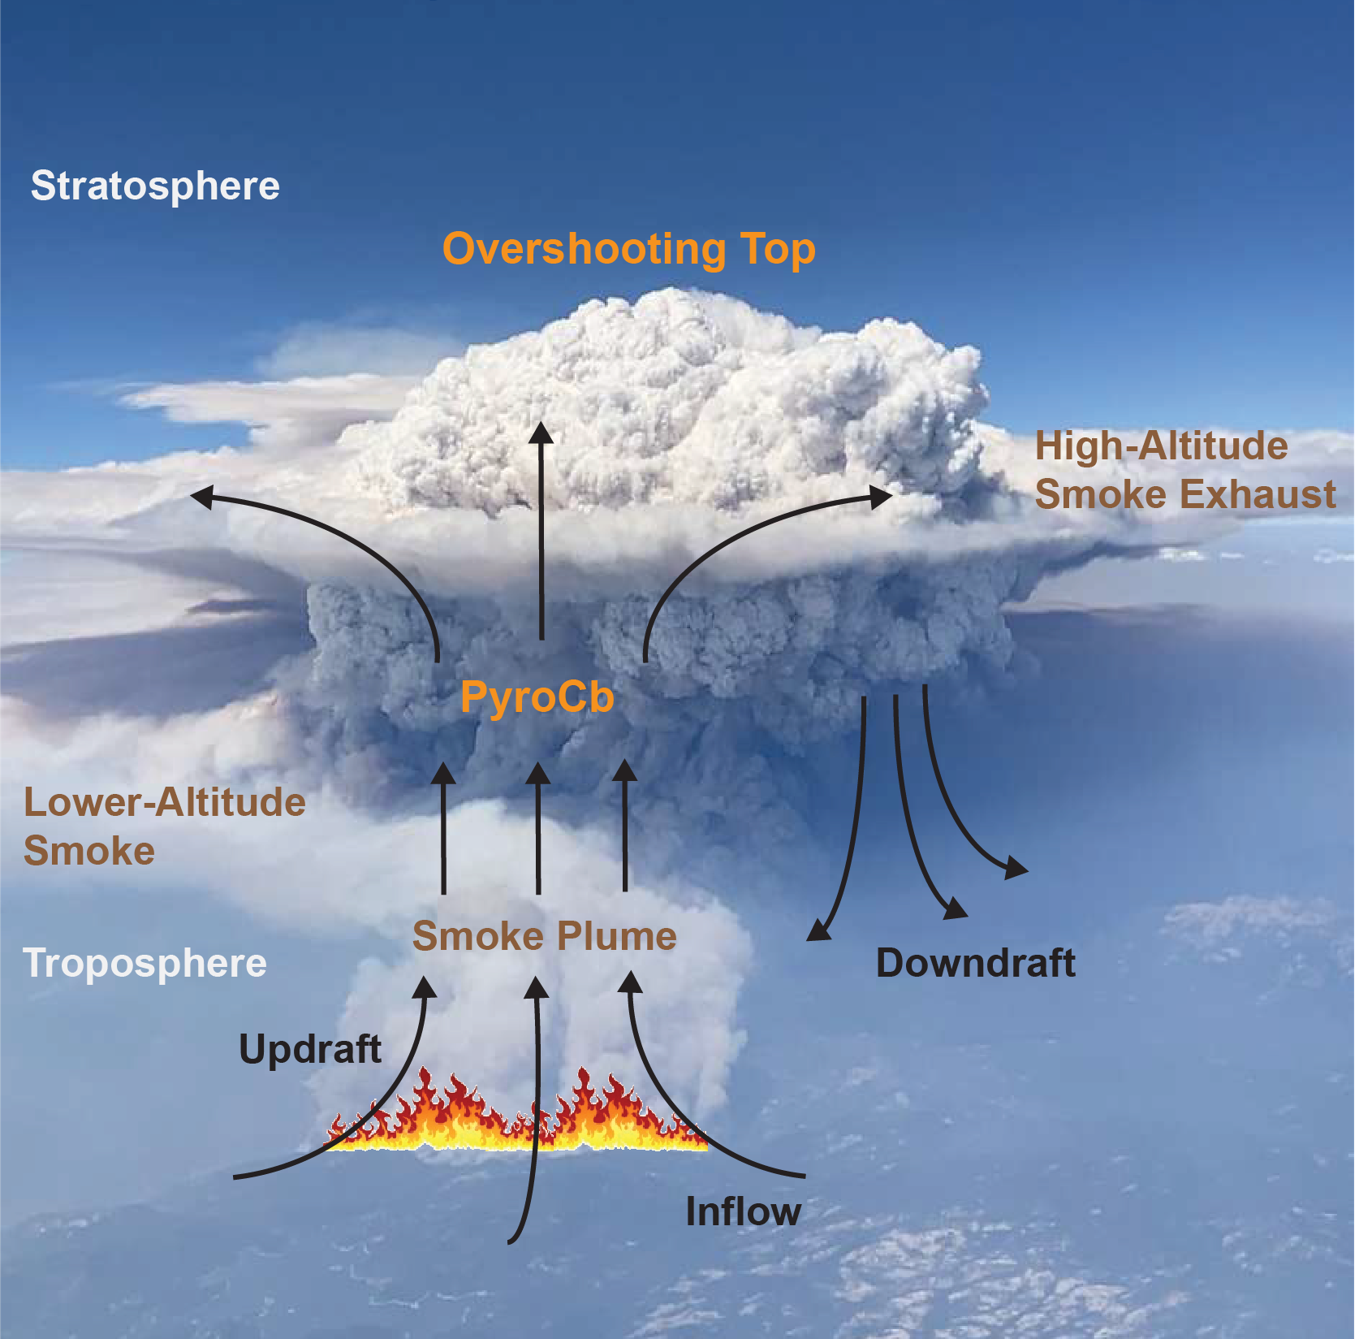
Pyrocumulonimbus clouds rise above intense fires, producing lightning and rain along with powerful winds that can whip the flames below into a fury. The largest pyroCbs funnel smoke 30,000 to 50,000 feet (10 to 15 kilometers) above Earth’s surface, as high as the cruising altitudes of commercial jets and even into the stratosphere.
A pyroCb cloud forms when an intense fire funnels a chimney of smoke into the stratosphere above the height of most clouds formed by normal weather patterns.
NASA/Bill Ingalls, NASA/JSC/Mark Sowa
The significance of pyroCbs emerged around the turn of the 21st century, when satellite observations revealed smoke reaching altitudes previously associated with major volcanic eruptions. Once in the stratosphere, pyroCb smoke can spread across continents, circle the globe, and persist far longer than it would in the lower atmosphere.
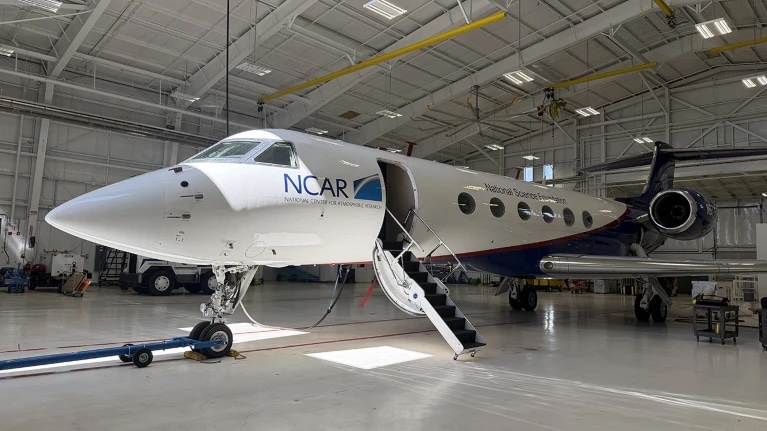
The NCAR Gulfstream jet, outfitted with instrumentation for studying clouds and smoke over wildfires, sits in its hangar at the National Science Foundation’s NCAR Research Aviation Facility in Broomfield, Colorado.
NASA/Bill Ingalls, NASA/JSC/Mark Sowa
Despite their massive size, pyroCb clouds remain mysterious. But it’s important to understand how they form and connect with the atmosphere, because their smoke can affect climate and weather far from the fires that produced them and long after they’ve extinguished. They also can produce dangerous fire-generated winds.
NASA’s ER-2 taxis on the runway during its deployment at the Great Falls International Airport. The high-flying jet launched from Great Falls, Montana, on flights across western North America and as far north as Alaska during the INSPYRE campaign.
NASA/Milan Loiacono
“We still do not understand if they’re driven by fire energetics, or fire intensity, or by atmospheric conditions above,” said Olga Kalashnikova, a researcher with NASA’s Jet Propulsion Laboratory in Southern California, who is one of the principal investigators leading INSPYRE, the first aircraft campaign designed specifically around studying pyroCbs.
An ER‑2 aircraft based at NASA’s Armstrong Flight Research Center in Edwards, California, carries a pod full of instruments for the INSPYRE campaign.
NASA/Carla Escamilla
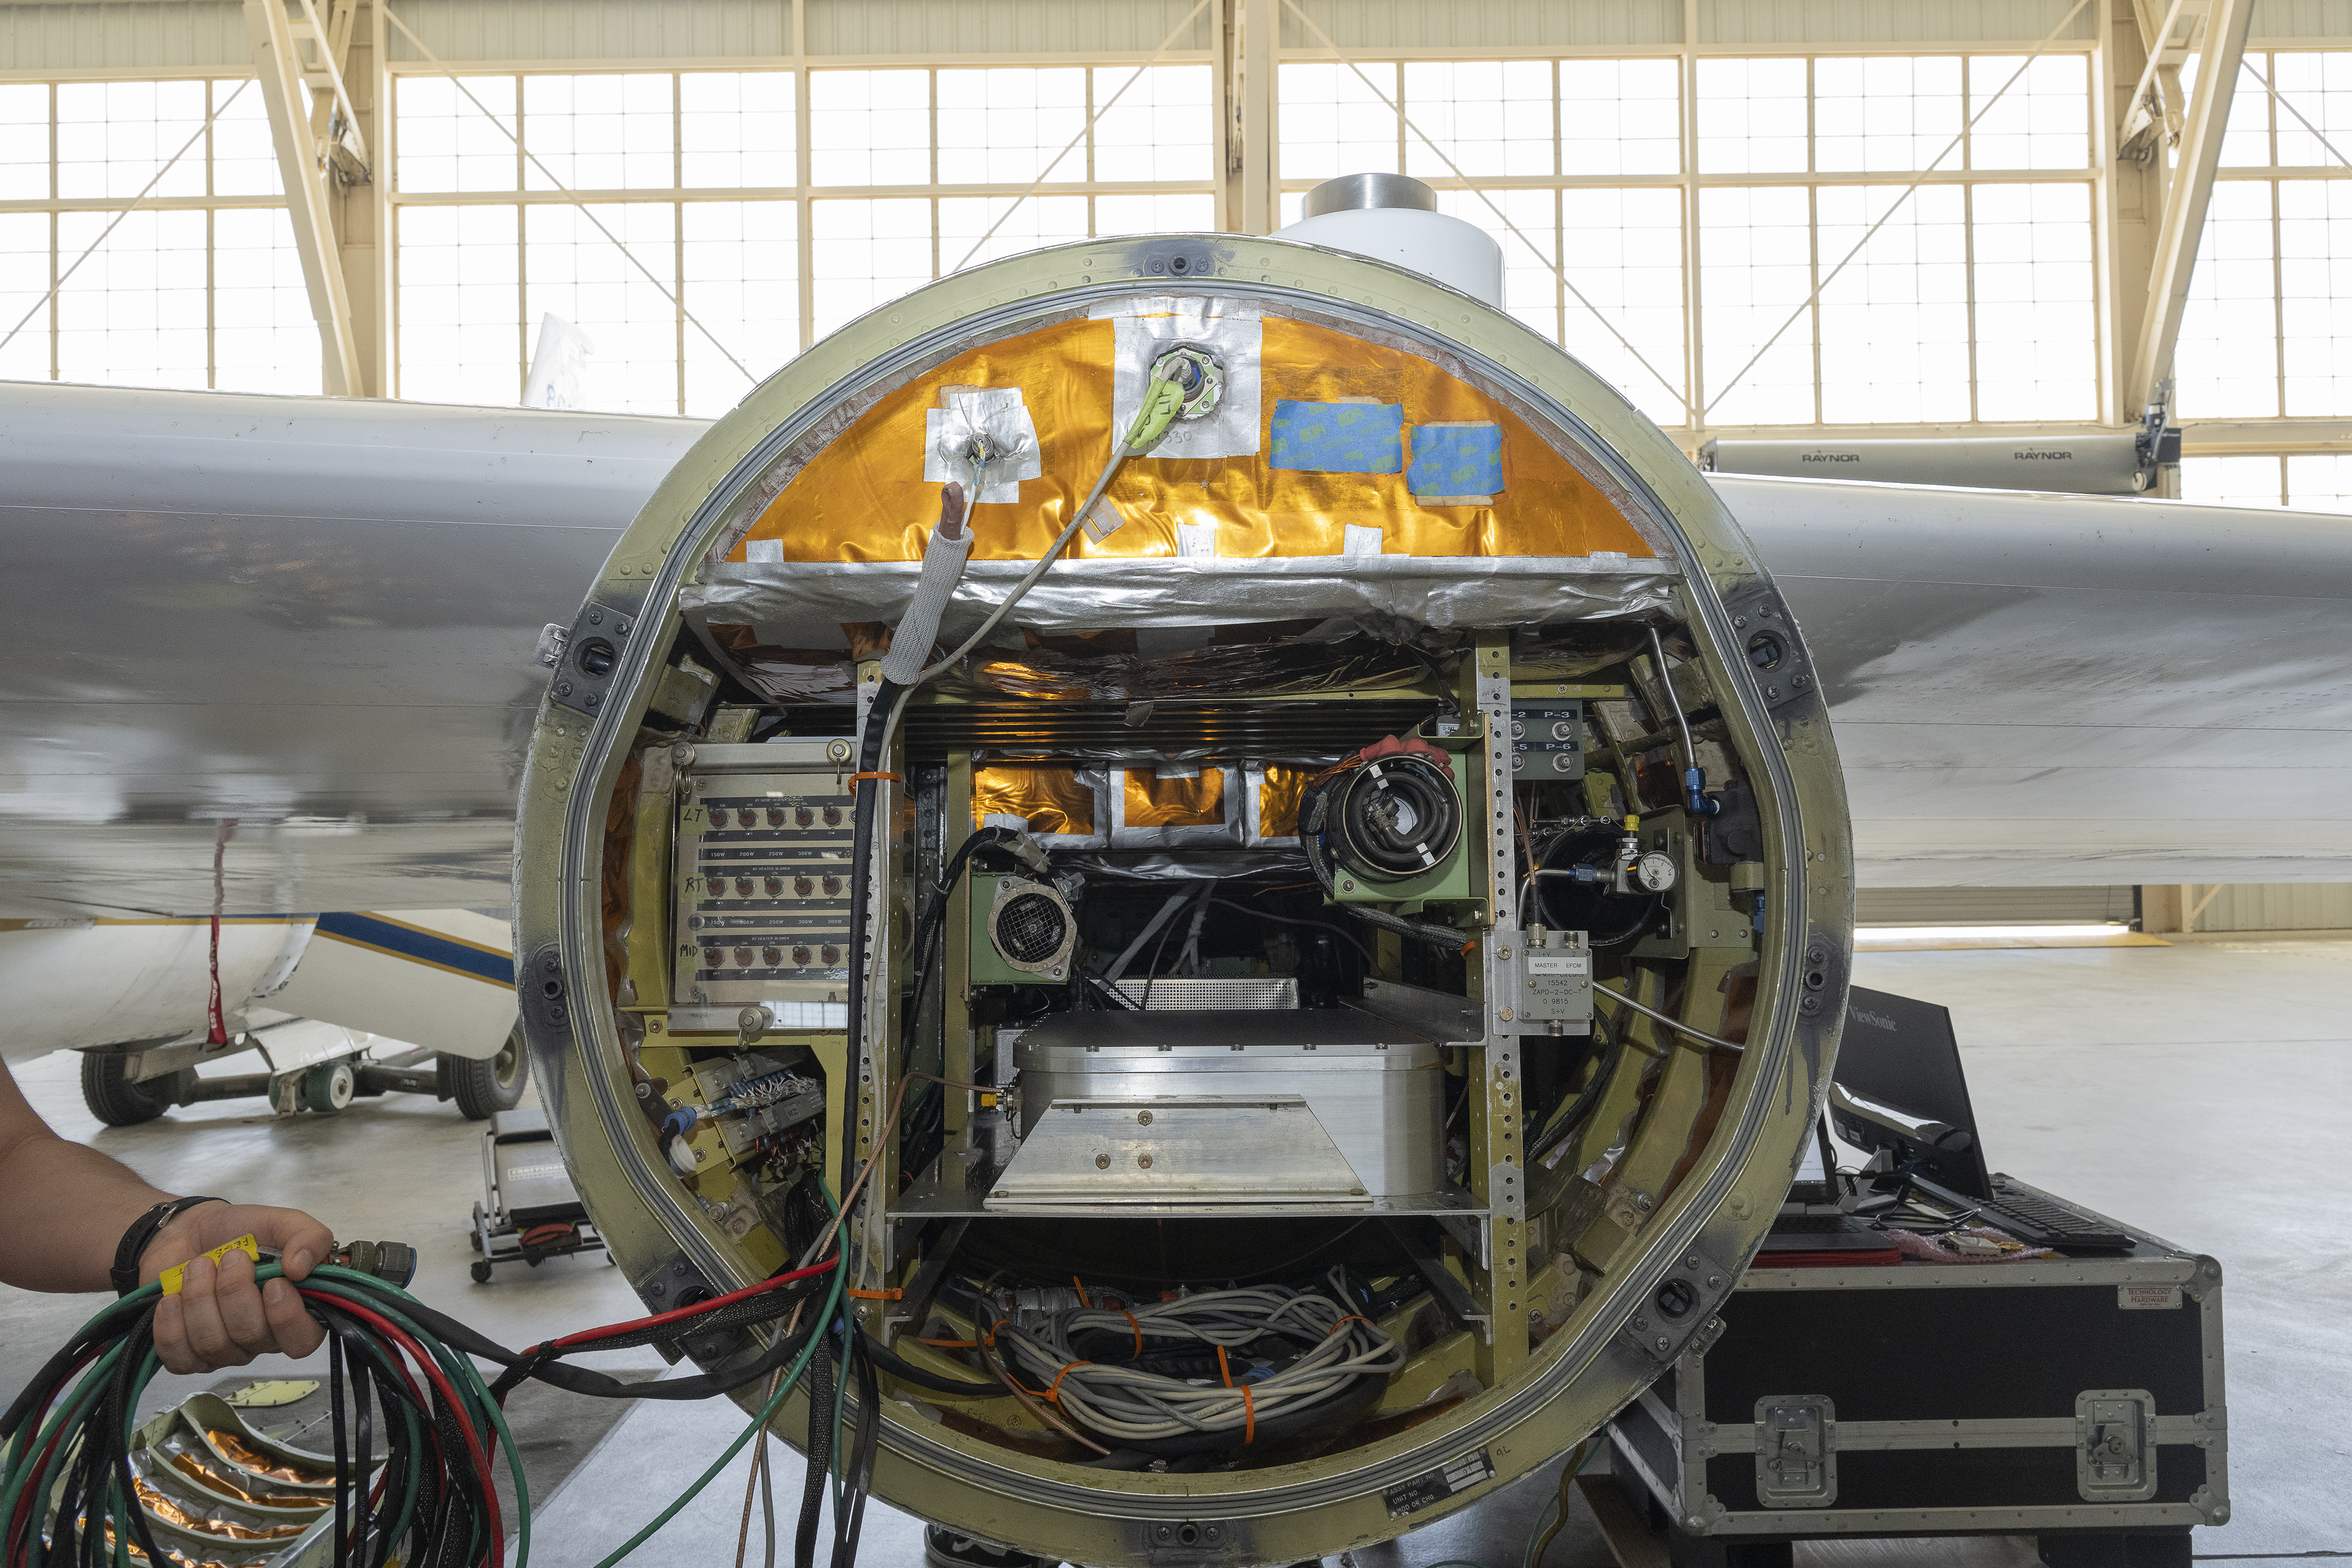
For six weeks this summer, INSPYRE researchers climbed aboard a Gulfstream jet for a series of flights from the plane’s home base at the National Center for Atmospheric Research (NCAR) near Boulder, Colorado. Scientists collected smoke particles, sampled gases, photographed ice crystals, and monitored radiation passing through clouds and reflected back into space. The aircraft crisscrossed above, below, and through clouds to get a close-up view of fire-induced weather and smoke.
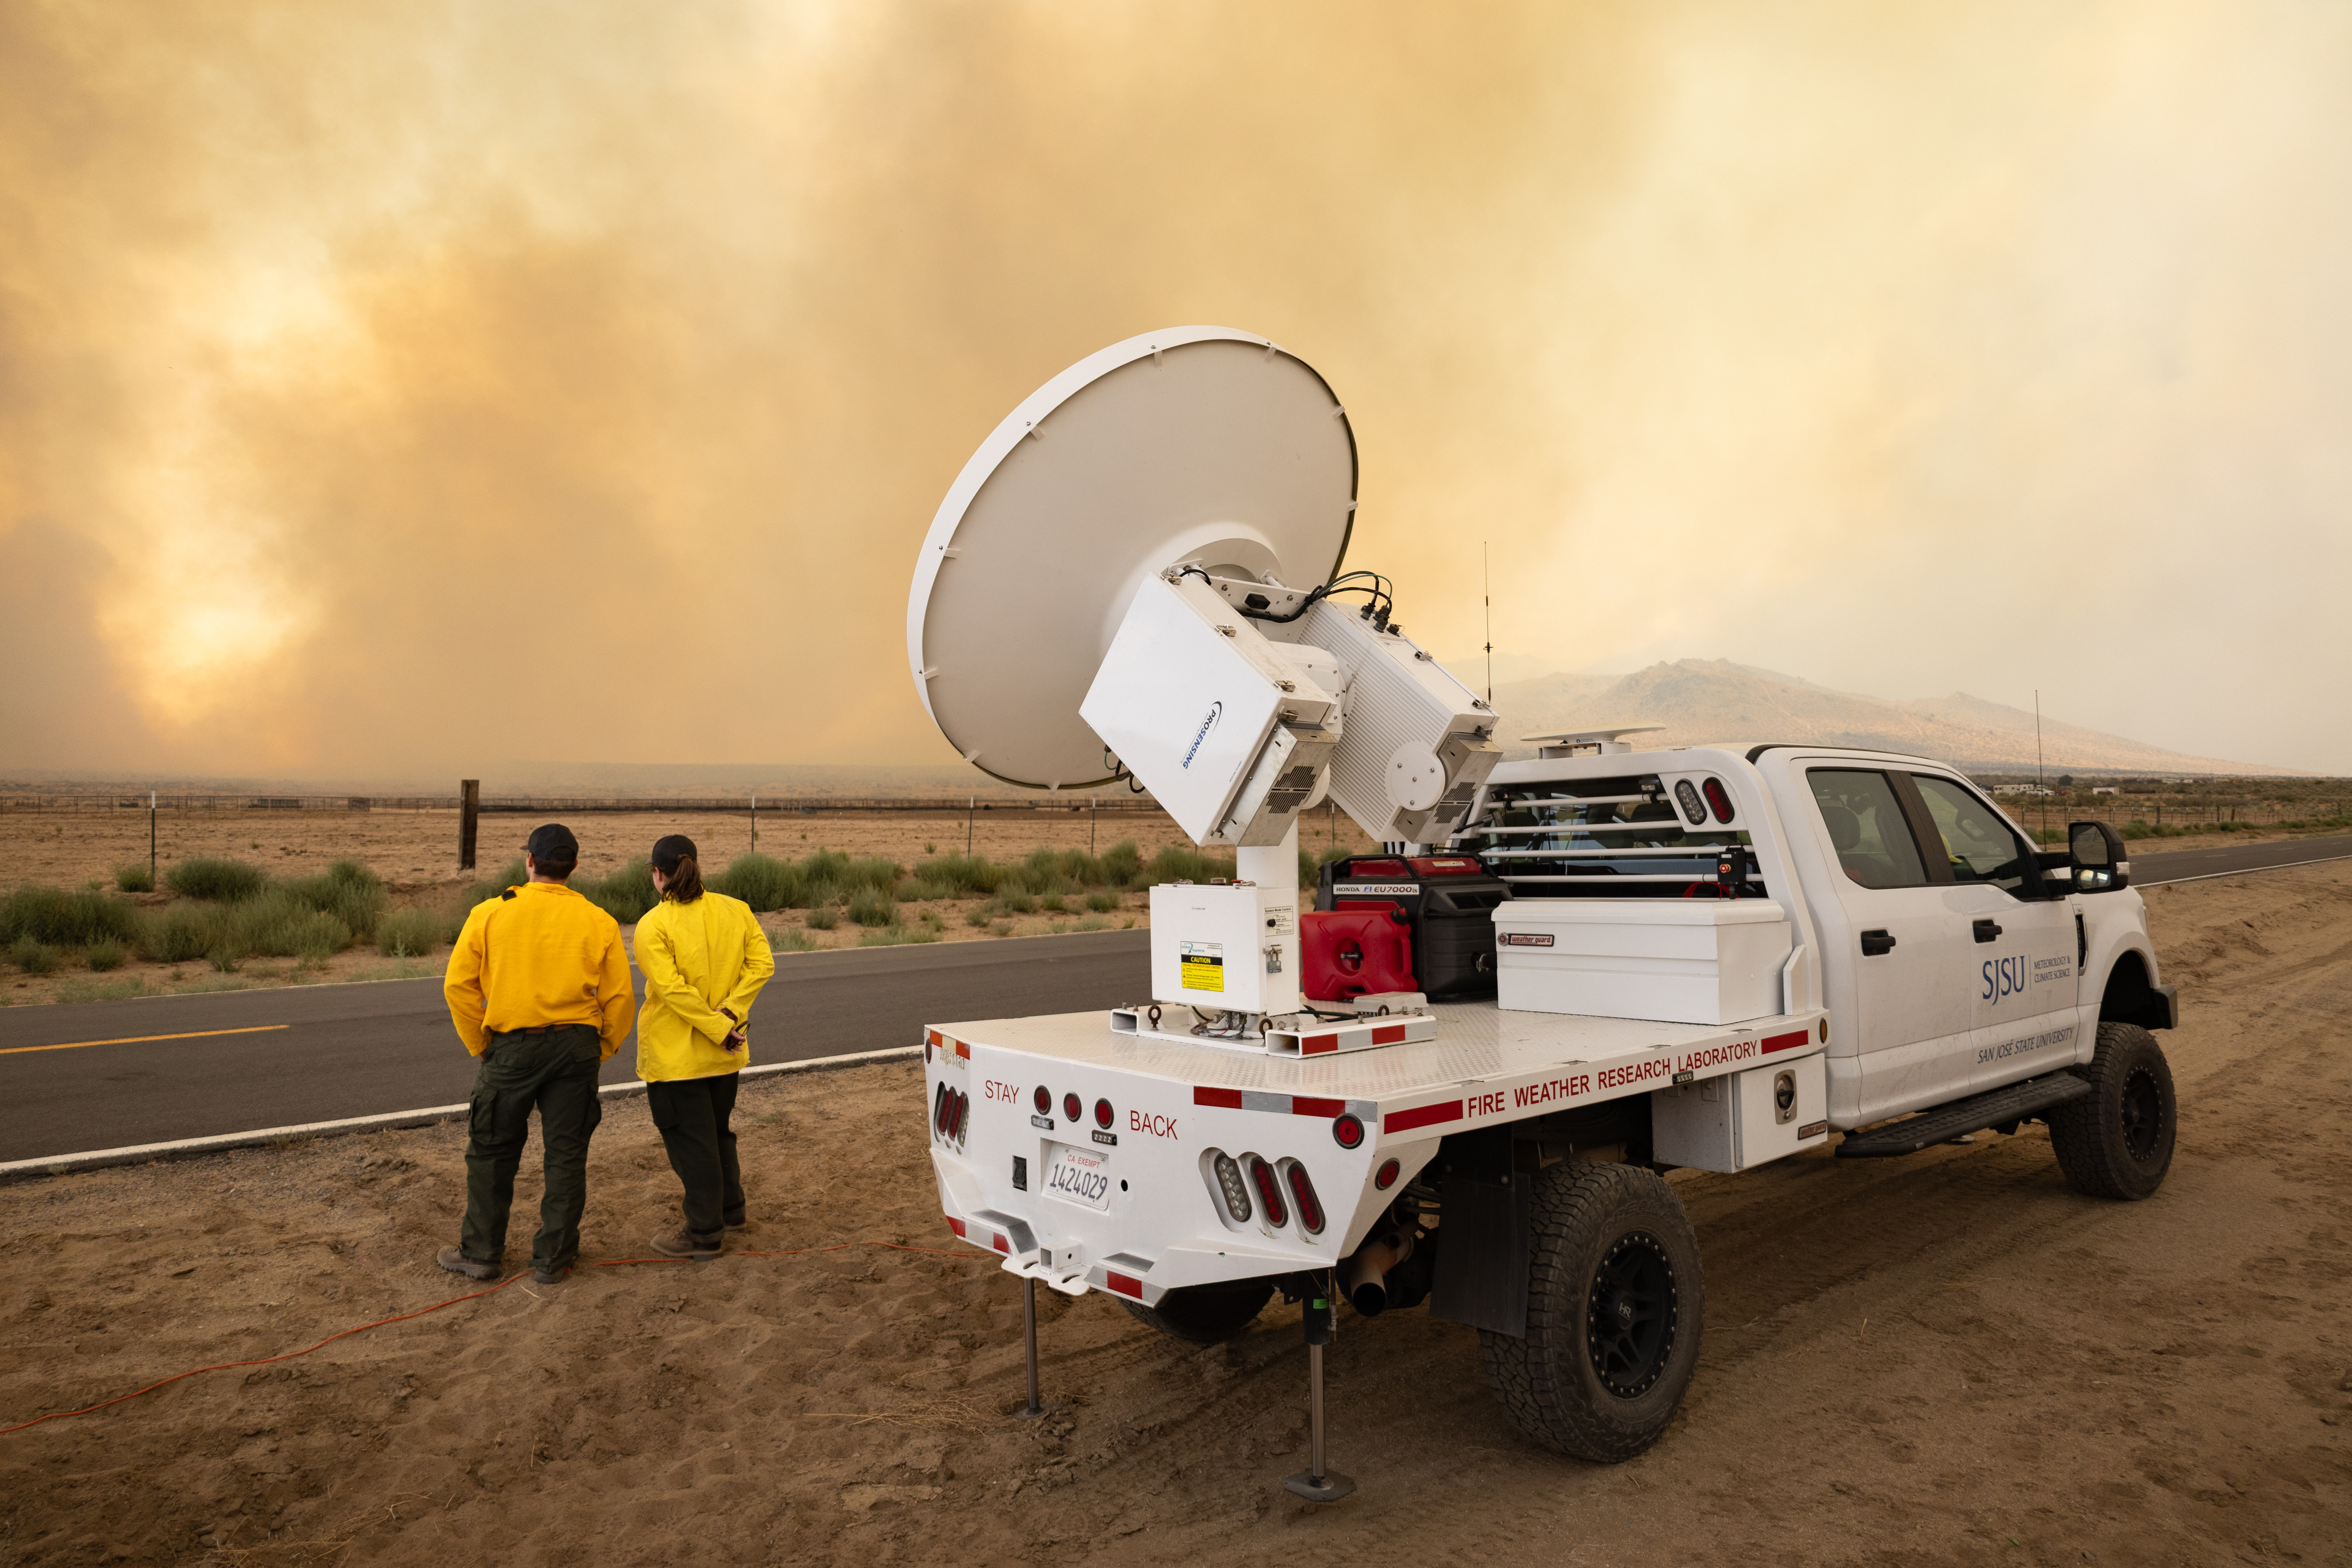
Meanwhile, NASA’s high-flying ER-2 aircraft, loaded with 14 instruments, tracked fire intensity, updraft speeds, smoke, and cloud properties from above, while crews drove trucks equipped with sensors to view the same events from the ground. Ultimately, the team will investigate how wildfire-generated clouds transport smoke upward, how clouds transform particles and gases in smoke, how much reaches the stratosphere, and what happens once it gets there.
From fire forecasts to climate models
Firefighters will benefit from a better understanding of when pyroCbs are likely to develop and how they affect fire conditions on the ground. “A unique thing about pyrocumulonimbus is they are fire-generated weather, meaning the fire makes its own weather,” said Neil Lareau, an atmospheric scientist at the University of Nevada, Reno, who led INSPYRE’s ground observations. “The fire is making its own thunderstorm, and in the process of doing that, it’s also making its own wind.”
A unique thing about pyrocumulonimbus is they are fire-generated weather . . . the fire makes its own weather.
Neil Lareau
University of Nevada
Lareau hopes the research will lead to warnings comparable to the alerts meteorologists issue for severe thunderstorms. For example, he said, a forecast would warn firefighters that a developing cloud could soon produce a dangerous downdraft and wind shift, giving fire managers time to pull personnel off the line.
Ground crews traveled across the western U.S. to monitor wildfires up close during the INSPYRE campaign.
NASA/Milan Loiacono
Additionally, INSPYRE could also improve Earth system models. PyroCbs can carry enormous quantities of smoke into the stratosphere, where particles can persist for months or longer and affect how much solar energy the atmosphere absorbs and how much reaches Earth’s surface. Most numerical prediction models don’t explicitly include the effects of pyroCbs and their smoke injections, said Dave Peterson, a Naval Research Laboratory meteorologist and INSPYRE’s co-principal investigator. Measurements of the particles, gases, and radiation associated with these events will give scientists data to test and improve simulations of their effects on Earth’s weather and climate.
Hunting storms
To study wildfire smoke and clouds, and perhaps catch a pyroCb in action, the INSPYRE team first had to find one. The challenge was getting an aircraft to the right place at the right time. Pyrocumulonimbus clouds can develop in minutes and subside just as quickly, while reaching fires hundreds of miles away takes hours of preparation, flight time, and coordination with air traffic controllers.
Instrumentation racks take the place of passenger seats on the NCAR Gulfstream plane that has been converted from an executive jet to a flying laboratory.
NASA/Katie Jepson
But on Aug. 26, the team got lucky. The Gulfstream was returning from a fire farther west when Sarah Woods, a National Center for Atmospheric Research scientist serving as spotter, got word that the Wildhorse fire was unexpectedly intense.
The fire hadn’t initially attracted much attention. “We knew there was a grass fire there, and everyone’s like, it’s just a grass fire; we’re not going to worry about it,” Peterson said. “And it ended up being the main event.”
We knew there was a grass fire there, and everyone’s like, it’s just a grass fire; we’re not going to worry about it . . . And it ended up being the main event.”
DAVE PETERSON
Naval Research Laboratory
When the flight path neared the Wildhorse fire, Woods spotted the fresh remains of a pyroCb from her cramped jump seat behind the pilots. “It looks just like a big thunderstorm, and so as you approach it, you look for a visual indication of the fire on the ground,” said Woods.
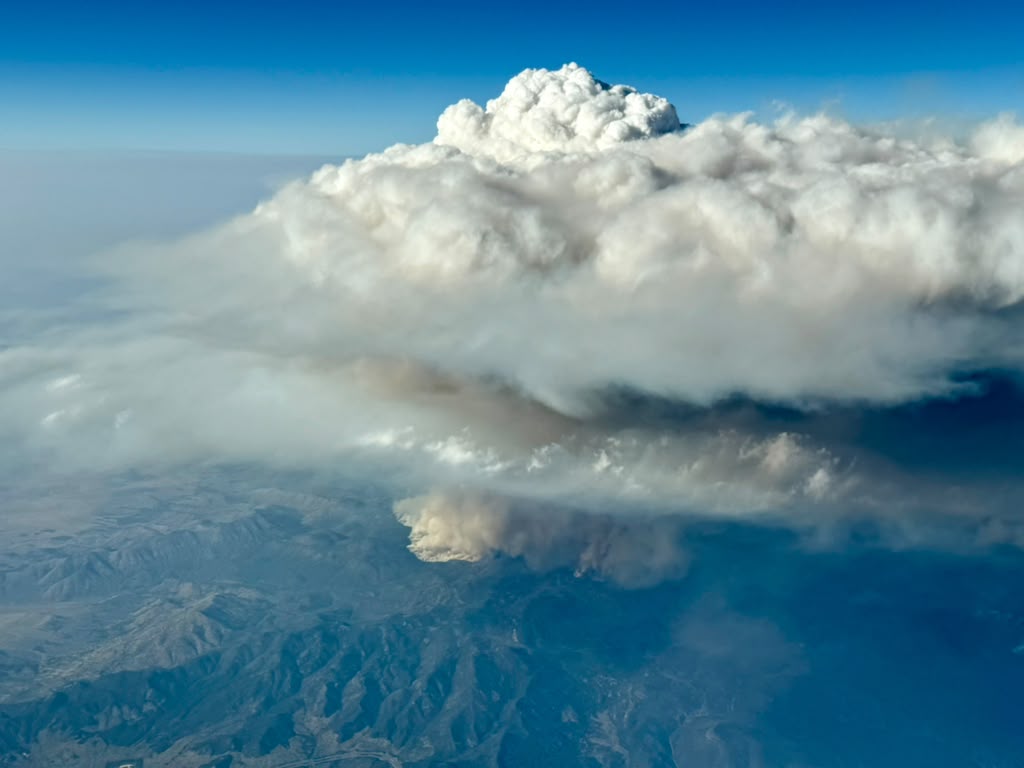
Researchers on an Aug. 26 INSPYRE research flight encountered a pyrocumulonimbus (pyroCb) cloud that unexpectedly formed over the Wildhorse grass fire in eastern Idaho.
INSPYRE/Chris Kruse
Seeing the fire on the ground far below confirmed that the cloud was fire-generated. At Woods’ request, the pilots swung the plane around and spent the next three hours flying back and forth through the cloud plume and the trail of smoke drifting northwest toward Wyoming.
The chance encounter gave the INSPYRE team measurements of a pyroCb plume roughly an hour after the cloud first erupted. Other flights coordinated between the Gulfstream jet and ER-2 added crucial observations of active fire-driven atmospheric airflow that will help document how the resulting smoke plumes evolve over the days and weeks that follow.
Putting pieces together
Measurements from the Gulfstream and ER-2 will now be combined with satellite and ground observations and compared with models.
“When clouds form, they modify chemistry,” said Kalashnikova, the JPL-based principal investigator. That altered smoke can have different effects on radiation, she said, making it important to understand both how pyroCbs form and the smoke that emerges from them.
In the summer of 2026, the challenge was finding the clouds and collecting the measurements. Now comes the work of understanding what they found.

 Login