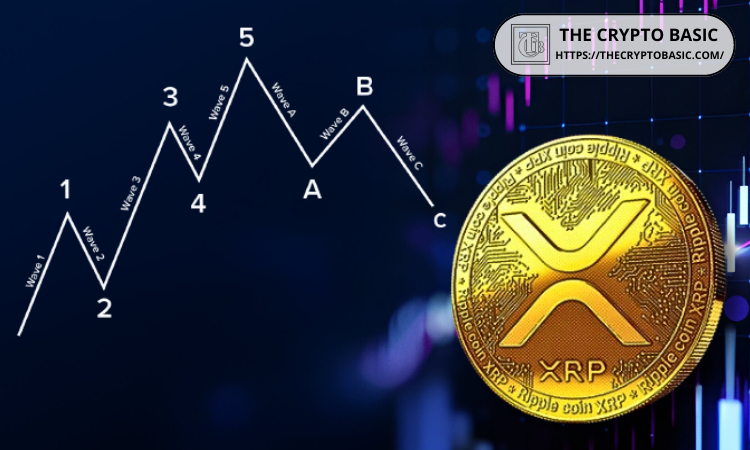
XRP could witness another decline before resuming its upward push, according to an Elliott Wave analysis of the 1-hour chart. The structure suggests that the correction that followed XRP's August 2026 rally may not be over yet, which leaves room for another decline before a possible move toward $2.25.
XRP may be approaching a technical confirmation that determines whether its recent consolidation develops into a larger rally toward $2.30.
Analyst Celal Kucuker has identified $1.38 as the level XRP needs to reclaim and hold to confirm what he describes as a “fake breakout.”
XRP Price Needs to Close Above $1.38
In a recent post on X, Kucuker said XRP must close above $1.38 today or tomorrow to confirm the setup. His chart shows XRP trading inside a large contracting triangle. The price is currently near the point where the descending resistance line and rising support line converge.
The chart places the key confirmation level around $1.37896, making the $1.38 area the immediate level to watch.
XRP is currently trading around $1.35, according to CoinMarketCap data. It is down about 2.2% over the past 24 hours and 6.5% over the last seven days.
The decline has come alongside weakness across the crypto market. Bitcoin fell below $77,000 yesterday and is down roughly 4.3% over the past week.
However, XRP’s monthly performance remains positive. The token is still up about 32% over the past month, compared with Bitcoin’s 21% gain. Much of those gains came during the explosive rally in late August, after which XRP has struggled to push through resistance.
XRP chart by Celal Kucuker
The Way to $2.30
Kucuker’s setup suggests that reclaiming $1.38 would provide the confirmation XRP needs to move out of its current consolidation structure.
The $2.30 target would represent a 70% move from XRP’s current price near $1.35. However, the chart does not suggest that XRP would necessarily reach that level immediately.
In particular, the chart shows resistance at $1.513 and $1.70, which, if reclaimed, will set the foundation for higher targets in the $2 range.
Meanwhile, a failure to reclaim $1.38 could leave XRP inside the triangle and expose the token to another test of its lower trendline.
ChartNerd Sees Higher XRP Targets
In another post, ChartNerd told investors to “zoom out” when they start doubting whether XRP can reach higher prices. The analyst shared a chart showing that XRP’s current price pattern looks similar to patterns from previous market cycles.
ChartNerd described it as: “Same Structure: Different Cycles.”
The chart shows a large triangle that started forming after XRP’s 2018 peak and is now nearing its end. ChartNerd believes XRP will eventually break out of this long-term pattern.
Based on Fibonacci levels, the analyst sees possible targets around $8.33, $13.50, and $27. These levels roughly match the 1.272, 1.414, and 1.618 Fibonacci extensions.
ChartNerd also compared the current pattern to XRP’s price movement from 2014 to early 2017. During that period, XRP traded sideways for a long time before breaking higher and eventually reaching its previous all-time high.
Because of this, ChartNerd believes XRP’s current setup is part of a long-term market cycle, rather than just a short-term price move.
XRP price is at an important point as analysts watch to see if it can move back above key moving averages and end its recent downtrend. The coin is trading at $1.37 at press time, down 3% in the past 24 hours, according to CoinMarketCap.
The recent relief bounce from XRP may not have ended the current pullback, as its Elliott Wave structure calls for one more dip. Notably, the Elliott Wave theory on the 1-hour chart shows that the latest bounce has not yet formed the structure needed to confirm a lasting bottom.
XRP has entered a rare technical zone that has come before some of its biggest price moves, according to analyst ChartNerd. In a recent post, ChartNerd said XRP has traded below its weekly Gaussian Channel only a few times in the past 13 years.
XRP price is showing a bullish setup after reclaiming the $1.40 level, and analyst Nebraskangooner has identified $2.12 as the upside target. His chart shows an entry around $1.43, a stop level near $1.31, and a profit-taking target of $2.12.
XRP has entered another important phase after its August rally, with the weekly chart now indicating a possible cup-and-handle breakout. The structure suggests that the recent decline may represent a retest of this breakout.
Amid the ongoing pullback following the August rally, XRP must defend its current price level to maintain its bullish trend. XRP has reached an important point as it tries to hold on to its recent recovery.
Chainlink nears a 100% rally as LINK gains 80% since June amid renewed speculation that it could eventually flip XRP. Chainlink has posted two consecutive months of strong gains, nearly doubling from around $7 as buying momentum continues to build.
XRP is showing a bullish signal as its short-term moving average gets closer to its long-term moving average. The 50-day Simple Moving Average (SMA) is moving toward the 150-day SMA.
XRP has pulled back from the $1.69 high reached during its August rally, but its 4-hour chart still shows a bullish Break of Structure (BoS). Notably, XRP rose 71.8% from $0.988 to $1.698 in August before the current pullback began.
XRP shows the potential for another major price surge based on past market cycles that delivered gains of 2,405%, 1,002%, and 1,250%. Based on these figures, the average gain was about 1,552%, while the geometric average came in at around 1,444%.
XRP still has two major price waves to complete before the altcoin bear market ends, according to crypto market analyst RWA_Investor. In a recent post on X, the analyst shared an Elliott Wave chart showing XRP rising again before facing another major correction and entering a larger bullish phase.
XRP price is getting ready for another big move higher after the recent drop, according to Elliott Wave analyst XForceGlobal. The analyst believes XRP will rise to between $3 and $4, after falling more than 20% from its recent high.
The XRP AVWAP indicator has recently gone flat after a recent surge, which could have significant implications for XRP's next price direction. XRP had one of its strongest monthly performances in years in August 2026.
XRP is at a critical point after falling below a key support level during the ongoing price retracement. As the dip worsens, analyst ChartNerd says XRP needs to reclaim key resistance levels to regain bullish momentum.
XRP now sits at a major crossroads after its latest rally, and multiple factors could determine its next direction from here. After rising to nearly $1.70 two weeks ago, XRP met resistance at that level and has continued to pull back.
XRP has the potential to rally toward a two-digit price target, but it may first need to correct further to retest support at the 300WMA. After rising to a three-month high of $1.69 two weeks ago, XRP ran into resistance at this level and started to pull back.
XRP recent move below $1 and subsequent rebound toward $1.70 is forming the accumulation base needed for its next major price expansion, according to analyst ChartNerd. In a recent post, ChartNerd revisited a macro analysis first published on December 12, 2025.
XRP price is facing long-term selling pressure at $15 and $32 as whales on Binance and Coinbase place major sell walls at those levels as the price resumes its rally. CryptoQuant author CW said Binance whales had previously established a sell wall extending to $15, and that the liquidity remains in place.

 Login
Login