Reading view

There are new articles available, click to refresh the page.

A Week of Smoky Skies Across North America

Wildland fire activity in Canada ramped up in July 2026, a time of year when lightning ignitions typically increase, according to a seasonal outlook published by several North American fire agencies. The blazes sent smoke plumes pouring across the U.S. and Canada, affecting air quality in both countries.  

This animation tracks brown carbon, the organic aerosols emitted by fires that give smoke plumes their characteristic yellow, orange, and brown tint. Brown carbon is a major component of a fire’s PM2.5 emissions, a type of air pollution that can aggravate cardiovascular and respiratory conditions. Here, the plume drifts across North American skies from July 14 through July 20, 2026.

Data for the animation come from a version of the GEOS (Goddard Earth Observing System) model, which assimilates data from satellites, aircraft, and ground-based observing systems. In addition to satellite observations of aerosols and fires, the model also incorporates meteorological data such as air temperature, moisture, and winds to project the plume’s behavior.

On July 14, at the start of the animation, numerous fires had already cropped up, including more than 180 in Ontario and several in northern Minnesota. Winds carried the smoke southeast, and by July 15, skies turned hazy and air quality declined from southern Ontario in Canada to the Upper Midwest and Northeast in the U.S. July 16 and 17 saw air quality in many areas continue to plummet, including in Detroit, where it stayed in the hazardous range for several consecutive days. Toronto, Chicago, New York City, and Washington, D.C., saw air quality ranging from unhealthy to hazardous.

On July 19 and 20, smoke continued to affect air quality downwind, including in the Great Lakes region, according to the National Weather Service. Storms began clearing it away in parts of the East, where air quality improved to good or moderate. Meanwhile, fires in the Pacific Northwest began degrading air quality there. 

The brown carbon shown in this animation represents organic carbon that comes specifically from wildfire smoke. Wildfires also emit black carbon, or soot, which contributes to their PM2.5 output. Black carbon has long served as a tracer for smoke plumes, but human sources—such as vehicle exhaust and industrial combustion—produce it too, blending in with the black carbon from fires. The GEOS model has been able to make that distinction for brown carbon since February 2026, when an update enabled it to split organic carbon into its anthropogenic and biomass-burning components.

NASA Earth Observatory animation by Lauren Dauphin, using GEOS-FP data from the Global Modeling and Assimilation Office at NASA GSFC. Story by Kathryn Hansen.

References & Resources

You may also be interested in:

Stay up-to-date with the latest content from NASA as we explore the universe and discover more about our home planet.
Ontario Wildfire Smoke Moves East

3 min read

Canadian wildfires sent plumes of smoke streaming over Ontario, Quebec, and parts of the U.S. Midwest and Northeast.

Article

Smoke Shrouds Northern Thailand

3 min read

Seasonal fires have darkened skies over Southeast Asia.

Article

Fighting Fire With Fire

3 min read

In fire-prone ecosystems in Australia’s Northern Territory, prescribed burns are lit to minimize the severity of fires later in the…

Article

Firefighting drones in the works as wildfires plague US nearly year-round

Drones capable of spraying water and fire retardants have been practicing how to snuff out wildfires early in California and Alaska this summer—demonstrating a possible rapid-response tool for firefighting as climate change transforms wildfire season into a nearly year-round risk for much of the United States.

Most drones are significantly smaller than crewed aircraft and have shorter flight ranges, meaning they cannot replace large airtankers in delivering massive payloads of water or other fire-suppressing payloads to remote wildfires. But companies and fire agencies—along with organizers of the $11 million XPRIZE competition—are testing whether drones can help firefighting crews respond more quickly to small fires and put them out before they become more destructive.

The California Department of Forestry and Fire Protection, also known as CAL FIRE, ran its own field test involving five autonomous drones that worked together to deploy between 500 and 1,000 gallons of foam combined for suppressing fires on July 15, according to the TV station KPMH. The demonstration was organized with the help of the nonprofit FireWERX and the California-based company Seneca, which is making the drones commercially available starting in 2026.

Read full article

Comments

© Seneca

New NASA Earth Missions Gear Up to Start Science Flights  

6 Min Read

New NASA Earth Missions Gear Up to Start Science Flights  

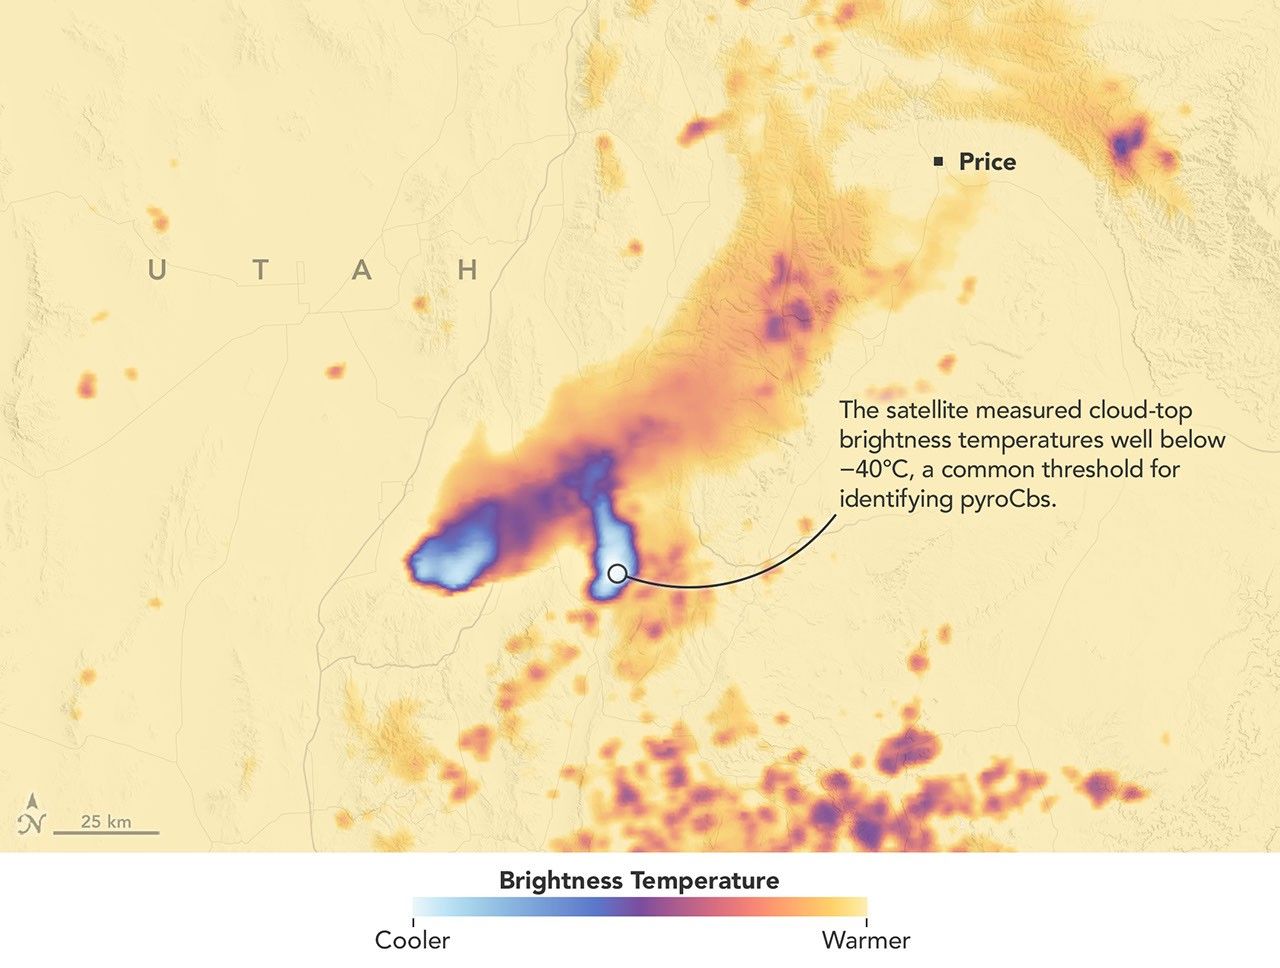
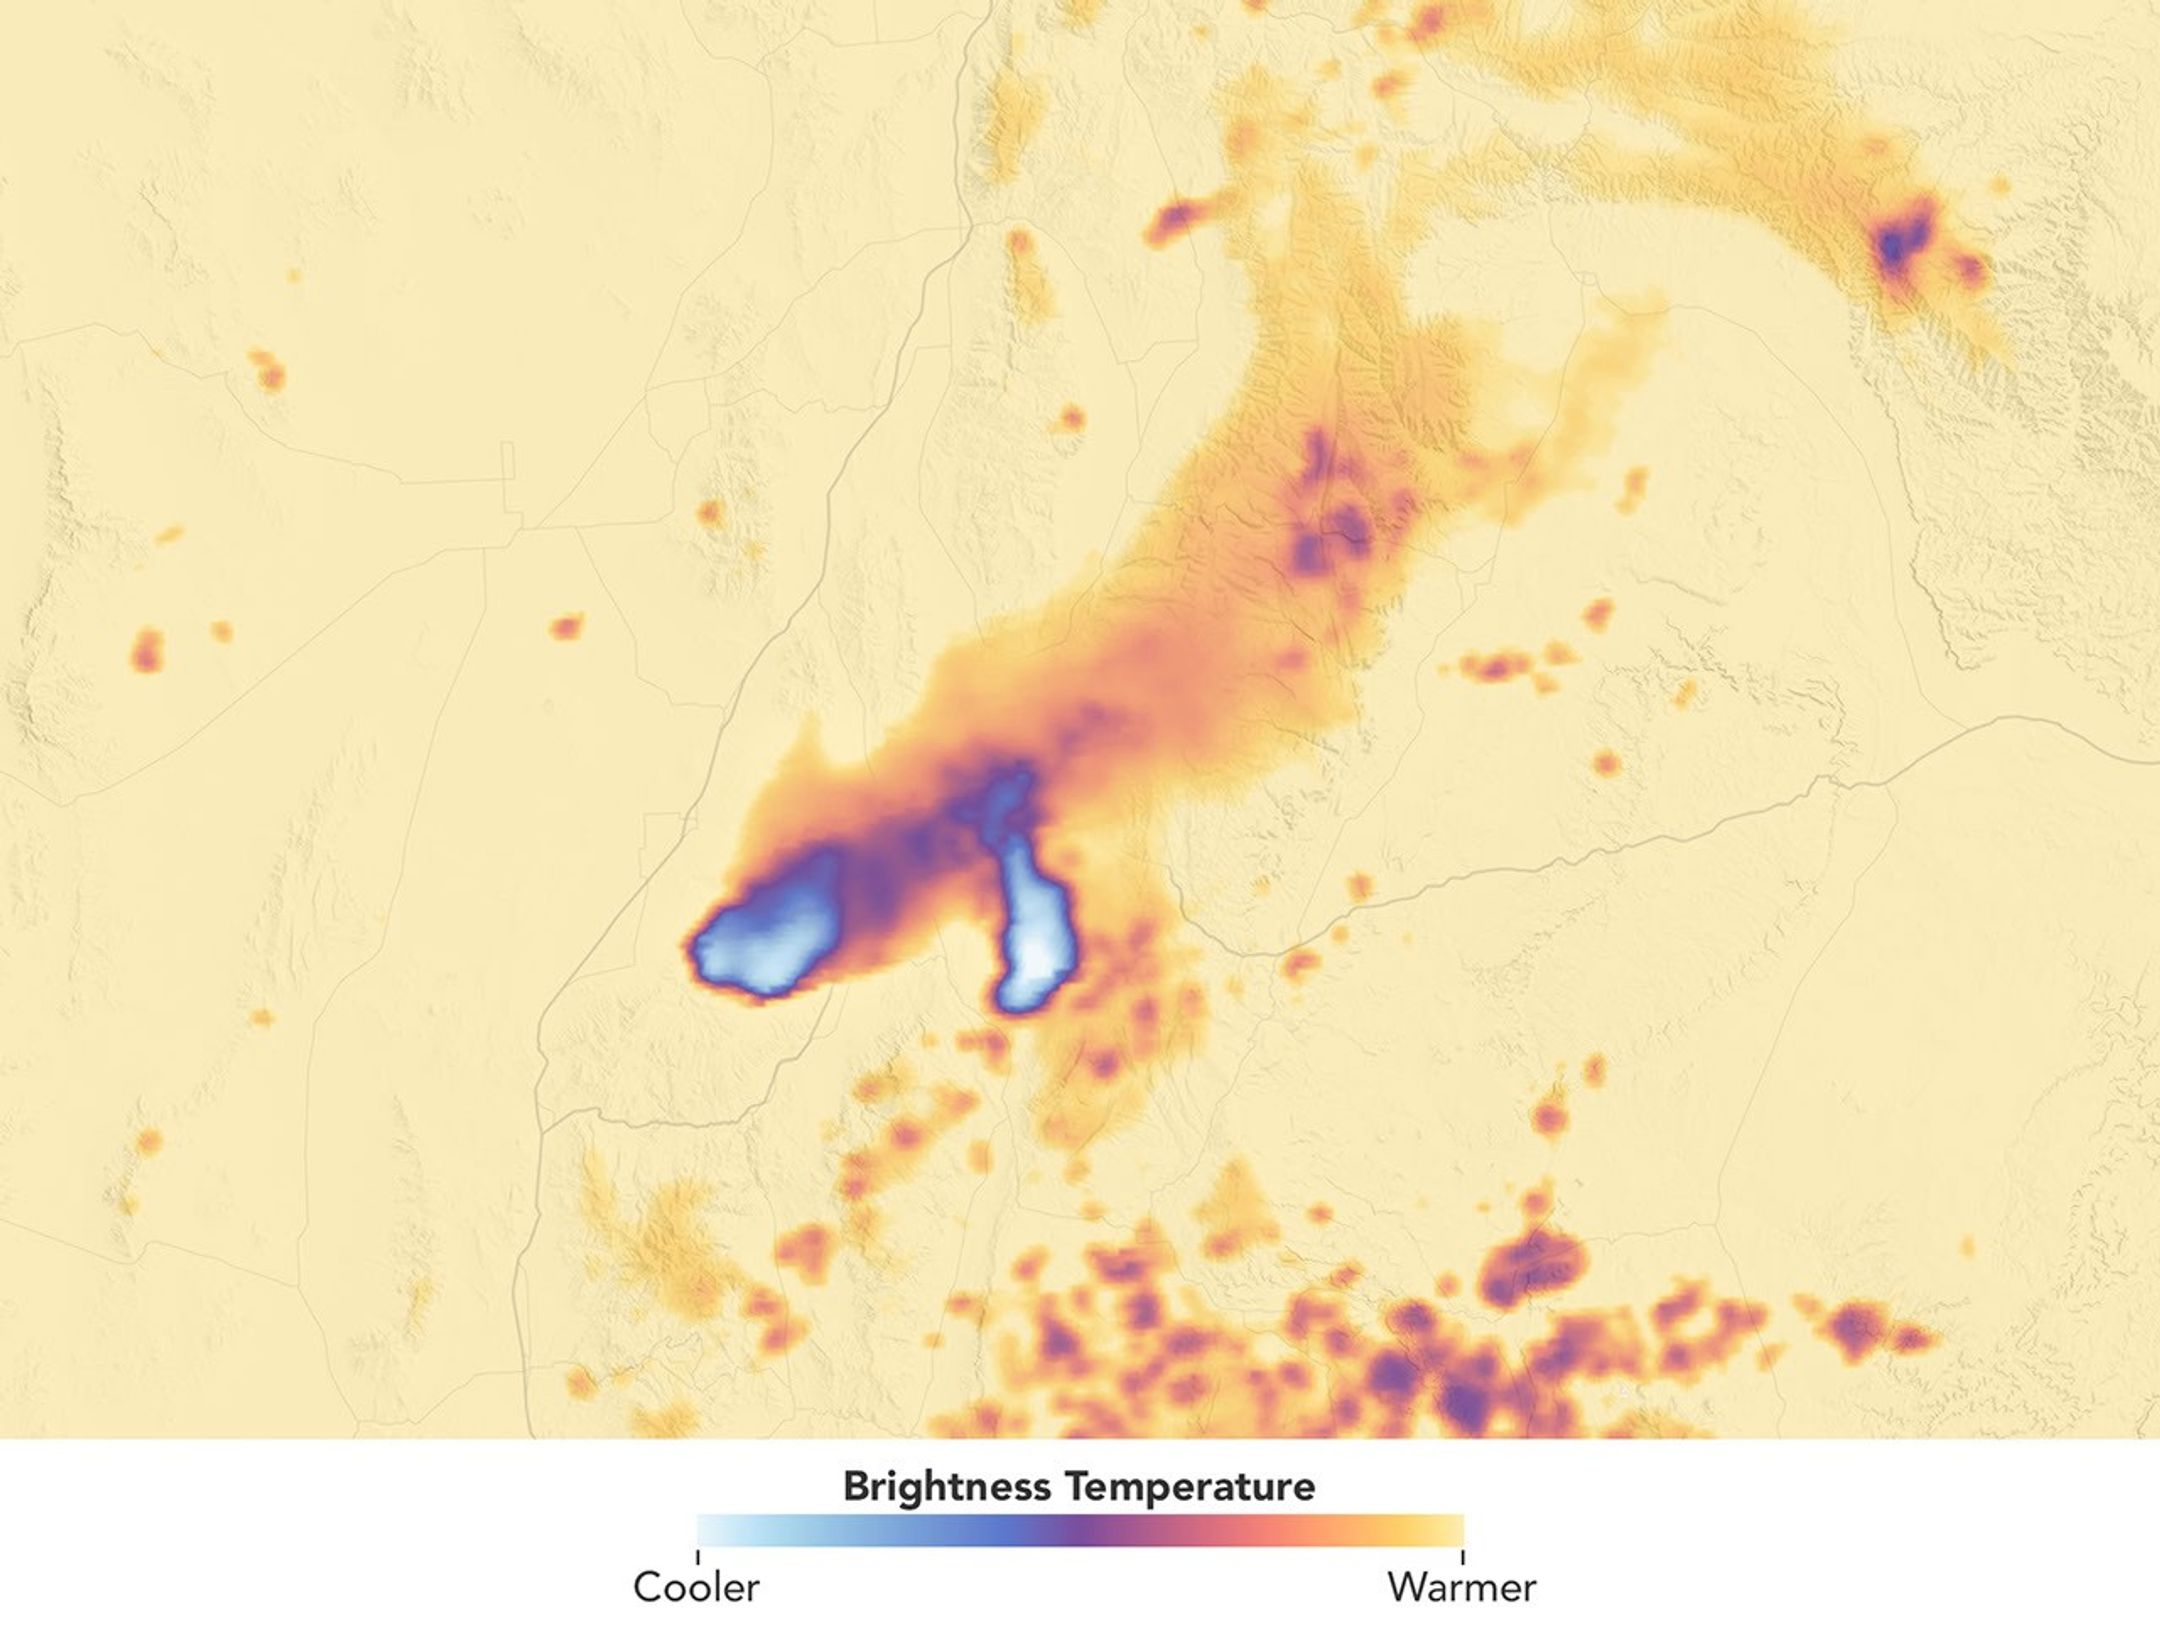
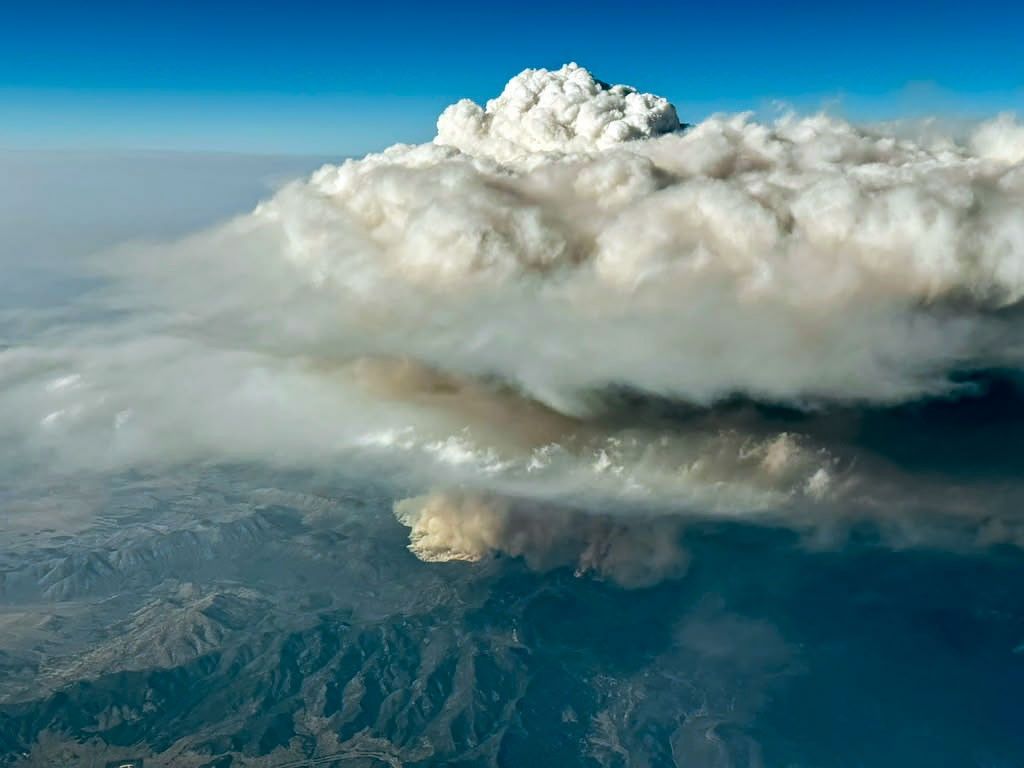
Satellite imagery captured wildfires burning hot enough to generate pyrocumulonimbus clouds north of Lake Superior in July 2026. NASA aircraft will help scientists study the powerful storms as they develop.
Credits:
CSU/CIRA & NOAA

Landslides in Alaska. Air quality in Atlanta. Fire clouds out West. From the Arctic fringes to farm country, NASA’s newest class of suborbital Earth Venture missions is gearing up to deliver science that will benefit communities in the United States and beyond. 

The six projects will mobilize hundreds of scientists and pilots from NASA, the U.S. Navy, universities, and other institutions over the next several years. While the investigations range across topics, a defining feature of suborbital missions is the use of sensors mounted on aircraft. 

Airborne remote sensing serves as a bridge between ground-based instruments and satellites. Data collected via planes, helicopters, drones, and balloons can fill in gaps in computer models used by weather forecasters, city planners, and others.  

When wildfires create their own weather 

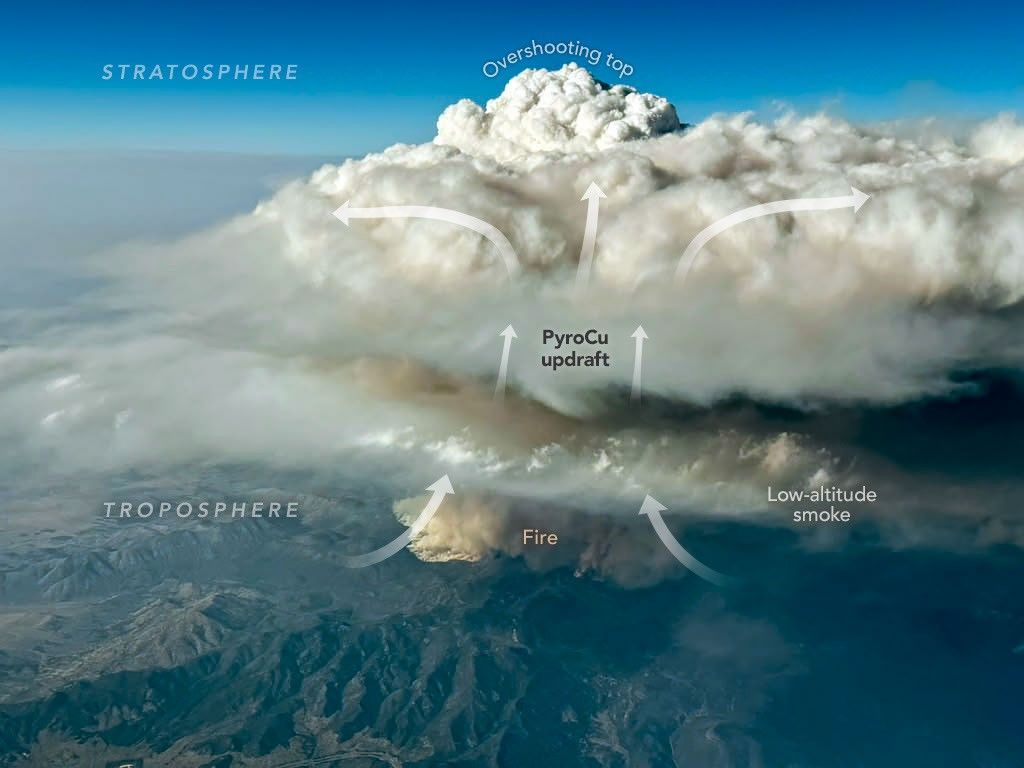
The first project to take wing this summer is Injected Smoke and PYRocumulonimbus Experiment (INSPYRE), led by the Naval Research Laboratory. From mission headquarters in Colorado, the team will chase one of the least understood forms of severe weather on Earth: towering “fire clouds” generated when extreme wildfires burn hot enough to brew their own thunderstorms.  

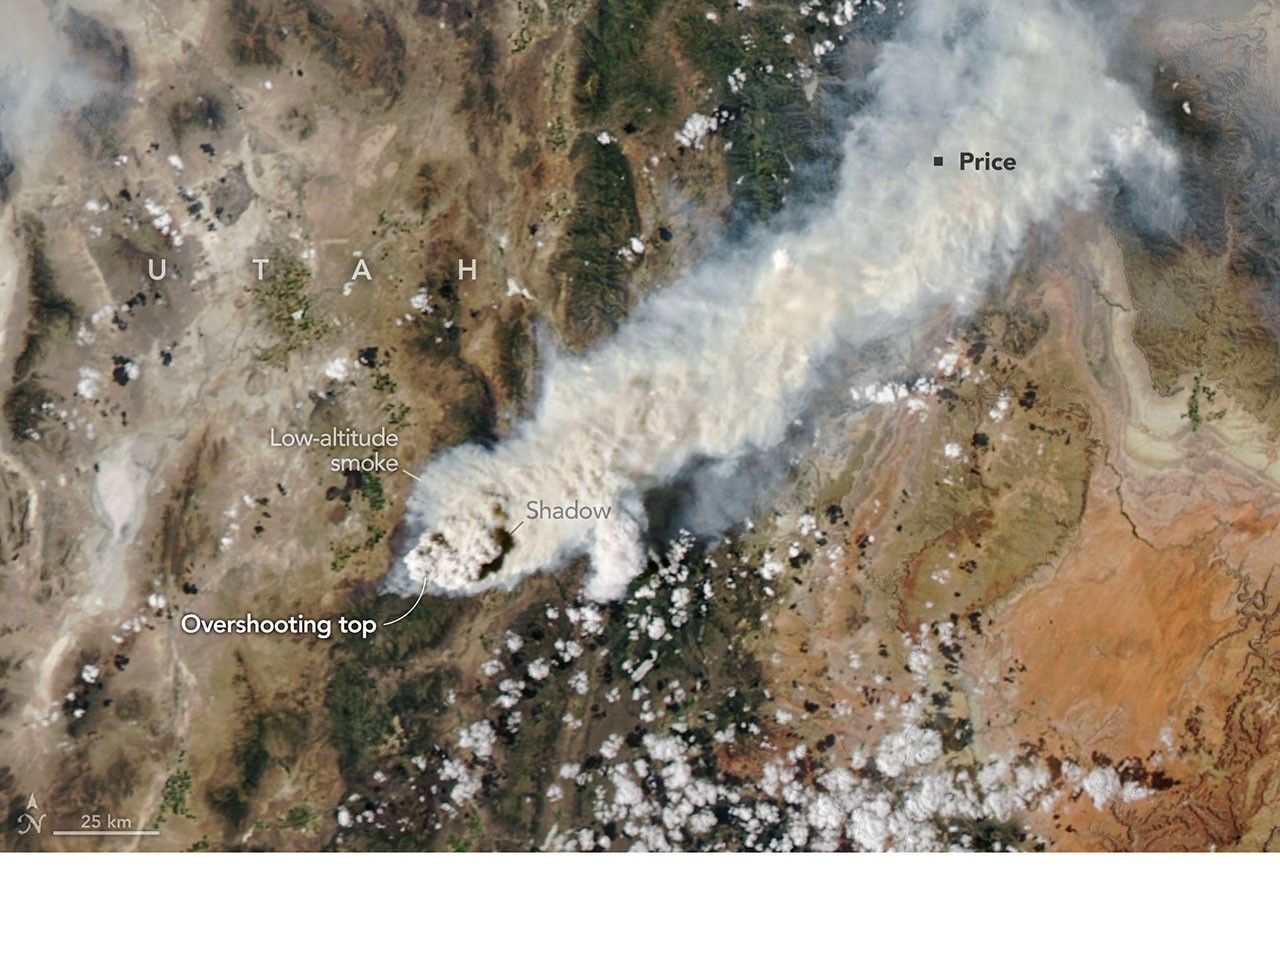
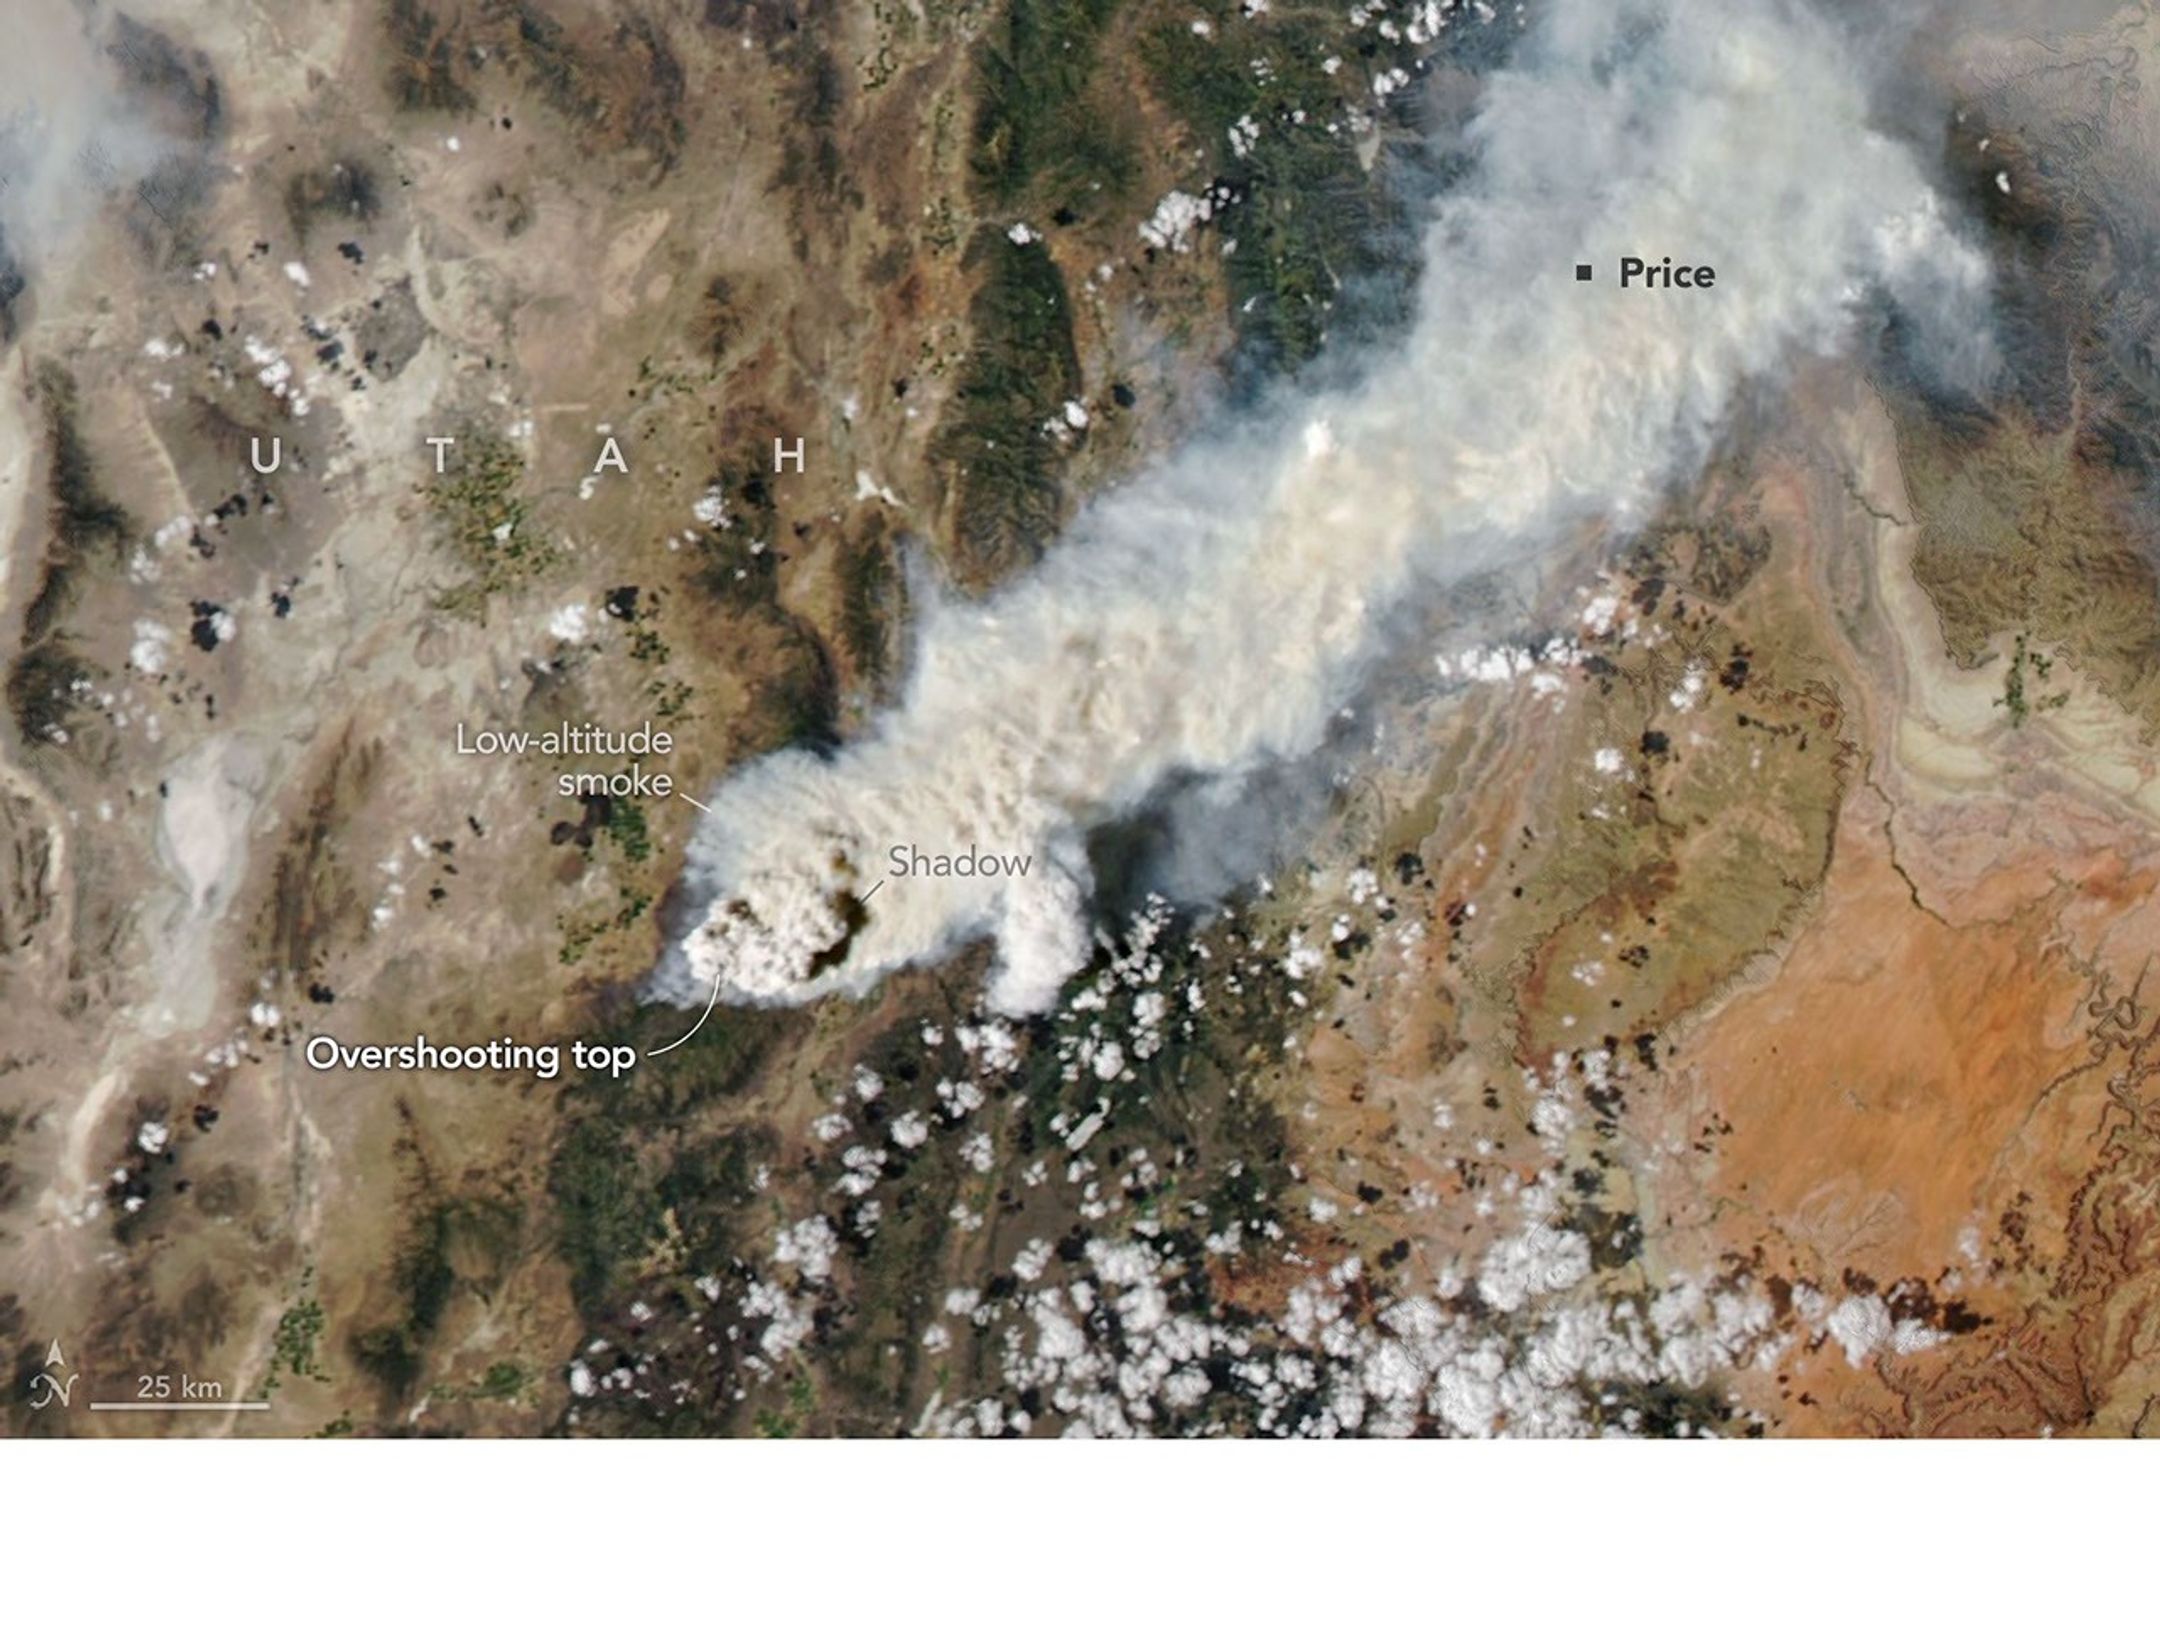
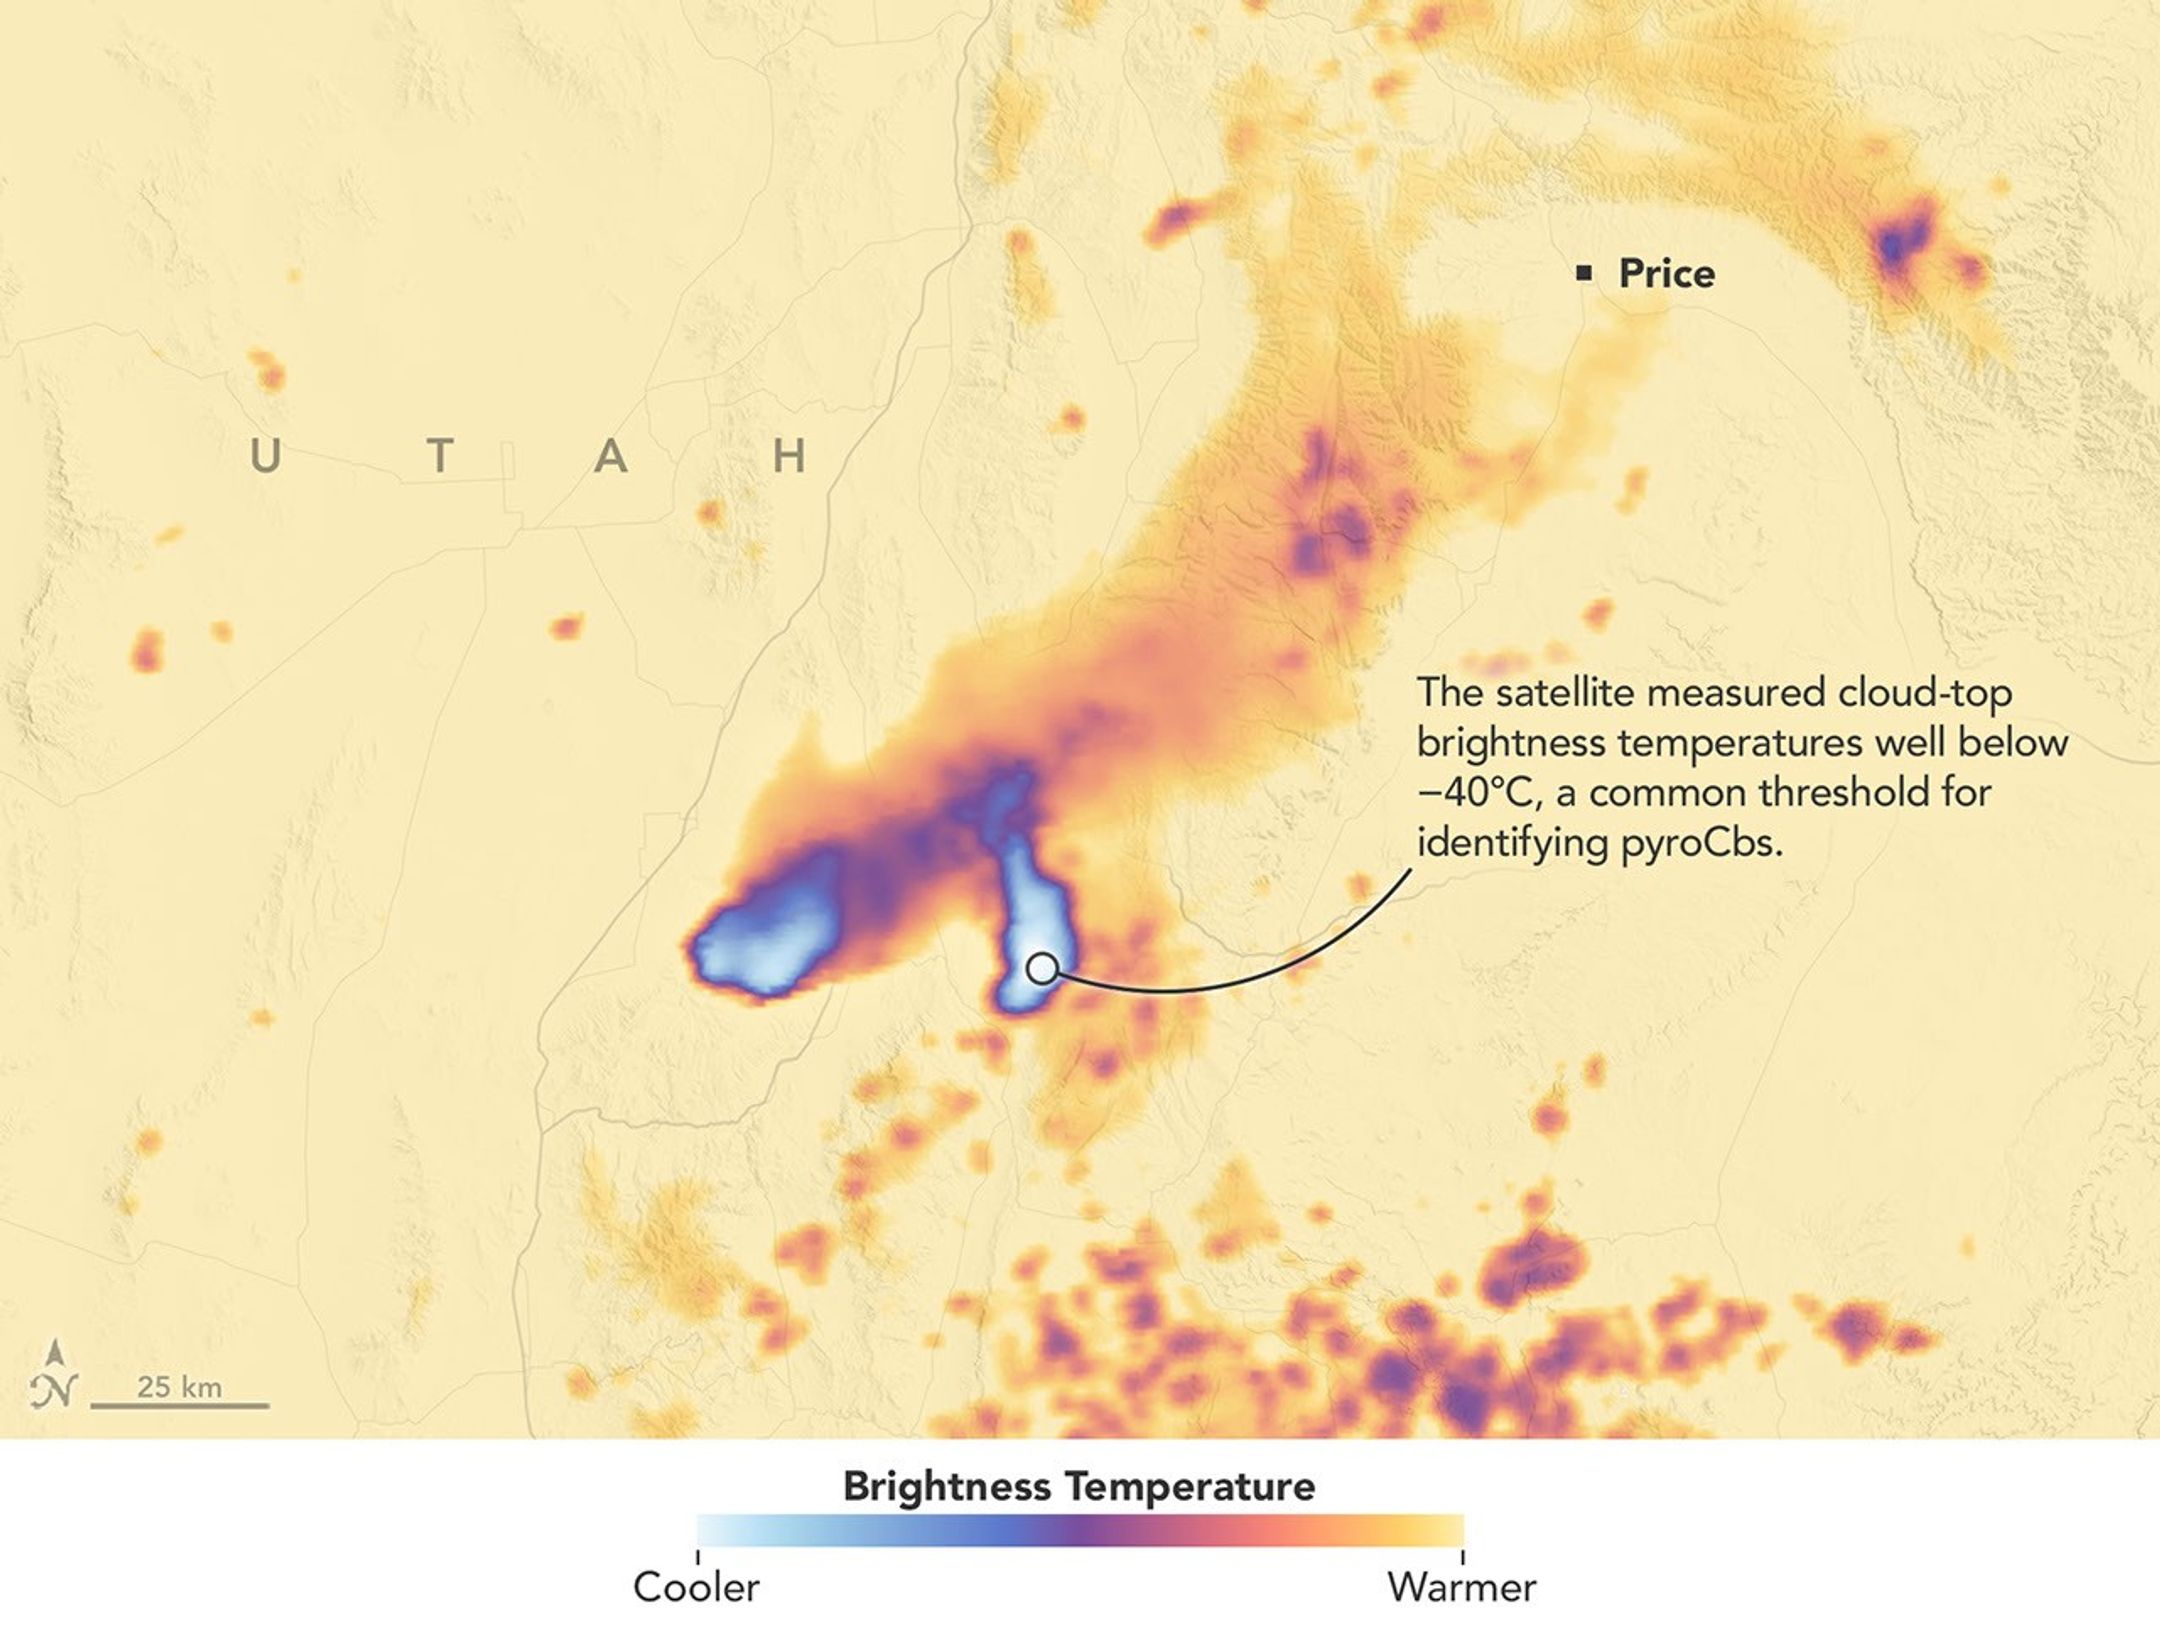
Pyrocumulonimbus clouds crackle with lighting in imagery captured over Utah and Colorado by the GOES-18 satellite in early July 2026.
CSU/CIRA & NOAA

Smoky and crackling with lightning, these unique storms can create blind spots for aviators above and spark new blazes below. Measuring and mapping the dangerous storms as they develop in real-time will help scientists forecast them in the future. Several aircraft, including NASA’s high-altitude ER-2, flying out of Montana, will carry a large suite of instruments over wildfire-generated storm systems. Among them will be two state-of-the-art infrared wildfire trackers, which were developed at NASA’s Jet Propulsion Laboratory (JPL) in Southern California and will be flying as part of the agency’s FireSense program.  

Testing the air over farmland, megacities 

Agricultural emissions represent an important and understudied part of Earth’s land and atmosphere systems. The FarmFlux mission, which kicks off this year, will deploy more than a dozen sensors to measure ozone, methane, ammonia, particulates, and other pollutants rising from agricultural lands and animal farms stretching from the Midwest to California’s Central Valley. These emissions affect human health, global climate, and stratospheric ozone. The mission is led by NASA’s Goddard Space Flight Center in Greenbelt, Maryland, along with Colorado State University, and Boston University. 

A Boeing 777 wide-body twin-engine aircraft looms on a taxiway, viewed directly from the front.
NASA’s 777 aircraft is gearing up to start science flights. Structural modifications – like enlarged cabin windows and instrument portals – have transformed the former passenger plane into a flying laboratory. It’s seen here at Langley Research Center in Hampton, Virginia, in April 2026.
NASA/Ryan Hill

Two North American cities with air quality concerns are Atlanta and Mexico City. But the causes differ, with weather and terrain playing a role. To explore these differences, the Hemispheric Airborne Measurements of Air Quality (HAMAQ) mission will investigate areas of poor air in the two capitals and test how satellite information can help forecasting and mitigation efforts. The team will deploy two aircraft at different altitudes: NASA’s P-3B will fly close to the surface, directly measuring fine particle and gaseous pollutants, while the recently acquired 777 science jet will soar high above, mapping pollution with remote sensors.  NASA’s Langley Research Center in Hampton, Virginia, is leading the mission. 

Fast-changing north 

As the Arctic warms at least twice as fast as the rest of Earth, data collected today can help guide communities on the front lines of change.  

Amid a rugged landscape, a snow-white glacier spills into dark blue water.
Alaska’s glaciers are losing ice and contributing to sea level rise. NASA is tracking the changes from land, air, and space.
NASA

The Snow4Flow campaign, led by the University of Arizona, seeks to measure and model how far and fast glaciers are retreating in the far north. Traversing remote icescapes across Alaska, the Yukon, Arctic Canada, Greenland, and Svalbard, Norway, they’ll sound both the near-surface and frozen depths of hundreds of glaciers while flying over in a modernized WWII-era aircraft outfitted with a scanning laser altimeter and two custom radars. Their observations, combined with satellite data and advanced models of snowfall and glacier flow, will advance our understanding of how glaciers behave in different regions of the Arctic. The mission seeks to uncover not just what these glaciers look like beneath the surface today, but the processes that will drive changes in the future. 

As permafrost thaws, rivers on the doorstep of the Arctic become conveyor belts of carbon and sediment. NASA Goddard, and the City College of New York lead a multidisciplinary team studying how rivers, lagoons, and estuaries across Alaska’s North Slope interact with the Arctic Ocean. The project, called Frontlines of Rapidly Transforming Ecosystems (FORTE) will combine optical and radar measurements from satellites, planes, high-tech research vessels, drones, and underwater autonomous systems to track microscopic marine life, water flow, and chemistry. The team will collaborate with local and tribal communities to sustain observations over time and apply NASA assets to address emerging local needs and decision-making priorities.  

Landslide triggers 

When a slow-moving landslide in California suddenly collapsed and buried a section of coastal highway in 2017, scientists at NASA JPL wanted to know how precipitation swings played a role. JPL studies how water infiltrates and destabilizes hillslopes all over the world. The Landslide Change Characterization Experiment (LACCE) project will combine airborne synthetic aperture radar with land-based sensors to track how slopes in California are responding to a world of intensifying droughts and downpours. The project also takes aim at emerging landslide hazards in Alaska, where rapidly retreating glaciers are accelerating slope movements that have the potential to create mega-tsunamis.  

This series of images shows the collapse of the Mud Creek landslide in May 2017 along the Big Sur coast in Central California, and the subsequent repairs to Highway 1, which was damaged during the event.
Andy Ritchie/USGS Pacific Coastal and Marine Science Center

NASA’s Earth Venture Suborbital program, designed to be nimble and high impact, was established following a recommendation by the National Research Council in 2007. In the decades since, teams have studied phenomena, including blizzards, coral reefs, and ocean whirlpools.  

About the Author

Sally Younger

Share

Details

Last Updated
Jul 21, 2026

Google-backed satellites for wildfire detection launch as smoke chokes US, Canada

As smoke from hundreds of burning wildfires spread across Canada and the United States, the first three operational satellites in the Google-backed FireSat program successfully launched into orbit. The satellites will begin providing wildfire detection capable of spotting even small fires in the United States, Australia, and Europe before the end of the year.

The launch of the microsatellites aboard a SpaceX Falcon 9 rocket from Vandenberg Space Force Base in California on July 7, 2026 marks a transition to “initial operational capability” for the FireSat constellation managed by the nonprofit Earth Fire Alliance. After a three-month testing period, the three satellites will begin actively providing data to fire agencies while covering every fire-prone region on Earth at least twice per day.

FireSat represents the first satellite constellation purpose-built for detecting wildfires, including spotting smaller fires that other satellites may miss. The satellites were designed by California-based satellite manufacturer Muon Space and have received over $15 million from Google to support initial deployment. Other notable financial supporters include the Bezos Earth Fund that committed $26 million.

Read full article

Comments

© Muon Space

Ontario Wildfire Smoke Moves East

A satellite image shows brown smoke from wildfires in Ontario, Canada, streaming east across parts of Canada and the U.S. Areas of white clouds are mixed in with the smoke.
Smoke from wildland fires pours eastward over Canada and the U.S. in an image captured on the afternoon of July 14, 2026, by the VIIRS (Visible Infrared Imaging Radiometer Suite) on the NOAA-21 satellite.
NASA Earth Observatory/Lauren Dauphin

After a slow start to Canada’s 2026 fire season, activity picked up by the end of June amid dry, warm conditions and returned closer to the 25-year average. By mid-July, almost 850 fires were actively burning across the country, according to the Canadian Interagency Forest Fire Centre. More than 180 of those were burning in Ontario.

This NOAA-21 image, acquired on the afternoon of July 14, 2026, shows smoke billowing from the Ontario fires. Winds carried the smoke primarily southeast over much of the southern part of the province, as well as parts of Quebec and the U.S. Midwest and Northeast, tinting the sky shades of gray and yellow and the Sun orange in many areas.

The smoke’s impact on air quality varied, depending largely on altitude. In areas where smoke was high in the atmosphere, air quality impacts were negligible; where it drifted closer to the ground, conditions worsened. Air quality in Toronto, for instance, reached unhealthy levels, according to AirNow. People in the southern parts of the province were also grappling with a heat wave, compounding the health risks.

Much of the smoke came from fires in Northwestern Ontario, where eight blazes saw significant growth on July 13 and 14. The fires prompted officials to issue evacuation orders for several communities in this part of the province, according to news reports.

As of July 14, fires across Canada have burned 1.9 million hectares (4.7 million acres) since the start of the year—still well below the season totals from the extreme fire years of 2023 and 2025. How the rest of the season plays out remains to be seen. A seasonal fire outlook—compiled by wildland fire experts from the U.S., Canada, and Mexico—shows where fire conditions are more or less likely through July, August, and September.

NASA Earth Observatory image by Lauren Dauphin, using VIIRS data from NASA EOSDIS LANCE , GIBS/Worldview , and the Joint Polar Satellite System (JPSS). Story by Kathryn Hansen.

Downloads

A satellite image shows brown smoke from wildfires in Ontario, Canada, streaming east across parts of Canada and the U.S. Areas of white clouds are mixed in with the smoke.

July 14, 2026

JPEG (3.96 MB)

References & Resources

You may also be interested in:

Stay up-to-date with the latest content from NASA as we explore the universe and discover more about our home planet.

Fighting Fire With Fire

3 min read

In fire-prone ecosystems in Australia’s Northern Territory, prescribed burns are lit to minimize the severity of fires later in the…

Article

Fires Tear Through Nebraska Grasslands

3 min read

Dry, warm, and windy conditions across the U.S. Great Plains led to extreme fire activity in March 2026.

Article

Cottonwood Fire Chars Utah

5 min read

The blaze burned more than 150 square miles and swept through parts of a ski resort.

Article

Cottonwood Fire Chars Utah


June 5
June 29

Mountainous landscapes appear green and untouched by fire in a satellite image acquired on June 5, 2026.
NASA Earth Observatory/Michala Garrison

An image of the same area shows a large brown patch spanning much of the image in an image acquired after the fire on June 29, 2026.
NASA Earth Observatory/Michala Garrison

Mountainous landscapes appear green and untouched by fire in a satellite image acquired on June 5, 2026.
NASA Earth Observatory/Michala Garrison
An image of the same area shows a large brown patch spanning much of the image in an image acquired after the fire on June 29, 2026.
NASA Earth Observatory/Michala Garrison

June 5

June 29


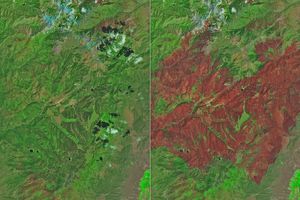
A burned landscape spans more than 150 square miles (390 square kilometers) of rugged terrain northwest of Junction, Utah, as seen in this pair of images captured by the OLI (Operational Land Imager) on Landsat 8 and Landsat 9 on June 5, 2026 (left) and June 29, 2026 (right). NASA Earth Observatory images by Michala Garrison.

After a winter of below-average snowpack and an unusually warm and dry start to summer, the National Interagency Fire Center warned that the Great Basin and parts of the Rockies faced an elevated risk of wildfires in July 2026.

The warning proved accurate. By July 7, firefighters labored to contain nearly three dozen large, early-season wildland fires that raced through forests in several parts of the western U.S. Utah was among the most active states, with fires having charred 558 square miles (1,445 square kilometers) and four major fires that were not fully contained still burning.

The Cottonwood fire ranked as one of Utah’s—and the country’s—largest and most destructive fires of the year so far. As of July 7, it had burned 150 square miles (390 square kilometers), just shy of the Babylon fire in eastern Utah. Landsat 9 captured the false-color image (bands 7-5-4) above (right) on June 29, 2026, when blackened vegetation spanned a large patch of rugged terrain along the Beaver River. The image on the left shows the same area on June 5, a few weeks before the fire ignited. In this band combination of shortwave infrared, near infrared, and visible light, unburned vegetation appears bright green, snow is blue, and clouds are white.

Ponderosa pine, oak, sagebrush, and grasses were among the vegetation types that burned. Officials with the state’s forestry division told news media that the Cottonwood fire had destroyed up to 150 structures. Eagle Point Ski Resort, which lost more than 100 condos and 30 cabins, also reported damage to four of its five chairlifts.

The damage to forests was extensive, though isolated patches survived largely unscathed, remaining as green oases within the broader burned area. Among them were the forests around Tushar Campground, the site of a 4-H summer camp. Beaver County officials credited years of forest treatments, such as clearing brush and trimming branches, with helping save the campground and surrounding forests.

The fire spreads especially rapidly on June 23 and June 26. The fire perimeters in this visualization are based on data from NASA’s Fire Events Data Suite.
NASA Earth Observatory/Michala Garrison

As the fire spread, NASA’s Fire Events Data Suite (FEDS) tracked its progression and rate of growth. The visualization above, based on the FEDS system, shows the fire surging on June 23 and tripling in size over 12 hours that day as it spread to the north, east, and south. It also grew rapidly on June 26, when it made a run to the north. FEDS draws on data from the VIIRS (Visible Infrared Imaging Radiometer Suite) sensors aboard the Suomi NPP, NOAA-20, and NOAA-21 satellites, which detect active fires day and night by their thermal infrared signature.

FEDS is one of several tools available to firefighters and emergency management officials when responding to fires. First responders often rely on higher-resolution airborne imagers or on firefighters walking fire edges to map perimeters. FEDS offers a different advantage: consistent, easily accessible data that do not need to be specially requested, according to Tempest McCabe, a University of Maryland scientist based at NASA’s Goddard Space Flight Center who helped develop the tool. As a result, FEDS often detects a fire’s start earlier than other sources and tracks blazes for their full duration. To capitalize on strengths like these, the FEDS team is working closely with operational fire behavior analysts, with support from NASA’s FireSense program, to better understand and anticipate periods of rapid fire spread.

A total of 1,289 firefighters have been deployed to the Cottonwood fire, according to InciWeb, a website managed by the National Interagency Fire Center. As of July 7, the fire was 56 percent contained, but forecasters expect a hot, dry weather pattern to persist in the coming days, with fire behavior likely to be “very active to extreme” over the next 72 hours.

Government satellite data are part of a global system of observations used to track fire behavior and analyze emerging trends. Among the real-time wildfire monitoring tools that NASA makes available are FIRMS (Fire Information for Resource Management System), the Worldview browser, and the Fire Event Explorer.

As of July 7, 2026, fires had burned 5,265 square miles (13,636 square kilometers) across the United States, according to the National Interagency Fire Center. That’s 46 percent more than the 10-year average (2016-2025) for that point in the season.

NASA Earth Observatory images by Michala Garrison, using Landsat data from the U.S. Geological Survey and fire perimeter data from the Fire Events Data Suite. Story by Adam Voiland.

Downloads

Mountainous landscapes appear green and untouched by fire in a satellite image acquired on June 5, 2026.

June 5, 2026

JPEG (1.39 MB)

An image of the same area shows a large brown patch spanning much of the image in an image acquired after the fire on June 29, 2026.

June 29, 2026

JPEG (1.41 MB)

An animation shows the expansion of the fire between June 23 and July 7, with the burned area from the fire beginning as a small patch near Beaver, Utah, and then spreading north, east, and south.

FEDS fire perimeter (June 23-July 7)

JPEG (1.80 MB)

References & Resources

You may also be interested in:

Stay up-to-date with the latest content from NASA as we explore the universe and discover more about our home planet.

Fires Tear Through Nebraska Grasslands

3 min read

Dry, warm, and windy conditions across the U.S. Great Plains led to extreme fire activity in March 2026.

Article

Fire’s Footprint on Santa Rosa Island

3 min read

A wildland fire charred grassland, coastal sage scrub, and chaparral across one-third of the island, the second largest of the…

Article

Smoke Rises Over Big Cypress National Preserve

2 min read

The National fire has burned tens of thousands of acres within the Florida preserve, fueled by vegetation dried by prolonged…

Article
❌