Argonne researchers study the movement of dust particles from concrete surfaces during a simulated radiological contamination scenario, measuring how pedestrians and moving cars affect the spread of the particles.
Almost a year ago, OTW spoke about quantum computers and the risk of our encryption getting broken within three years. In March, Google shared its concern on the same issue, moving up its own post-quantum migration deadline to 2029. Some companies are migrating to mitigate that risk, but not many are taking it seriously. Eventually, a huge number of companies are going to get left behind with weak and breakable encryption. Hackers will only benefit from that negligence.
To help you minimize the risk and get an actionable plan with recommendations tailored to your company, we want to show you how AC-Scanner works.
AC-Scanner
AC-Scanner is basically a script for post-quantum cryptography exposure assessment. It maps your full cryptographic attack surface across TLS endpoints and SSH services, assesses every asset against NIST post-quantum standards and generates a structured Cryptographic Bill of Materials (CBOM).
Before we continue with the scan, you might want to watch a video by OTW and David Bombal on the risk of quantum computing being able to decrypt things at mass scale and expose session keys.
Setting Up
Docker is the easiest way to get started. We’ll start with the CLI version first, then show you how to get the web version up and running. They both work the same way, so you can choose any.
root > docker run --rm -it qubitac/acscanner:latest bash -c 'rm -f /.dockerenv && cd /app/scripts && ./scan.sh -h'
We’re only interested in the presets here. As you can see, you can test basically any of your assets.
Scanning Assets – CLI
Let’s choose some random Russian company for this scan. We don’t intend them to benefit from the results, we will just use it for demonstration to show how prevalent the issue is.
If you’re testing a big company, it will take time.
Results will be stored in ~/ac-scans
Here we only need crypto-bom.json that’s hiding in cbom.
Results
Upload crypto-bom.json to the dashboard by clicking Load CBOM. You will see the overview.
You can already see the infrastructure is not PQC ready and has several critical issues.
The next step is HTTPS. Although 9 of their endpoints are using HTTPS, it’s vulnerable and the risks are high.
The scanner tried to fingerprint the SSH endpoints too, but they weren’t open.
Let’s look at the issues that the company has. It will show all the affected hosts with severity assigned to each.
Quantum risks may help tracking the progress of your migration. The results below are from a different company, but you can see they have only 3 PQC ready hosts out of 308.
Recommendations will help you address issues by giving you prioritized actions.
The recommendations were intentionally redacted by us to make them unusable. However, you can still clearly see how the page is structured.
Finally, your main goal is migration. Here it lists all the migration phases and gives you deadlines by which they need to be completed.
As you can see, legacy TLS should be abandoned by 2027 and hybrid PQC key exchange should be introduced no later than 2028. That applies to everyone, not just this organization in particular. The report gives clarity and orients your client so there’s no confusion.
Scanning Assets – Web
If you don’t want to work in the terminal, you can use the web version.
It’s available in the browser on http://localhost:8080/.
Summary
AC-Scanner is easy to work with if you use Docker, otherwise you’ll run into some incompatibility issues. The dashboard has all the valuable information and most importantly it’s actionable and orienting. You don’t just see the vulnerabilities, you get a guide with recommendations on how to fix them too. Your client will definitely appreciate that.
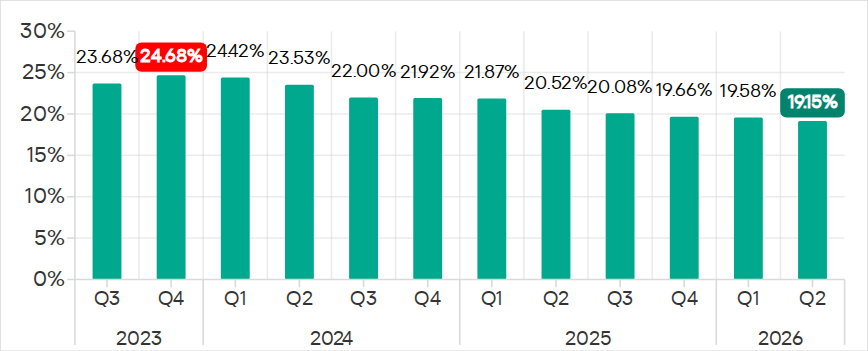
In Q2 2026, the percentage of ICS computers on which malicious objects were blocked continued to decrease, falling to 19.15%, its lowest level since 2022.
Percentage of ICS computers on which malicious objects were blocked, Q3 2023–Q2 2026
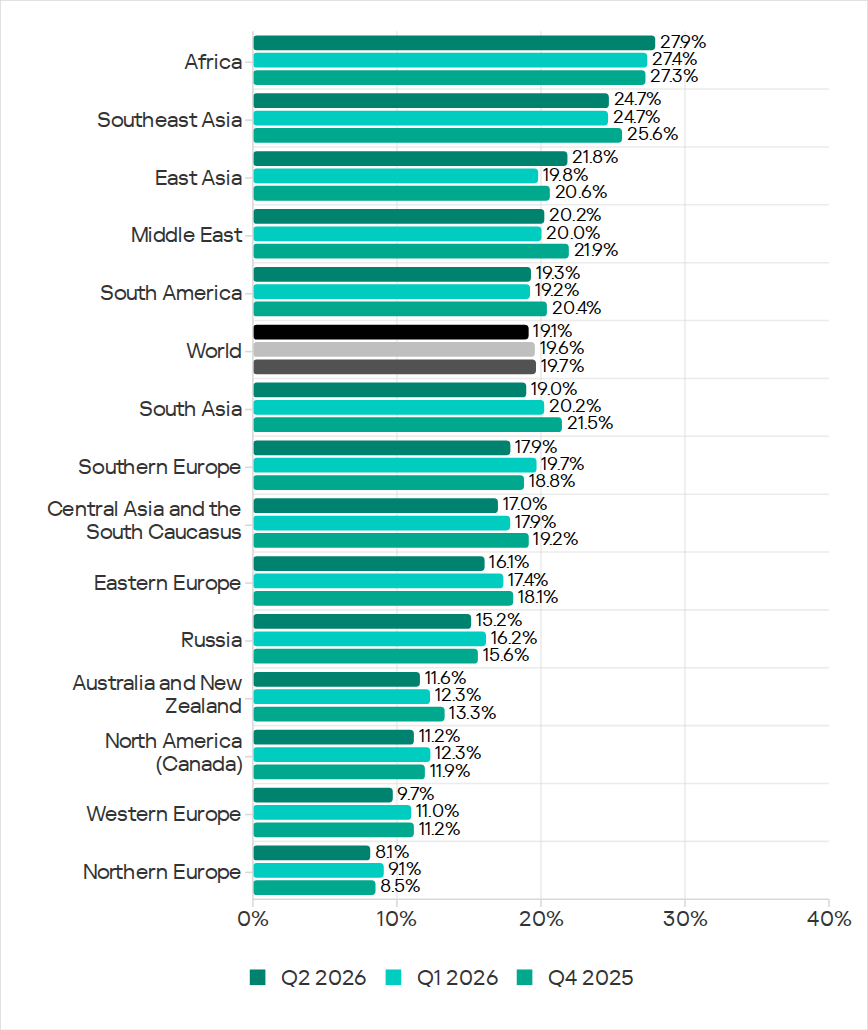
Regionally, the percentages ranged from 8.1% in Northern Europe to 27.9% in Africa.
Regions ranked by percentage of attacked ICS computers
The figures increased in five regions over the quarter, most notably in East Asia (by 2.0 pp) and Africa (by 0.5 pp).
East Asia saw increases in percentages for all threats except miners. The region ranked first in terms of growth for malicious scripts and phishing pages, spyware, and viruses. East Asia also led in terms of growth in threats from the internet. The percentage of ICS computers on which email threats were blocked also increased.
Selected industries
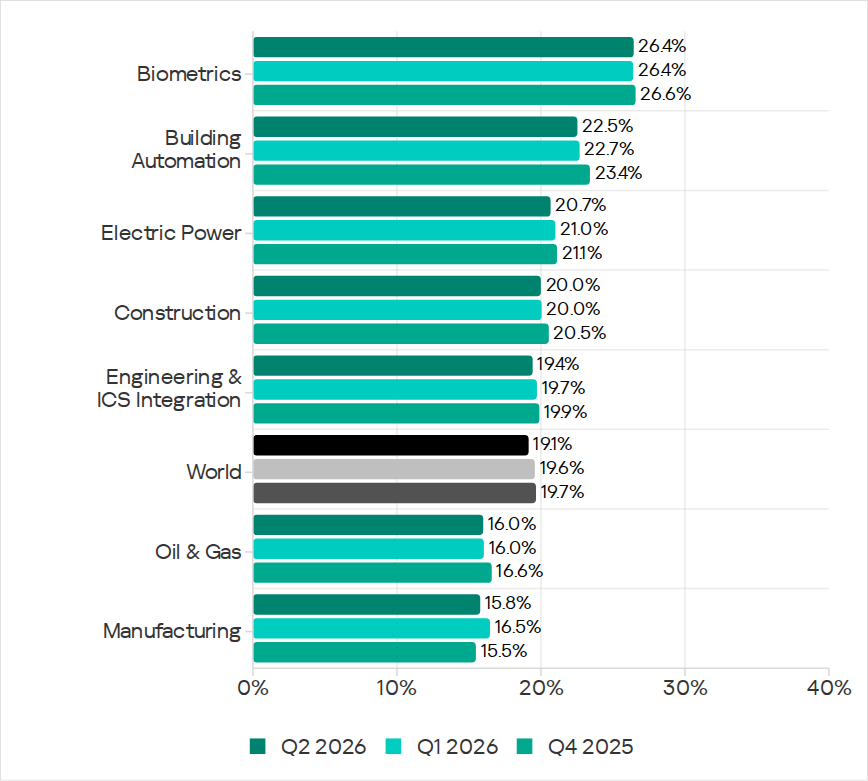
The biometrics sector (26.44%) has traditionally led the rankings of industries and OT infrastructures surveyed in this report in terms of the percentage of ICS computers on which malicious objects were blocked. Biometric systems are characterized by the availability of internet access, extensive email use for data exchange and approvals (e.g. access granting), and, in many cases, minimal cybersecurity controls within the organizations that use them.
Industries ranked by percentage of ICS computers on which malicious objects were blocked
The biometrics sector ranked first among industries in terms of the following threat categories: malicious scripts and phishing pages, malicious documents, spyware, ransomware, and worms. The sector is also leading among industries in terms of email threats. At the same time, unlike other industries, the percentage of affected ICS computers for email threats in biometrics exceeds that for internet threats.
In all selected industries, the global average follows a downward trend.
Threat categories
In Q2 2026, Kaspersky security solutions blocked malware from 10,904 different malware families of various categories on industrial automation systems.
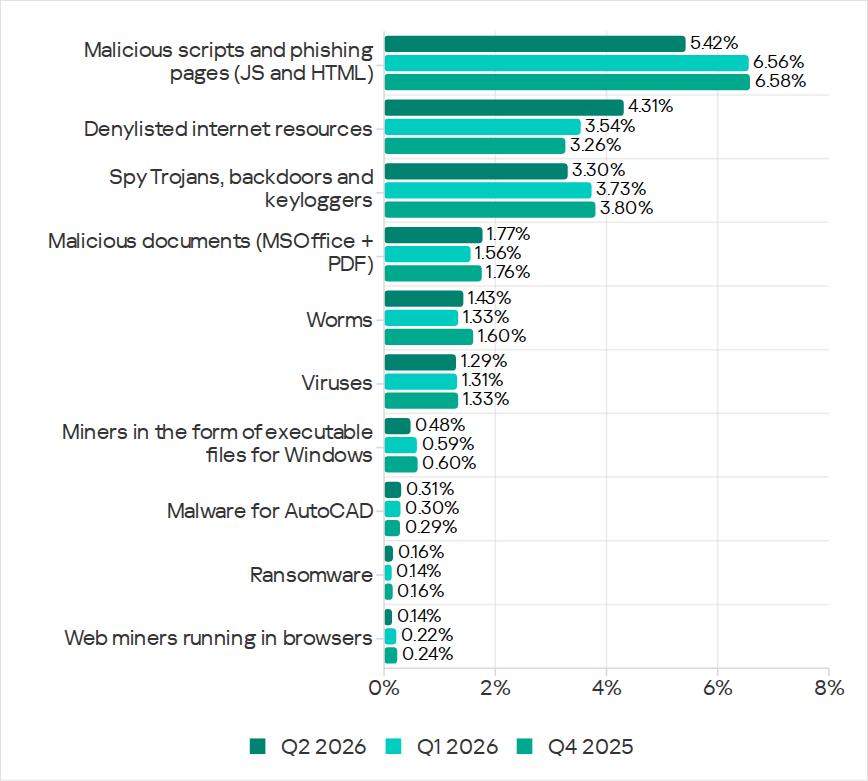
Over the quarter, the percentage of ICS computers on which malicious objects of the following categories were blocked increased: denylisted internet resources, malicious documents, worms, ransomware, and malware for AutoCAD.
Percentage of ICS computers on which the activity of malicious objects from various categories was blocked
Malicious scripts and phishing pages (JS and HTML)
Malicious scripts and phishing pages remained in first place in the threat category rankings based on the percentage of ICS computers on which the respective threats were blocked. In Q2 2026, the global average dropped to 5.42%.
Over the quarter, the figure for this category only increased in East Asia, rising by 0.93 pp to 4.86%. This is the second-highest figure in the region in the last three years.
In East Asia, the percentage of ICS computers affected by malicious scripts and phishing pages increased in all the industries surveyed, except construction. The highest figures were recorded for biometrics (9.01%) and building automation (6.49%).
Denylisted internet resources
In Q2 2026, denylisted internet resources rose in the threat category rankings from third to second place, displacing spyware. Globally, the percentage of ICS computers on which denylisted internet resources were blocked has been increasing for two quarters in row and reached 4.31%.
The figures increased in all regions over the quarter, most notably in Russia (by 1.33 pp). Moreover, Russia ranked first (5.17%) among the regions in terms of denylisted internet resources. Since 2022, the region has topped these rankings twice before, both times in Q2: in 2022 and 2024.
Among the selected industries in Russia, the highest figures for the denylisted internet resources were in the electric power (6.61%) and engineering and ICS integration (5.62%) industries.
Malicious documents (MSOffice + PDF)
Malicious documents ranked fourth in the threat category rankings by the percentage of ICS computers on which they were blocked. The percentage for this category decreased over the previous three quarters, reaching its lowest level in three years. However, in Q2 2026, it increased to 1.77%.
Over the quarter, the figures for malicious documents increased in seven regions, most notably in South America (by 1.35 pp) and Southern Europe (by 0.48 pp). These two regions are among the top three in terms of malicious documents, malicious scripts and phishing pages, as well as threats from email clients.
South America ranked second in the rankings of regions in terms of malicious documents. In Q2 2026, the percentage of ICS computers in the region on which this threat was blocked was 3.56%, which was the fourth highest in three years.
Among the selected industries in South America, the highest percentage of ICS computers on which malicious documents were blocked was in biometrics (6.67%).
Southern Europe ranked first in the rankings of regions in terms of malicious documents. In the previous quarter, the percentage of ICS computers in the region on which this threat was blocked was the lowest in three years, but in Q2 2026 it increased to 3.63%.
Among the selected industries in Southern Europe, the highest percentage of ICS computers on which malicious documents were blocked was once again in biometrics (11.48%).
Spyware
Spyware ranked third in the threat category rankings based on the percentage of ICS computers on which it was blocked. The percentage for this category (3.30%) is the lowest since 2022.
Over the quarter, the figures increased in three regions, most notably in East Asia (by 0.53 pp) and Southeast Asia (by 0.42 pp).
East Asia ranked third based on the figures for spyware (4.77%), behind Africa and Southeast Asia. This is the region’s highest rate since Q2 2025. Among the countries and territories in the region, the highest percentage of ICS computers on which spyware was blocked was in mainland China (6.61%). Among the selected industries in East Asia, the highest figures for spyware were in the electric power (11.75%) and manufacturing (5.87%) industries. In all the industries surveyed, the figures are higher than the regional average.
Southeast Asia ranked second after Africa in the ranking of regions in terms of spyware, with 5.32%. Among the selected industries in Southeast Asia, the highest figures for spyware were in biometrics (8.93%) and manufacturing (7.32%). The figures increased in all industries over the quarter.
Ransomware
The percentage of ICS computers on which ransomware was blocked decreased in the previous three quarters but increased to 0.16% in Q2 2026.
During the quarter, the percentage increased in all regions, except Western and Southern Europe and North America (Canada). Africa led the ranking in terms of growth for this metric.
In Q2 2026, Africa ranked first among the regions in terms of the percentage of ICS computers on which ransomware was blocked (0.29%). The only time the figure in the region was higher in the past three years was Q2 2025 (0.31%).
Among the selected industries in Africa, the highest figures for ransomware were in the electric power industry (0.72%) and biometrics (0.52%). Over the quarter, the figures increased in all industries, except manufacturing and construction. The biggest increase was recorded in the electric power industry.
In Russia, the percentage of ICS computers on which ransomware was blocked in biometric systems has increased for three consecutive quarters, reaching 1.22%. This is the highest level of ransomware across all industries in all regions.
Miners
In Q2 2026, the percentage of ICS computers on which miners were blocked was the lowest since 2021, for both miners in the form of executable files for Windows (0.48%) and web miners running in browsers (0.14%).
The figures for both categories decreased in all regions, except for Africa where figures for miners in the form of executable files for Windows increased slightly.
On average, the oil and gas industry led the rankings among the selected industries both in terms of miners in the form of executable files for the Windows OS (0.66%) and in terms of web miners (0.34%).
Worms
In Q2 2026, the percentage of ICS computers on which worms were blocked increased to 1.43%.
In Q2 2026, the Middle East (2.11%) was second (after Africa) in the rankings of regions in terms of worms, displacing Central Asia and the South Caucasus.
Among the selected industries in the Middle East, the highest percentage of ICS computers on which worms were blocked was in building automation (2.90%). Over the quarter, the figures increased in all industries.
Australia and New Zealand ranked 12th among the regions in terms of the percentage of ICS computers on which worms were blocked (0.41%). Over the past three years, the figure in this region was only higher in Q2 2024 (0.42%). The figures increased in all the surveyed industries in the region, most notably in manufacturing and electric power. As a result, for these industries they exceeded the regional average by 2.9 and 2.3 times, respectively.
Viruses
In Q2 2026, the percentage of ICS computers on which viruses were blocked decreased to 1.29%.
The top three regions for this metric remain unchanged: Southeast Asia (6.03%), Africa (4.22%), and East Asia (3.14%). These same regions lead the rankings in terms of malware for AutoCAD.
The figures increased in three regions: East Asia, Australia and New Zealand, and Africa, where it has been growing for four consecutive quarters and reached its highest value since 2022.
Among the selected industries in Africa, the highest percentage of ICS computers on which viruses were blocked was in construction (5.47%).
East Asia ranked third among the regions in terms of viruses, reaching the highest level in the region for the past three years. Among the countries and administrative regions of East Asia, mainland China is the clear leader in terms of viruses (5.07%).
Among the selected industries in East Asia, the highest percentage of ICS computers on which viruses were blocked was in construction (5.93%).
In Australia and New Zealand, the increase in the percentage of ICS computers on which viruses were blocked was primarily due to a 4.3-fold increase in the figure for the electric power industry: from 0.29% to 1.24%. For a region where the percentage of attacked ICS computers for all threats is 0.12%, this is a very high value.
Malware for AutoCAD
In Q2 2026, the percentage of ICS computers on which malware for AutoCAD was blocked increased to 0.31%.
The most notable increase over the quarter was observed in Africa. After more than doubling in the previous quarter, the figure for the region continued to rise (although not so dramatically), reaching 1.02%.
Among the selected industries across all regions, the highest percentage of ICS computers on which malware for AutoCAD was blocked was in construction in East Asia (6.38%) and in Southeast Asia (4.05%).
Main threat sources
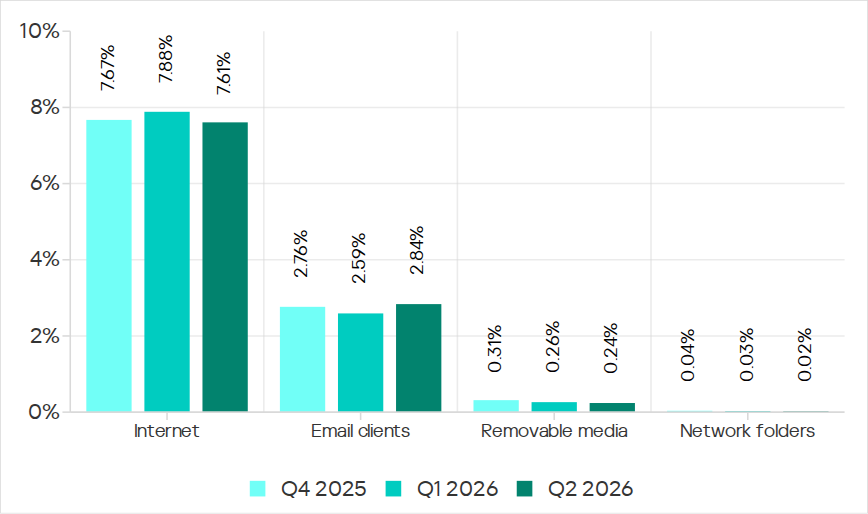
In Q2 2026, of all the threat sources, the percentage increased only for email.
Percentage of ICS computers on which malicious objects from various sources were blocked
Internet
The percentage of ICS computers on which threats from the internet were blocked decreased to 7.61%, reaching its lowest level since 2021.
Over the quarter, the percentage increased in three regions: East Asia by 0.8 pp (to 6.3%), South Asia by 0.3 pp (to 10.4%), and Russia by 0.3 pp (to 6.4%).
Among the selected industries across all regions, the highest percentage of ICS computers on which threats from the internet were blocked was in biometrics (13.03%) and engineering and ICS integration (12.16%) in South Asia.
Email
The percentage of ICS computers on which email threats were blocked increased to 2.84%.
In Q2 2026, the percentage of ICS computers on which email threats were blocked increased in South America by 1.0 pp (to 5.2%) and in Africa by 0.7 pp (to 4.3%).
Among the selected industries across all regions, the highest percentage of ICS computers on which email threats were blocked was in biometrics (19.14%) and building automation (12.49%) in Southern Europe.
Removable media
The percentage of ICS computers on which threats from removable media were blocked continued to decrease, reaching 0.24%, the lowest value for the period under review.
Among the selected industries across all regions, the highest percentage of ICS computers on which threats from removable media were blocked was in the electric power industry in East Asia (1.34%) and biometrics in Africa (1.29%).
Network folders
The percentage of ICS computers on which threats from network folders were blocked continued to decrease. In Q2 2026, it was the lowest for the period under review, at 0.023%.
The only region to see an increase in the percentage of ICS computers on which threats from network folders were blocked during the quarter was Africa. This was mainly due to an increase in the building automation figure to 0.05%.
Among the selected industries across all regions, the highest percentage of ICS computers on which threats from network folders were blocked was in biometrics (0.23%), building automation (0.17%), and engineering and ICS integration (0.13%) in East Asia.
Cybercriminals used to hacking home routers and security cameras have found another Internet-connected device to add to their botnets: your car, according to research published by Kaspersky Lab.
Widespread Infrastructure Breaches and Novel AI Threats Several significant security breaches and new exploitation patterns are highlighted in the Check Point Research threat bulletin, which was released on August 24,...
Huntress will be heading to International Cyber Expo 2026, where visitors can meet the team on Stand K94 and discover how the company is helping organisations tackle increasingly complex cyber threats with fewer resources.
One of the biggest challenges Huntress is seeing is the growing attack surface. Security teams are expected to protect endpoints, identities, cloud environments and other systems, often while dealing with limited time, resources and expertise.
At the same time, attackers are no longer operating in silos. Attacks increasingly move across different parts of an organisation’s environment, leaving security teams managing multiple tools and an overwhelming number of alerts.
At International Cyber Expo, Huntress will showcase its more unified, managed approach to security. The Huntress platform combines greater visibility across the attack surface with AI technologies and human security analysts to help partners and customers detect and respond to threats.
Tackling the rise of AI-powered attacks
AI-powered cybercrime will also be a major focus for Huntress at the show.
Generative AI is making it easier for attackers to create convincing phishing emails, develop malicious code and scale their operations. Tasks that previously required significant cybersecurity expertise can now be carried out with the help of readily available AI tools.
Huntress believes AI will also play an important role in helping defenders respond. Its approach uses AI to help analysts correlate security signals, summarise investigations and work faster, while retaining human judgement and context when making critical security decisions.
Visitors can also speak with Huntress about practical ways to strengthen their security posture. These include implementing multi-factor authentication, improving security awareness training and reducing vulnerabilities across the external network perimeter.
And when preventive controls fail, Huntress stresses the importance of having a mechanism to detect and respond to attacks quickly, including access to a 24/7 SOC that can support containment and remediation.
Listen to Huntress Senior Sales Engineer Alex Hitchen discuss the biggest cybersecurity challenges facing organisations today and what Huntress will be showcasing at International Cyber Expo 2026:
You can still register for FREE to attend International Cyber Expo HERE.
Forescout has launched a new Rapid Insight Assessment designed to help organisations uncover hidden assets, network blind spots, and security exposures as artificial intelligence accelerates vulnerability discovery.
The new assessment combines external analysis with passive network monitoring to give security teams a clearer picture of their attack surface. Forescout says the service can deliver actionable findings within days, helping organisations identify and prioritise risks before attackers exploit them.
The launch comes as security teams face the challenge of managing increasingly complex environments. Unmanaged devices, shadow assets, exposed services, and gaps in network visibility can all create opportunities for attackers.
At the same time, advances in AI are making it possible to discover and exploit vulnerabilities faster.
Finding security exposures before attackers do
The Rapid Insight Assessment uses open-source intelligence to examine an organisation’s external exposure. For internal assessments, Forescout can also deploy its portable Flyaway Kit to passively observe network activity without disrupting operations.
The Flyaway Kit provides visibility across IT, OT, IoT, cyber-physical systems, and unmanaged devices, including assets within remote and air-gapped environments.
The assessment can identify internet-facing remote access services, exposed administrative interfaces, previously unknown network devices, risky communications, and unmanaged OT and IoT assets.
It can also provide more detailed asset intelligence and identify devices associated with Known Exploited Vulnerabilities.
AI is shrinking the window for defenders
Craig Weimer, Vice President and General Manager of Americas at Forescout, said the increasing ability of AI systems to carry out cyber tasks is changing how quickly organisations need to identify security weaknesses.
“When an AI system can discover, connect, and exploit vulnerabilities on its own, the idea of an autonomous attacker is no longer just a future concern,” Weimer said.
He pointed to recent public disclosures from OpenAI, Anthropic, and Meta showing that frontier AI models can perform complex, multi-step cyber tasks against real environments with limited human involvement.
“The message for defenders is clear: the window between exposure and exploitation is getting smaller, and organisations need a complete understanding of their attack surface before adversaries find it first,” he added.
Tackling network blind spots
One of the challenges facing security teams is that they cannot protect assets they do not know exist. This becomes particularly difficult across large or distributed environments where new devices and services can appear without being captured by existing security processes.
Forescout says its Rapid Insight Assessment is intended to provide organisations with a faster way to uncover these gaps without lengthy assessment cycles.
“Organisations can’t afford assessment cycles that take months when hidden exposures, network blind spots, and unknown assets can quickly become opportunities for attackers,” Weimer said.
“The Rapid Insight Assessment gives organisations a fast, efficient way to see their most critical security risks and exposure gaps, delivering clear, actionable findings in days so they can address exposures before they become security incidents.”
As AI gives attackers greater speed and automation, gaining an accurate view of the attack surface could become increasingly important. For defenders, finding hidden exposures before an adversary does may prove critical to reducing the opportunity for an attack in the first place.
The mobile section of the quarterly cyberthreat report includes statistics on malware, adware, and potentially unwanted software for Android, as well as descriptions of the most notable threats for Android and iOS discovered during the reporting period. These statistics are based on detection alerts from Kaspersky products, collected from users who consented to provide statistical data to Kaspersky Security Network.
The quarter in figures
According to Kaspersky Security Network, in Q2 2026:
More than 1.99 million attacks on mobile devices utilizing malware, adware, or unwanted mobile software were blocked.
The Trojan-Banker category was the most prevalent mobile malware threat with a 30.77% share of total detected applications.
More than 304,000 malicious installation packages were discovered, including:
93,574 packages were related to mobile banking Trojans;
570 packages were related to mobile ransomware Trojans.
Quarterly highlights
Attacks on mobile devices involving malware, adware, or unwanted software continued their downward trend, falling to 1,996,823 in Q2 from 2,676,328 the previous quarter.
Attacks on users of Kaspersky mobile solutions, Q4 2024 — Q2 2026 (download)
We noted a downward trend in attacks driven by specific strains of pre-installed Trojans — a shift likely tied to the rollout of patched vendor firmware.
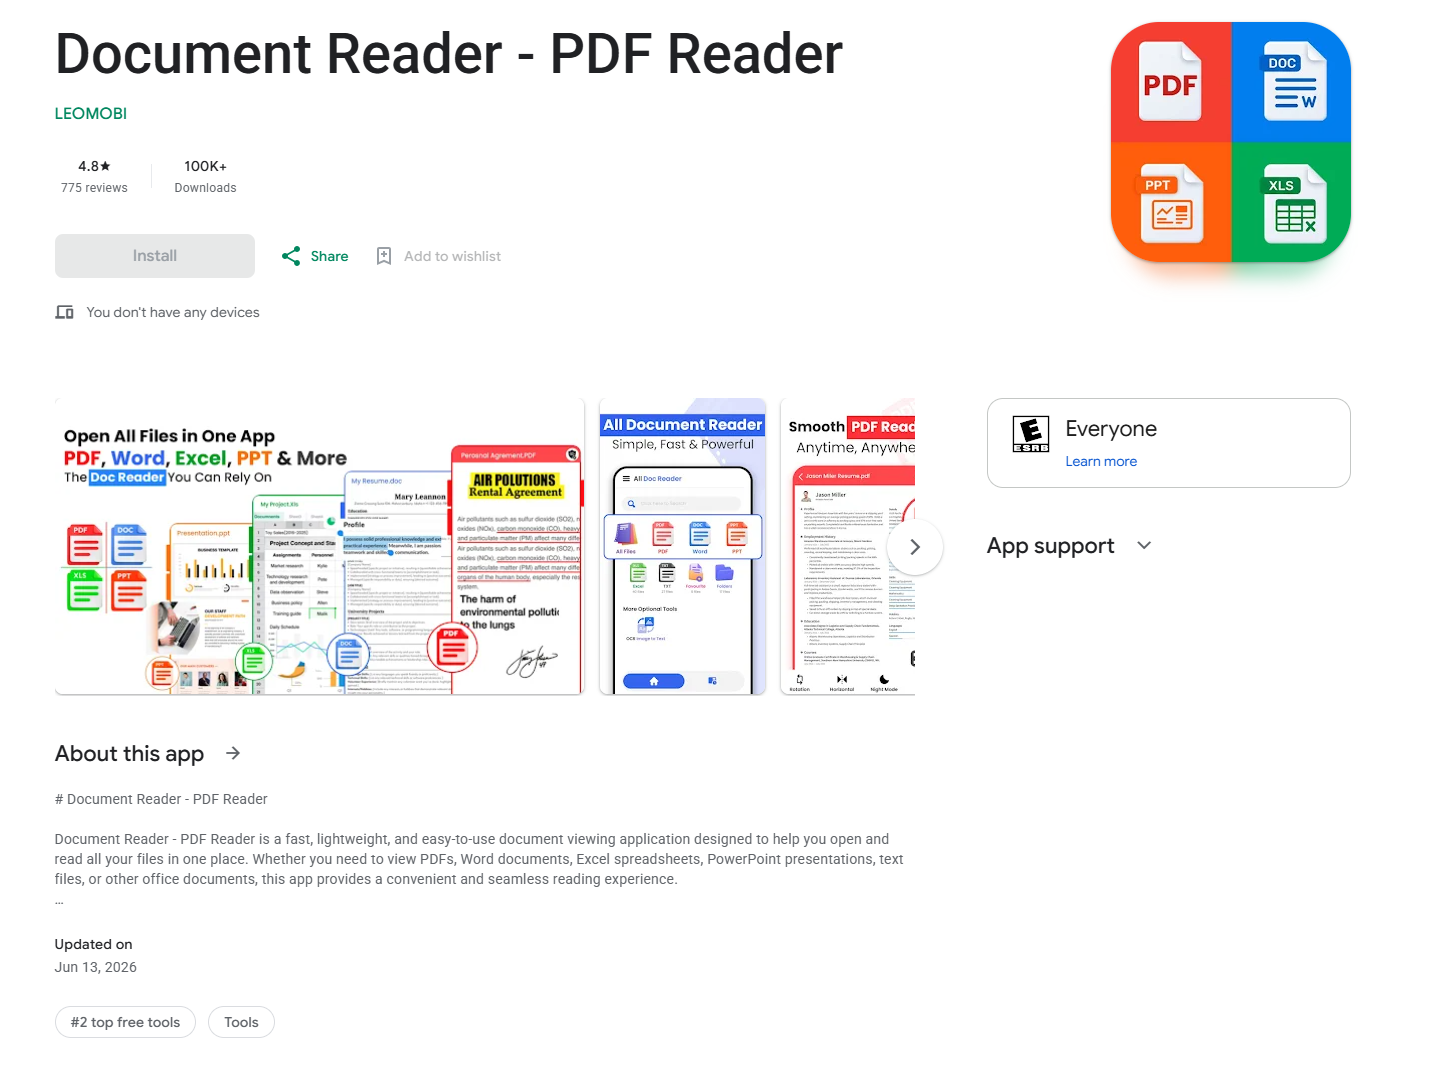
In Q2, our telemetry uncovered multiple malicious loaders hosted directly on Google Play. As highlighted in a prior report (link in Russian), one such instance involved a PDF reader app trojanized to drop the Anatsa banking malware. Upon execution, the app presented users with a fake request to install an update, which served as a front to stage the banking Trojan on the victim’s device.
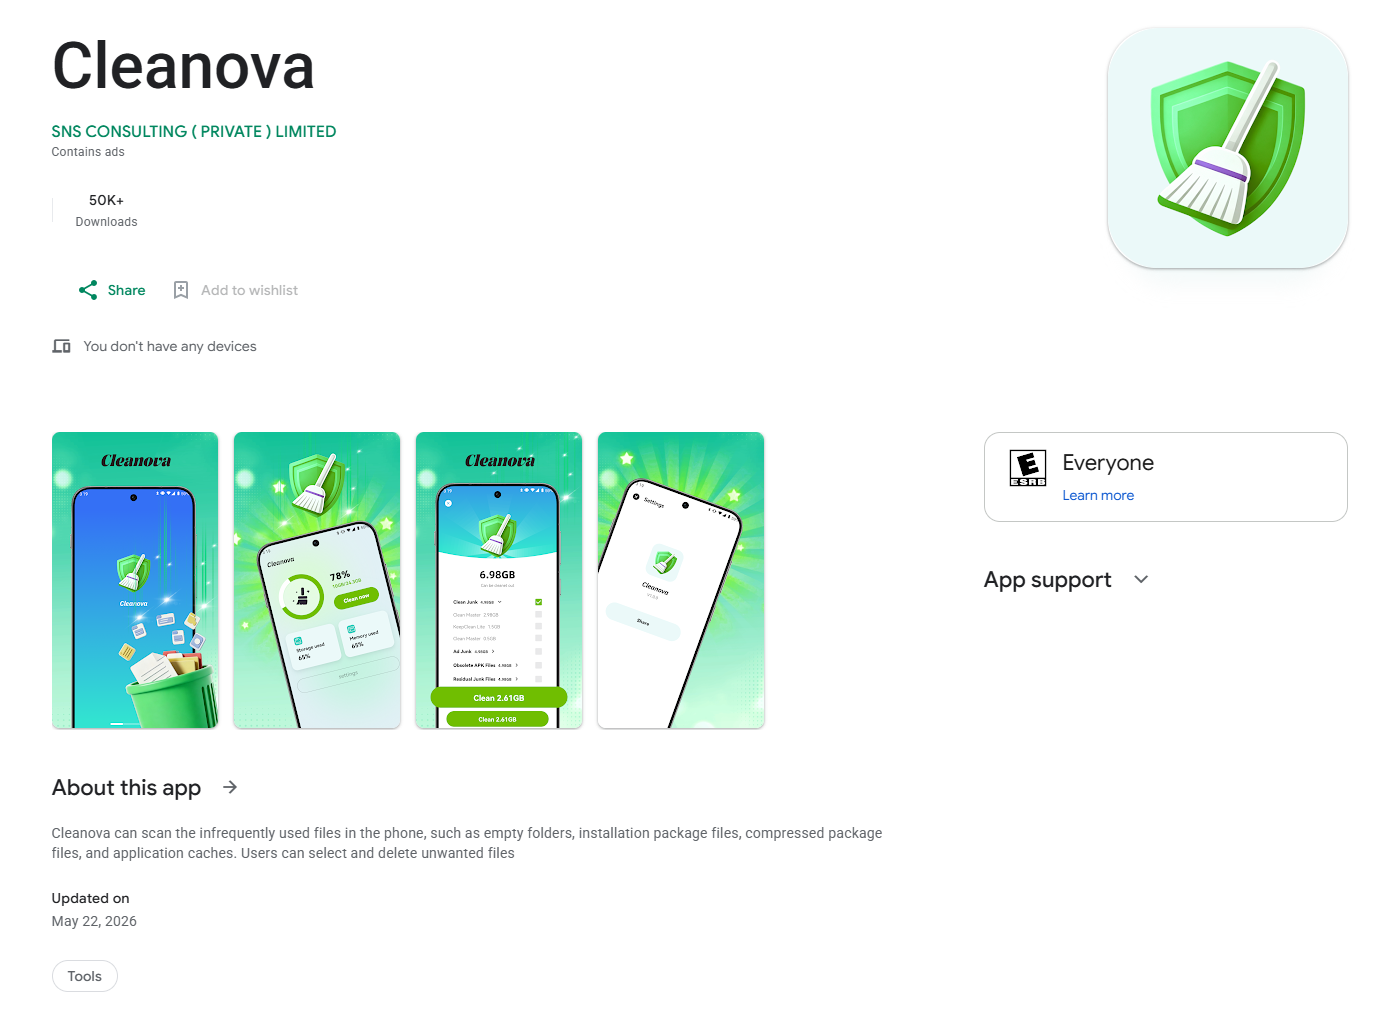
Another notable case involves a loader we detected in the Cleanova app alongside several others. The malware sent requests to a command-and-control server containing telemetry gathered from various SDKs that track the installation source. A malicious payload was returned only for certain sources. This is a fairly interesting method for bypassing app store review processes while ensuring precise victim targeting. If an analytics SDK indicates that an arbitrary installation originated from a source outside the threat actors’ scope, the malicious logic remains dormant. This effectively hides the malware from app store scanners.
Mobile threat statistics
In Q2, the number of Android malware samples totaled 304,128. It remained steady compared to the previous reporting period.
The detected installation packages were distributed by type as follows:
Detected mobile apps by type, Q1 — Q2 2026* (download)
* Data for the previous quarter may differ slightly from previously published data due to certain verdicts being retrospectively revised.
While the number of newly discovered banking Trojan variants fell precipitously, they continued to dominate the threat landscape as they did in Q1. Notably, the share of Creduz malware family among identified banking samples has grown significantly despite low activity in victim telemetry. This discrepancy suggests the threat actors are actively iterating on the malware — likely testing new features or bypasses — by generating a high volume of builds before staging a broader campaign.
Share* of users attacked by the given type of malicious or potentially unwanted apps out of all targeted users of Kaspersky mobile products, Q1 — Q2 2026 (download)
* The total may exceed 100% if the same users experienced multiple attack types.
Within the adware category, the sharpest declines were observed in the HiddenAd and MobiDash families. Meanwhile, the proportion of users targeted by Trojan-Dropper malware increased, primarily driven by surges in banking droppers such as Trojan-Dropper.AndroidOS.Banker and Trojan-Dropper.AndroidOS.Mamont. The corresponding drop in the Trojan-Banker category is partially explained by a shift in tactics: several banking Trojans which are now being packed were subsequently reclassified as droppers.
TOP 20 most frequently detected types of mobile malware
Note that the malware rankings below exclude riskware or potentially unwanted software, such as RiskTool or adware.
Verdict
%* Q1 2026
%* Q2 2026
Difference in p.p.
Change in ranking
Backdoor.AndroidOS.Triada.ag
7.09
9.35
+2.25
0
DangerousObject.Multi.Generic.
5.84
5.65
-0.19
0
DangerousObject.AndroidOS.GenericML.
5.51
5.25
-0.26
0
Trojan.AndroidOS.Boogr.gsh
2.15
3.33
+1.18
+9
Backdoor.AndroidOS.Triada.z
3.08
3.23
+0.15
+3
Trojan-Banker.AndroidOS.Mamont.hl
1.10
2.48
+1.38
+22
Trojan.AndroidOS.Fakemoney.v
3.44
2.31
-1.13
-2
Trojan-Spy.AndroidOS.Btmob.e
0.00
2.27
+2.27
Trojan.AndroidOS.Triada.fe
2.98
2.18
-0.81
0
Trojan-Dropper.AndroidOS.Banker.dd
0.01
2.16
+2.15
Trojan.AndroidOS.Triada.hf
2.23
1.93
-0.29
+1
Backdoor.AndroidOS.Triada.ad
1.40
1.93
+0.53
+8
Backdoor.AndroidOS.Keenadu.a
2.73
1.88
-0.85
-3
Backdoor.AndroidOS.Triada.ab
1.72
1.79
+0.07
+2
Trojan-Banker.AndroidOS.Mamont.iv
1.03
1.63
+0.60
+16
Trojan.AndroidOS.Generic.
1.32
1.47
+0.15
+7
Backdoor.AndroidOS.Triada.ae
1.76
1.44
-0.31
-2
Trojan.AndroidOS.Fakemoney.ej
0.00
1.43
+1.43
Trojan.AndroidOS.Triada.ii
2.07
1.41
-0.66
-5
Trojan-Spy.AndroidOS.Agent.asa
0.02
1.38
+1.36
* Unique users who encountered this malware as a percentage of all attacked users of Kaspersky mobile solutions.
The distribution of top malware families in Q2 largely mirrors the rankings from the previous reporting period. Newer variants of the Mamont banking Trojan climbed the leaderboards, displacing older iterations. This shift points to ongoing, active development of new variants by the threat actors behind the malware.
Mobile banking Trojans
In Q2, the total volume of Trojan-Banker applications dropped sharply compared to the previous quarter, totaling 93,574 installation packages.
Number of installation packages for mobile banking Trojans detected by Kaspersky, Q2 2025 — Q2 2026 (download)
Against the backdrop of this trend, the distribution shifted heavily toward Creduz Trojans. However, as noted earlier, this shift was not reflected in real-world attack metrics: virtually the entire leaderboard by proportion of targeted users continues to be dominated by diverse Mamont variants.
TOP 10 mobile bankers
Verdict
%* Q1 2026
%* Q2 2026
Difference in p.p.
Change in ranking
Trojan-Banker.AndroidOS.Mamont.hl
3.27
11.13
+7.86
+6
Trojan-Banker.AndroidOS.Mamont.iv
3.08
7.33
+4.25
+6
Trojan-Banker.AndroidOS.Mamont.mv
0.00
5.12
+5.12
Trojan-Banker.AndroidOS.Agent.ws
3.78
4.99
+1.22
+2
Trojan-Banker.AndroidOS.Mamont.mg
0.35
4.71
+4.36
+62
Trojan-Banker.AndroidOS.Faketoken.pac
2.56
4.10
+1.54
+6
Trojan-Banker.AndroidOS.Mamont.jo
15.75
3.73
-12.02
-6
Trojan-Banker.AndroidOS.Mamont.mc
0.83
3.51
+2.67
+26
Trojan-Banker.AndroidOS.Mamont.lf
0.00
2.79
+2.79
Trojan-Banker.AndroidOS.Agent.eq
0.89
2.58
+1.69
+23
* Unique users who encountered this malware as a percentage of all users of Kaspersky mobile security solutions who encountered banking threats.

 Login
Login