Reading view

There are new articles available, click to refresh the page.

NASA Rocket Takes First Multi-Point Look Inside Radio-Disrupting Clouds

High above Earth, thin veils of metallic haze drift through the edge of space. Known as sporadic E layers, these high-altitude “clouds” form from the vaporized dust of burnt-up meteors, earning their name from the unpredictable way they emerge and then dissipate. Now, new results from a NASA sounding rocket — a suborbital research rocket — that flew five detectors through one of these layers simultaneously reveal unexpected complexity in the layer for the first time.

Though invisible to the eye, sporadic E layers make their presence known to the radio signals we rely on for long-distance communication. When present, sporadic E can send those signals ping-ponging off in unexpected directions, rendering the technology temporarily unreliable.

Scientists have long sought a fuller understanding of these radio-disrupting clouds, but until recently, they had only sampled them one narrow slice at a time. The rocket, called the sporadic E Electrodynamics Demonstration, or SpEED Demon for short, launched from NASA’s Wallops Flight Facility in Virginia on Aug. 24, 2022, and demonstrated the first concurrent, multi-point view inside sporadic E.  Its results, from a team led by Embry-Riddle Aeronautical University, are described in a new study in the Journal of Geophysical Research: Space Physics.

Sporadic E layers form in the ionosphere, a region of the upper atmosphere beginning around 40 miles (60 kilometers) up where the neutral gases begin to transform into plasma, or ionized gas. Some of the particles there come from meteors, which burn up and leave behind traces of iron, magnesium, and other metals. These metals occasionally clump into dense, cloud-like sheets — the sporadic E layers — that reflect radio waves.
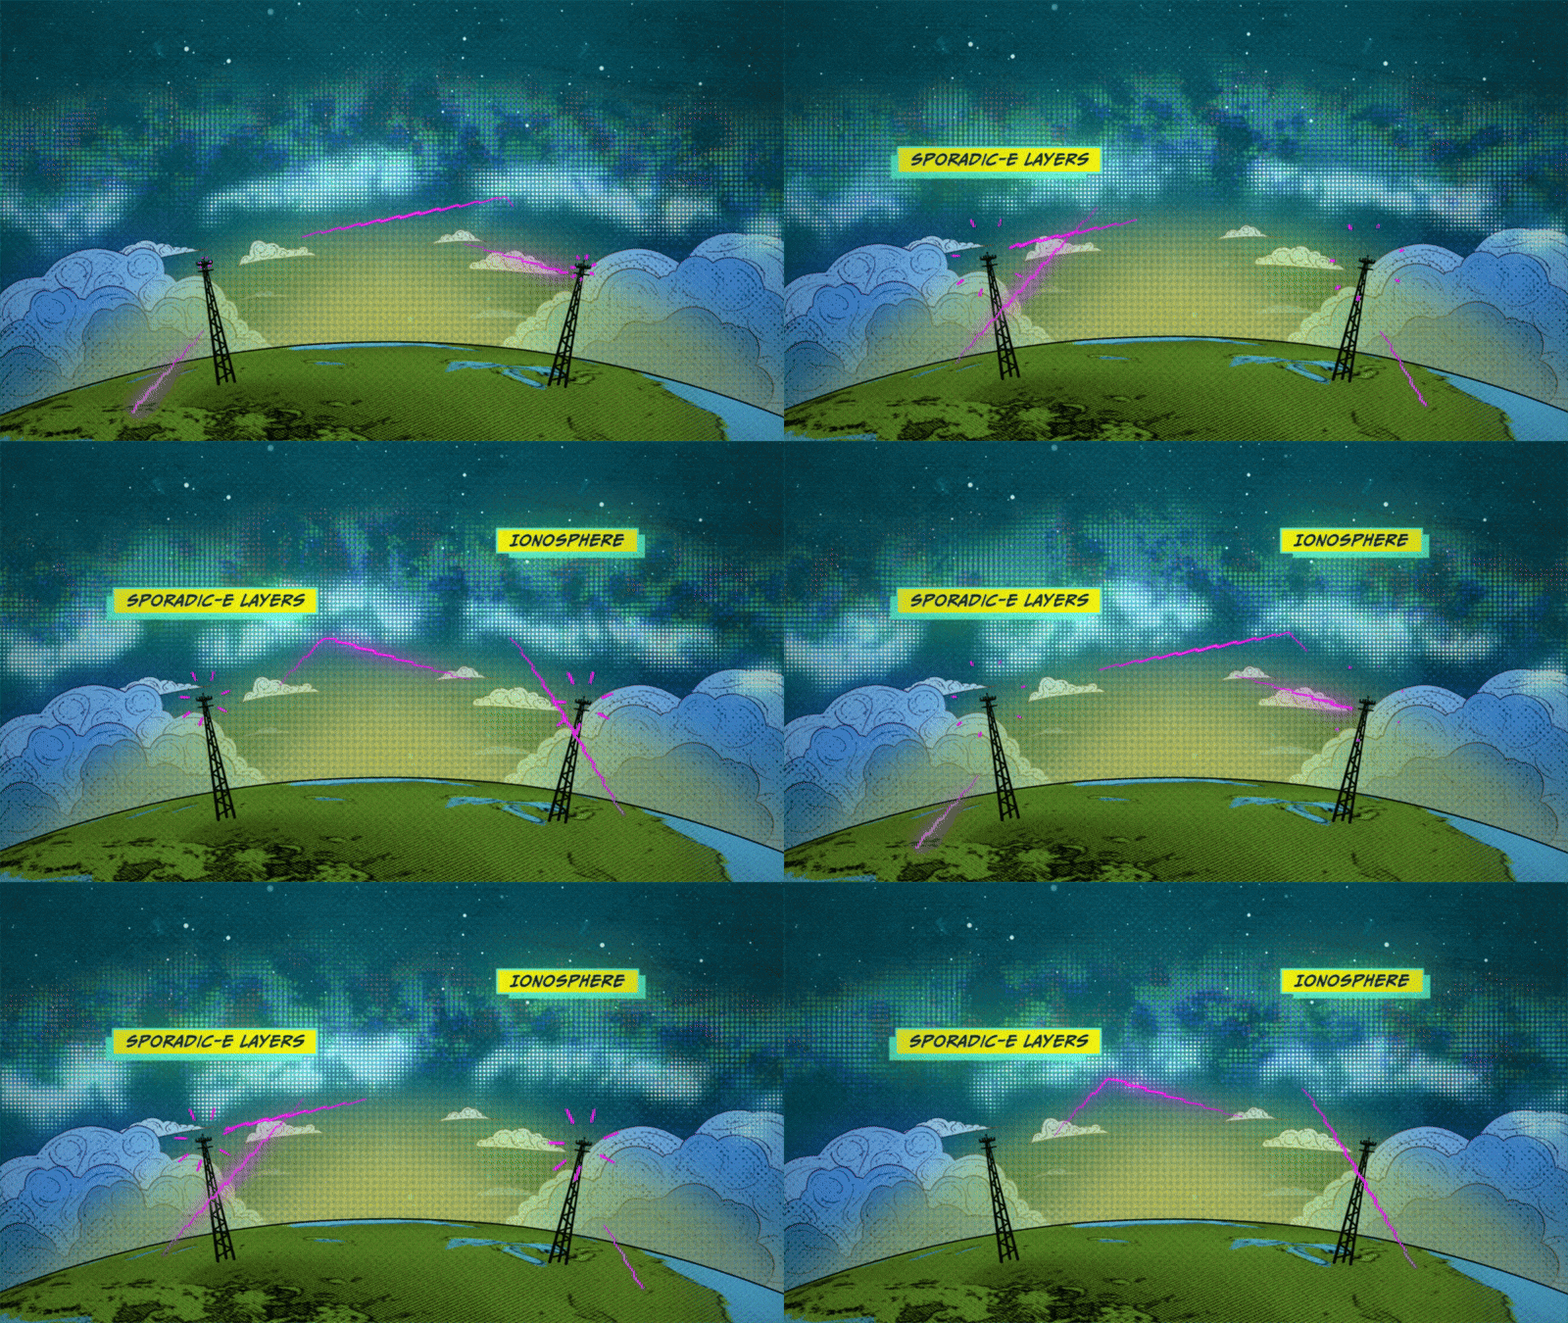
Digital illustration of a curved Earth with green land and blue clouds representing sporadic E layers. Two communication towers stand on the surface, sending and receiving zig-zagging magenta beams of radio signals against a starry, glowing dark blue nebula sky. Two labels appear, sporadic e layers (on the clouds) and ionosphere, above the clouds, representing the intended target of the radio beams.
An animated illustration depicts Sporadic-E layers forming in the lower portions of the ionosphere, causing radio signals to reflect back to Earth before reaching higher layers of the ionosphere.
NASA’s Goddard Space Flight Center/Conceptual Image Lab

“Sporadic E layers are, in one sense, giant mirrors of radio frequency waves in the sky,” said Aroh Barjatya, the mission’s principal investigator and a professor of engineering physics at Embry-Riddle in Daytona Beach, Florida.

When a sporadic E layer forms, signals meant to travel out to space can ricochet back toward the ground. Air traffic controllers and marine radio users may pick up distant transmissions as though they were nearby, and radars scanning beyond the horizon can register so-called “ghosts,” or false targets. The effects reach everyday technology, too.

“The biggest source of error in the GPS in your phone, for example, is from the plasma in the ionosphere, and sporadic E layers can contribute to this uncertainty,” said Henry Valentine, the study’s lead author, who conducted the work at Embry-Riddle and is now a researcher at the U.S. Naval Research Laboratory.

Because sporadic E layers hover around 60 miles (100 kilometers) up—too high for weather balloons, too low for satellites — and form and dissipate unpredictably, they have long been the province of sounding rockets, which can be launched on short notice to catch one in the act. But a single rocket flies a single path, taking measurements only along a line. Barjatya likens the situation to viewing a scene through a crack in a wall. One can only observe what is happening along that narrow slit, missing out on the crucial context of whatever is occurring to the left or right of one’s view.

The SpEED Demon mission changed that. The mission was the first to deploy ejectable probes, called dropsondes, inside a sporadic E layer. Once inside, the rocket released four dropsondes that flew away from the main payload and from one another, each measuring the plasma along its own track and beaming its measurements back to ground stations. Together with the main payload, the probes sampled the layer in a total of five places at the same moment.
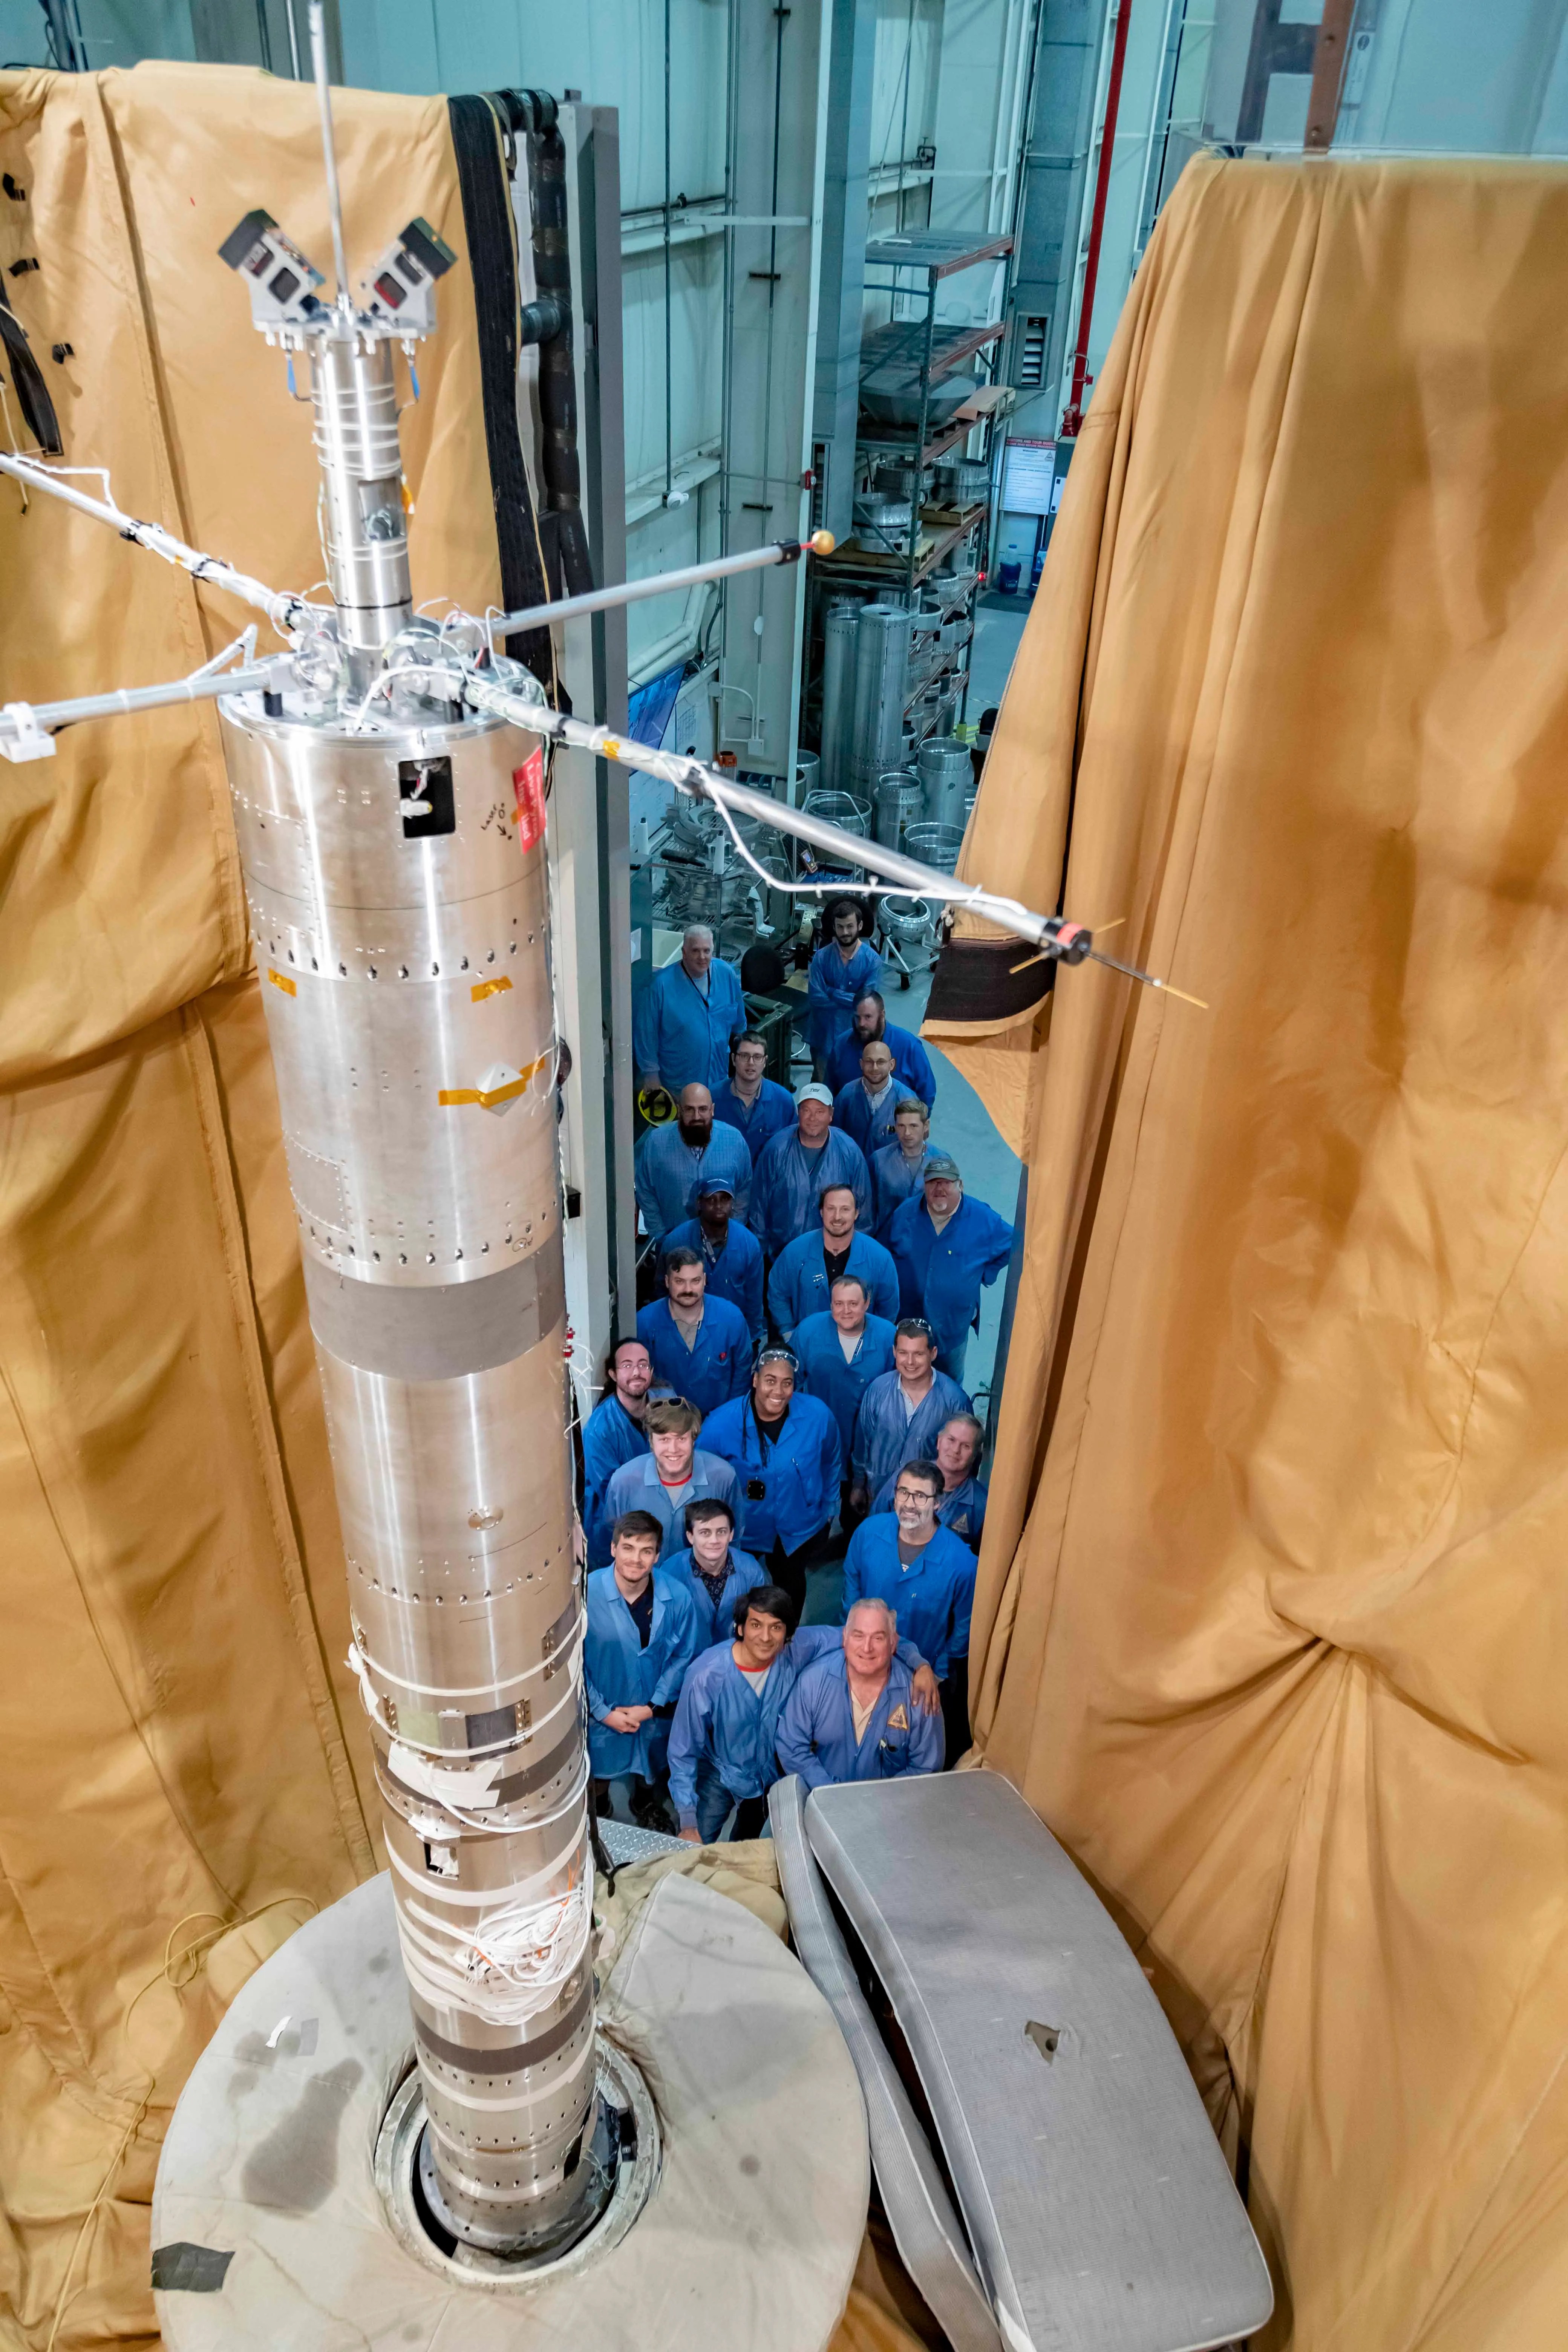
A group of people in blue lab coats stands around a tall, metallic rocket component inside an industrial facility with beige protective curtains.
The SpEED Demon team poses with payload section during testing at NASA’s Wallops Flight Facility.
NASA Wallops/Berit Bland

“Now with multiple sensors, we’ve turned that crack into a picket fence,” Barjatya said.

The data revealed surprising complexity inside the sporadic E layer. Rather than a smooth, dense pancake of metallic particles, the layer that SpEED Demon flew through appeared uneven and structured, shaped by turbulent winds moving through the neutral air around it.

“A lot of times you think of sporadic E as this single sharp density layer, but what we saw in ours is it’s interacting with neutral wind and these swirling atmospheric turbulences,” Valentine said. “Rather than a flat pancake, it’s closer to a cinnamon roll.”

On the way down, the layer even split into two distinct peaks. The team found that shape was consistent with modulation by Kelvin-Helmholtz billows, the curling, wave-like instability that produces breaking-wave patterns in ordinary clouds. Because the flight was unable to measure the local winds and electric fields directly, the researchers are careful to call the billow explanation plausible rather than confirmed.

The SpEED Demon mission was designed as a technology demonstration — a test of whether the dropsonde technique would work at all. It did, and the team was quick to apply it again. Barjatya’s team used a similar multi-probe strategy to launch rockets into the paths of the October 2023 annular eclipse and April 2024 total solar eclipse, studying how the sudden darkness disturbed the upper atmosphere. In June 2025, they flew SpEED Demon’s most direct descendant, Sporadic-E ElectroDynamics, or SEED, into sporadic E layers from Kwajalein Atoll in the Marshall Islands, studying them at lower latitudes. Papers from those missions are in preparation.
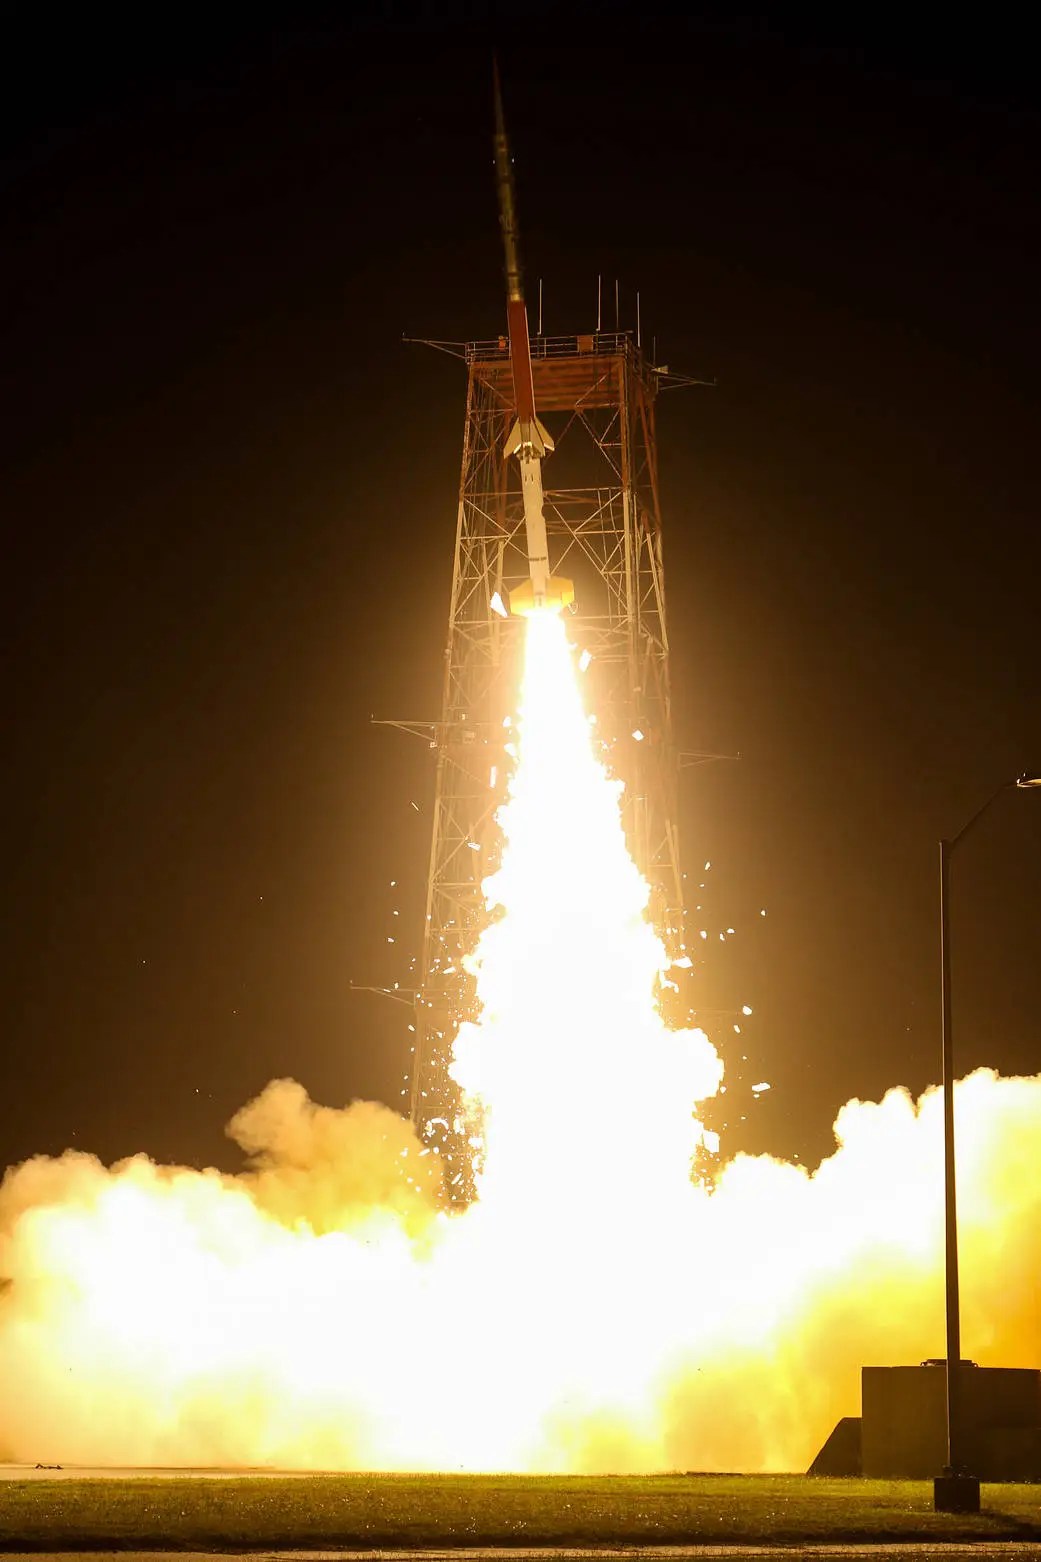
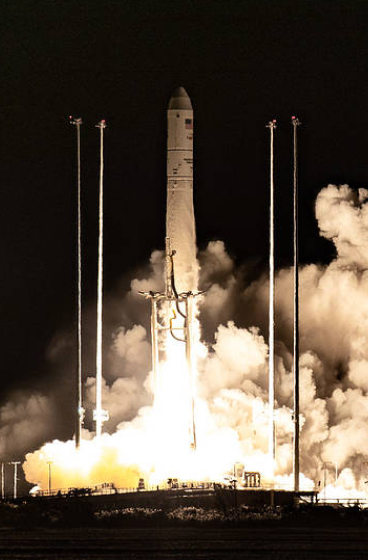
A rocket launches at night, surrounded by bright flames and smoke, with a tall supporting structure visible and the dark sky in the background.
A sounding rocket launch testing science instruments for future missions was successfully conducted at 9:16 p.m. EDT, Aug. 23, 2022, from NASA Wallops Flight Facility in Virginia.
NASA

After years of study, sporadic E layers are no longer as unpredictable as they once were. “They have a seasonality to them, with peak occurrence happening in the local summer,” Barjatya said.

Questions about how and when they form are increasingly fine-grained. The new deployable multi-point rocket sensor methodology, along with ground-based measurements, is likely to bring the picture even closer to completion. “The science community as a whole is now in its final stretches of fully understanding these giant radio frequency mirrors in the sky,” Barjatya said.

By Miles Hatfield 
NASA’s Goddard Space Flight Center, Greenbelt, Md. 

About the Author

Miles Hatfield
Miles Hatfield

Keep Exploring

Discover More Topics From NASA

Starstruck: NASA Research Shows How Sun’s Ancient History Shaped Earth

6 Min Read

Starstruck: NASA Research Shows How Sun’s Ancient History Shaped Earth

At the center of our solar system, the Sun influences every planet that orbits it. In two recent NASA-funded studies, scientists uncovered how ancient events in the Sun’s history may have helped create Earth’s unique climate and driven previously unexplained climatic shifts.  

In new research, scientists at NASA’s SHIELD (Solar Wind with Hydrogen Ion charge Exchange and Large-Scale Dynamics) center — one of NASA’s DRIVE (Diversify, Realize, Integrate, Venture, Educate) Science Centers — trace the trajectory of the heliosphere, the massive bubble created by our Sun that envelops our solar system, as it moved through our galaxy and influenced Earth’s climate along the way. In another paper, a NASA scientist and coauthors investigate how the younger, dimmer Sun managed to heat Earth by seeding the production of potent greenhouse gases.

A Sun on the move 

Over the last tens of millions of years, Earth’s climate has undergone significant shifts, including notable ice ages in which the global average temperature temporarily dropped by several degrees. During these periods, more frequent climate swings led Earth to warm and cool. To explain these periods of warming and cooling, scientists looked to factors internal to Earth, including orbital changes, greenhouse gases, and ice. But new research suggests changes to the Sun’s environment may be key to understanding Earth’s temperature swings. 

Just as our planet is encased by an atmosphere, so our entire solar system is encased inside a kind of “atmosphere” created by the Sun. This protective bubble, known as the heliosphere, is formed by a continuous solar wind of charged particles streaming out from the Sun in all directions. 

This conceptual animation begins with a view of the Milky Way Galaxy. As we zoom in, we travel to the Local Interstellar Cloud, and then to the heliosphere, the protective bubble that surrounds our solar system. The heliosphere is formed by a continuous stream of charged particles from the Sun, called the solar wind.
NASA’s Goddard Space Flight Center Conceptual Image Lab

Our heliosphere orbits around the center of our galaxy, the Milky Way. Throughout the Sun’s 4.6-billion-year existence, our heliosphere has traversed various regions within our galaxy. In a paper published on Aug. 21 in Annual Review of Astronomy and Astrophysics, researchers at NASA’s SHIELD used computer modeling to reverse-engineer the path of the heliosphere through our galaxy, revealing that the environments it passed through may have triggered changes on Earth.   

Merav Opher, SHIELD’s principal investigator at Boston University, and her team ran simulations that showed the Sun has encountered frigid expanses of gas and dust at least three different times in the past few million years. In these instances, massive interstellar “cold clouds” pushed against the heliosphere to such an extent that it shrank to smaller than Earth’s orbit, stranding our planet outside the Sun’s protective shield. 

These exposures — approximately 2 to 3 million years, 6 to 7 million years, and 13 to 14 million years ago — would have exposed Earth’s atmosphere to totally different surroundings. The simulation results match geologic evidence: Elements prevalent in interstellar dust appear in deep-sea sediment core samples, Antarctic snow, and lunar samples during these timelines. 

This animated illustration shows Earth and the Sun protected by the heliosphere, the massive bubble created by our Sun. As our solar system traverses through the galaxy, encounters with massive interstellar “cold clouds” pushed against the heliosphere and caused the heliosphere to shrink past Earth, exposing the planet to cosmic radiation and elements from interstellar space.
NASA’s SHIELD DRIVE Science Center/Merav Opher/Harvard Radcliffe Institute

These heliosphere collapse events may also explain ancient climatic patterns on Earth. In the simulations, when Earth’s atmosphere was exposed to a cold, dense galactic hydrogen cloud, it increased water vapor content and shifted upper-atmospheric dynamics, ultimately altering the conditions at the surface. In summary, our heliosphere’s trips through colder regions in our galaxy may be a key factor in driving some of Earth’s ancient changes in climate, including possible ice ages.  

Next frontier in studying heliophysics 

The SHIELD center is one of several that NASA funds to unlock the next generation of heliospheric research. As a DRIVE Science Center, SHIELD builds a team of researchers with differing expertise, approaches, and opinions to develop a model, or “digital twin,” of the heliosphere that helps reveal how the heliosphere interacts with its surroundings, including dense interstellar clouds. Understanding our unique, habitable solar system will help unravel the mysteries of life’s evolution on Earth and potentially uncover other habitable star systems. 

Young Sun 

In another paper, Vladimir Airapetian, a scientist at NASA’s Goddard Space Flight Center in Greenbelt, Maryland, focuses on a long-standing mystery of how the ancient Sun warmed early Earth enough to sustain life. Three billion years ago, the young Sun was 70% as bright as it is today. Under these dimmer conditions, Earth should have been frozen solid. Yet geological evidence shows stable liquid water already existed long before that. This puzzle — a balmy Earth under a cooler, dimmer Sun — is known as the Faint Young Sun paradox.  

One clue to resolving the paradox comes from young Sun-like stars elsewhere in the galaxy. These “toddler” stars are prone to throwing fits. Specifically, data from NASA’s retired Kepler space telescope shows that young Sun-like stars regularly erupt with massive superflares, flinging high-energy particles in all directions on a daily basis. If our young Sun was like these other stars, Airapetian proposes, the barrage of high-energy solar particles could have triggered chemical reactions that were key to warming early Earth. 

Airapetian’s team simulated early Earth’s atmosphere in a sealed chamber, mixing molecular nitrogen, ammonia, carbon dioxide, and carbon monoxide. They then fired protons into the mixture, simulating the onslaught of particles from superflares. This proton bombardment triggered several changes including the production of nitrous oxide, a greenhouse gas 300 times more potent than carbon dioxide. The research was published in Astrophysical Journal Letters.

This nitrous oxide could help Earth hold onto heat. But not all the nitrous oxide would last. The young Sun’s intense ultraviolet radiation would break some of it down, splitting the molecule back into nitrogen and oxygen. But even if only 10% of the nitrous observed in the experiment survived, Airapetian’s team’s computer simulations confirmed, it would still warm Earth’s equatorial regions to about 41 degrees Fahrenheit (5 degrees Celsius), above water’s freezing point. This smaller amount of nitrous could even accelerate prebiotic synthesis: just-above-freezing temperatures have been found to be more efficient for building complex chains of amino acids than warmer temperatures. 

Unearthing secrets of our star-planet system 

Together, these two studies show that the Sun can lead to surprising implications for Earth. While our planet stands alone in many ways, it was formed and has always existed as part of a star-planet system. Understanding that unique relationship promises new insights about both Earth and the star that sustains it.  

By Desiree Apodaca and Miles Hatfield 
NASA’s Goddard Space Flight Center, Greenbelt, Md. 

Keep Exploring

Discover More Topics From NASA

NASA Shares Views of August Solar Eclipse from Ground, Air, Space

3 Min Read

NASA Shares Views of August Solar Eclipse from Ground, Air, Space

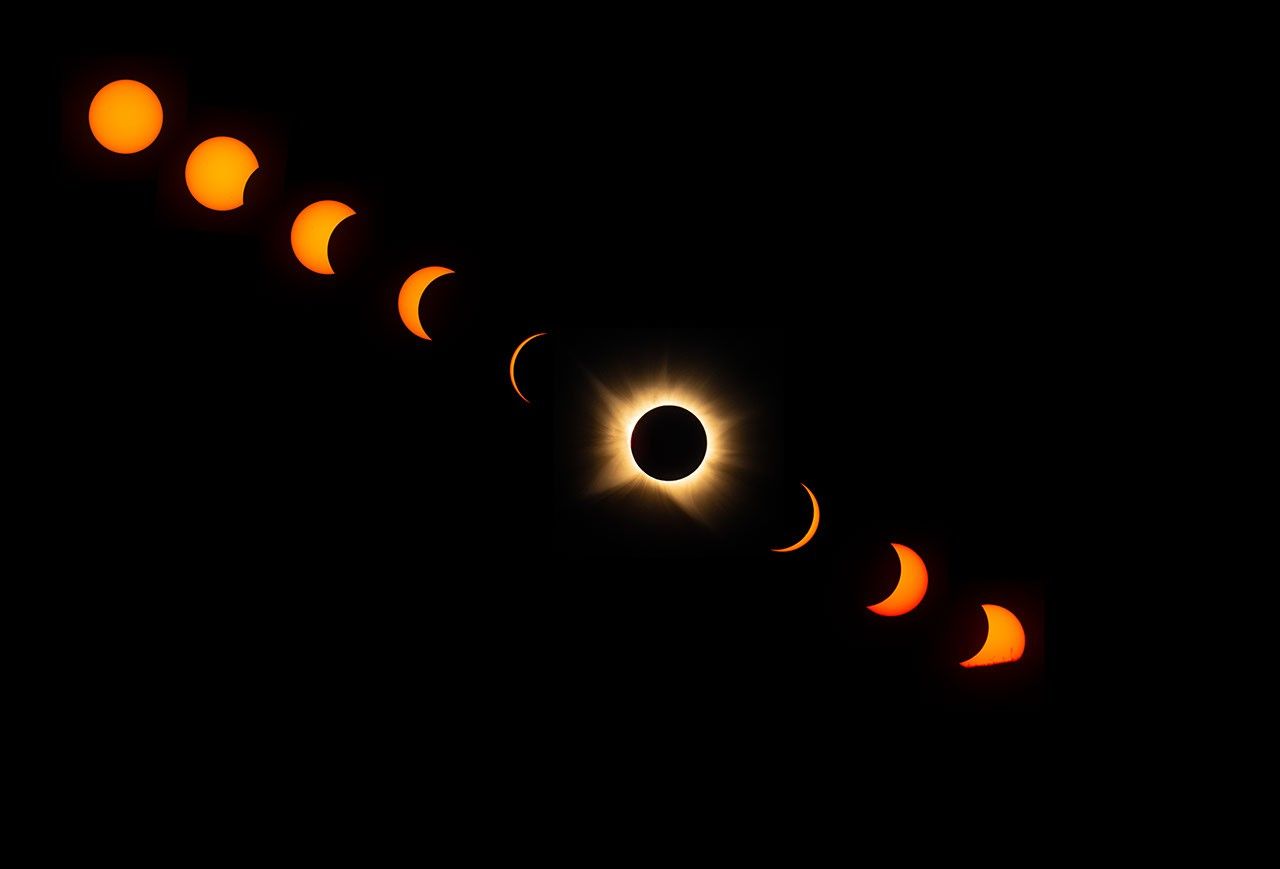
A sequence of images in a diagonal line from upper left to lower right shows the progression of a total solar eclipse, with an uneclipsed Sun in the upper left and other images showing the Sun becoming more and more eclipsed toward the lower right. A total eclipse, with the white corona around the dark disk of the Moon, appears in the line of eclipse images, near the center. Three more images to the lower right of the total eclipse show a crescent Sun becoming less eclipsed. The final image in the lower right shows the Sun starting to dip below the horizon, with its lower portions covered by the foreground.
This composite image shows the progression of a total solar eclipse as the Sun sets over San Millán de los Caballeros, Spain, on Wednesday, Aug. 12, 2026.
Credits:
NASA/Bill Ingalls

On Aug. 12, a total solar eclipse darkened skies over Greenland, Iceland, and Spain. As the Moon covered the Sun, it briefly revealed the Sun’s wispy outer atmosphere — the corona — to those in the path of totality who were lucky enough to have clear skies. NASA researchers and photographers were along the eclipse path to study the corona, capture the phenomenon, and observe how the eclipse affected our planet.

One NASA photographer in Spain captured the total solar eclipse as well as the partial phases before and after, until the Sun set below the horizon.

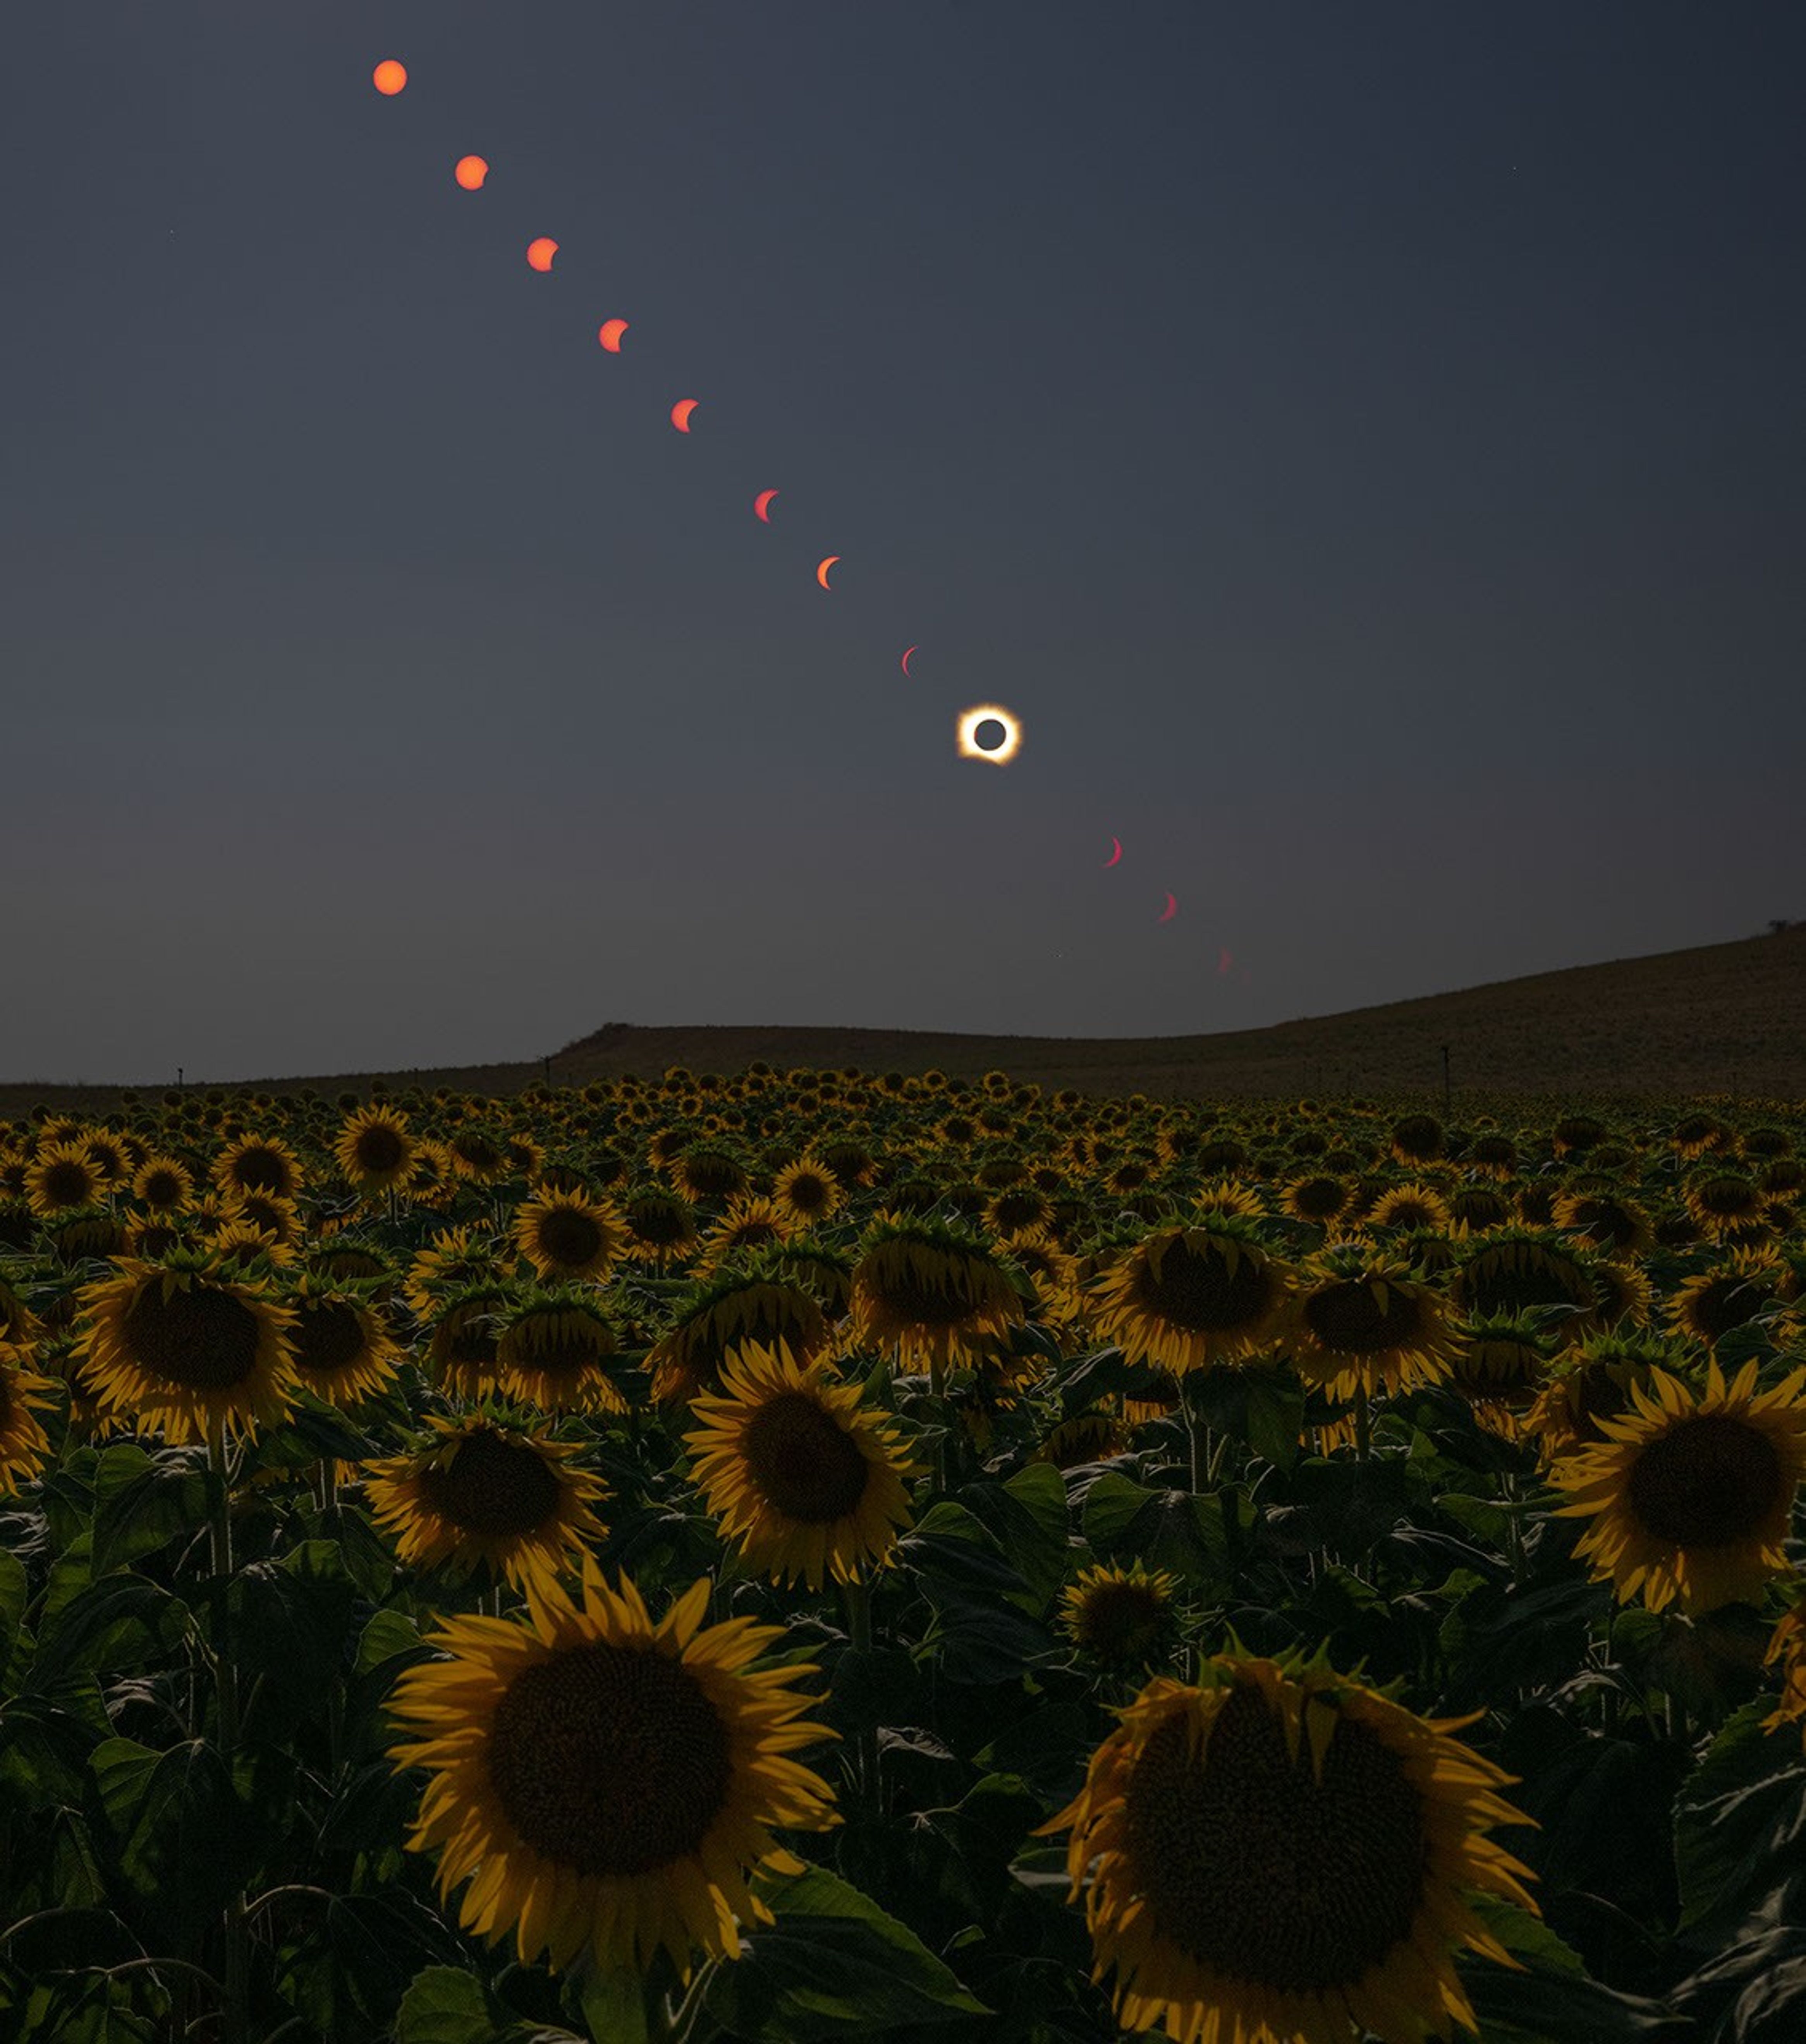
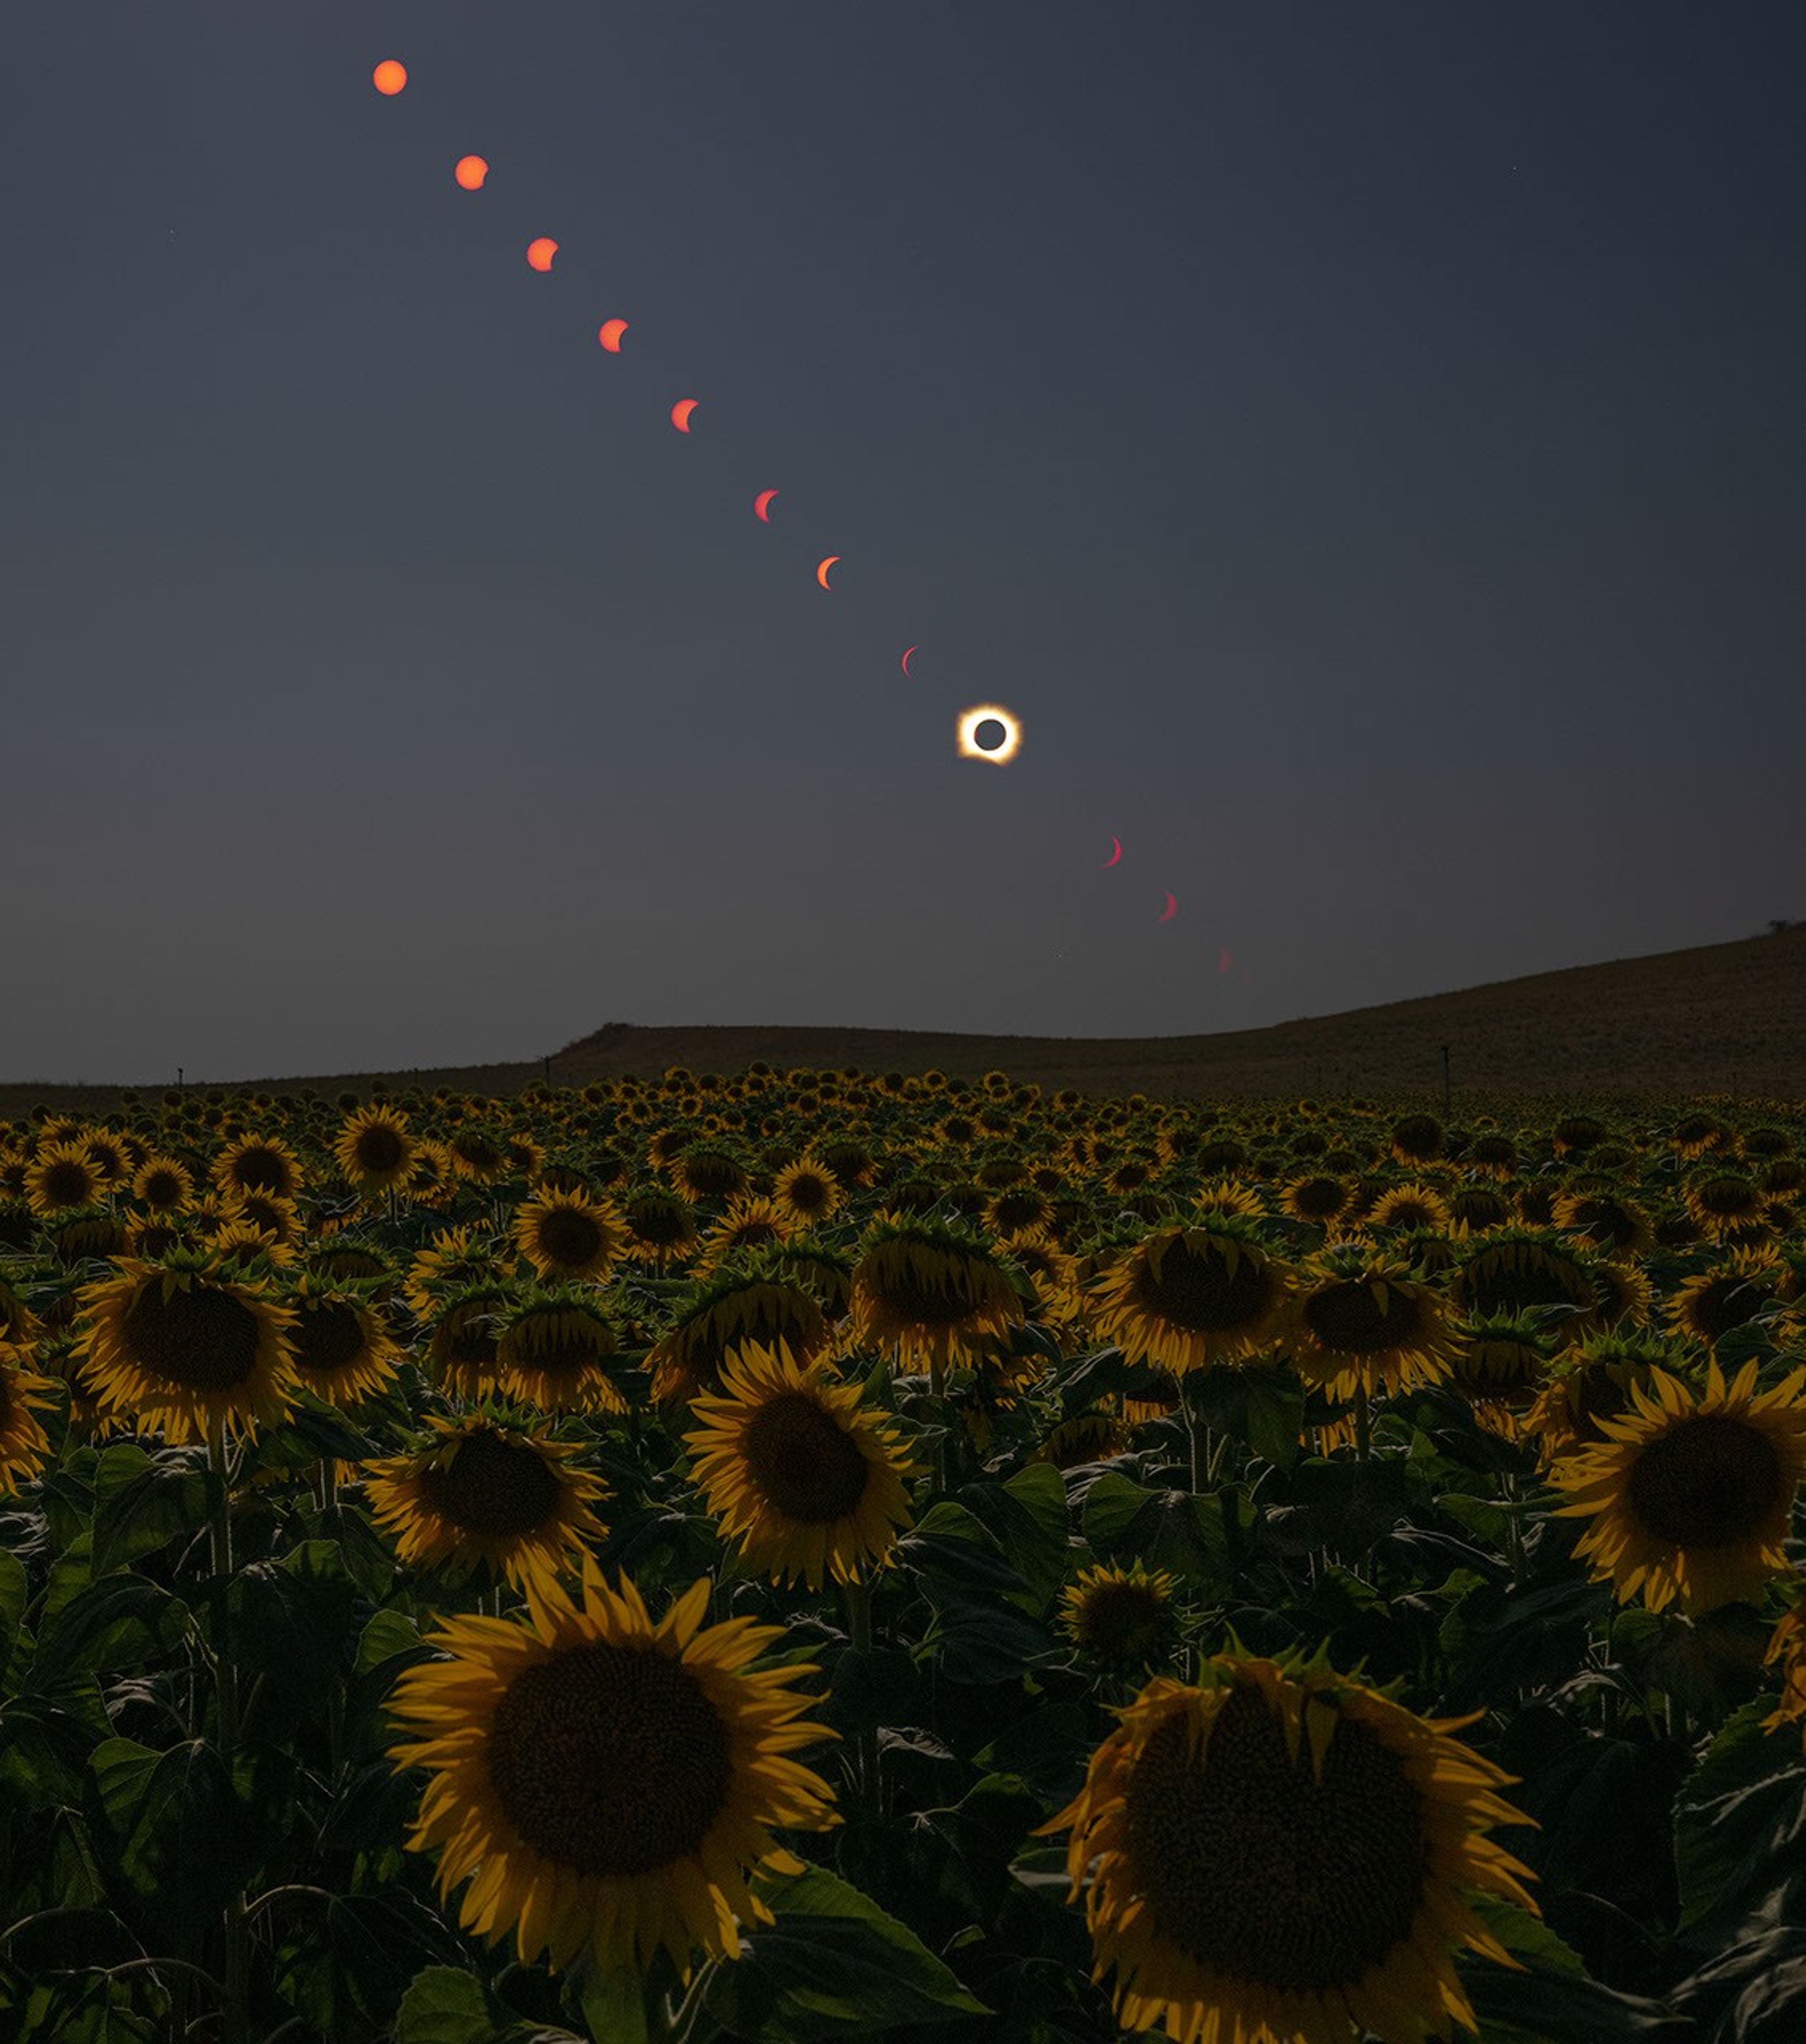
In a dusky sky above a field of sunflowers, a sequence of images shows the progression of a total solar eclipse, from an uneclipsed Sun in the upper left followed by a line of other images showing the Sun becoming more and more eclipsed toward the lower right. A total eclipse, with the white corona around the dark disk of the Moon, appears  in the line of eclipse images, near the horizon. A couple more images show a red crescent Sun to the lower right of the total eclipse image.
This composite image shows the progression of a total solar eclipse over a field of sunflowers in San Millán de los Caballeros, Spain, on Aug. 12, 2026. Credit: NASA/Bill Ingalls
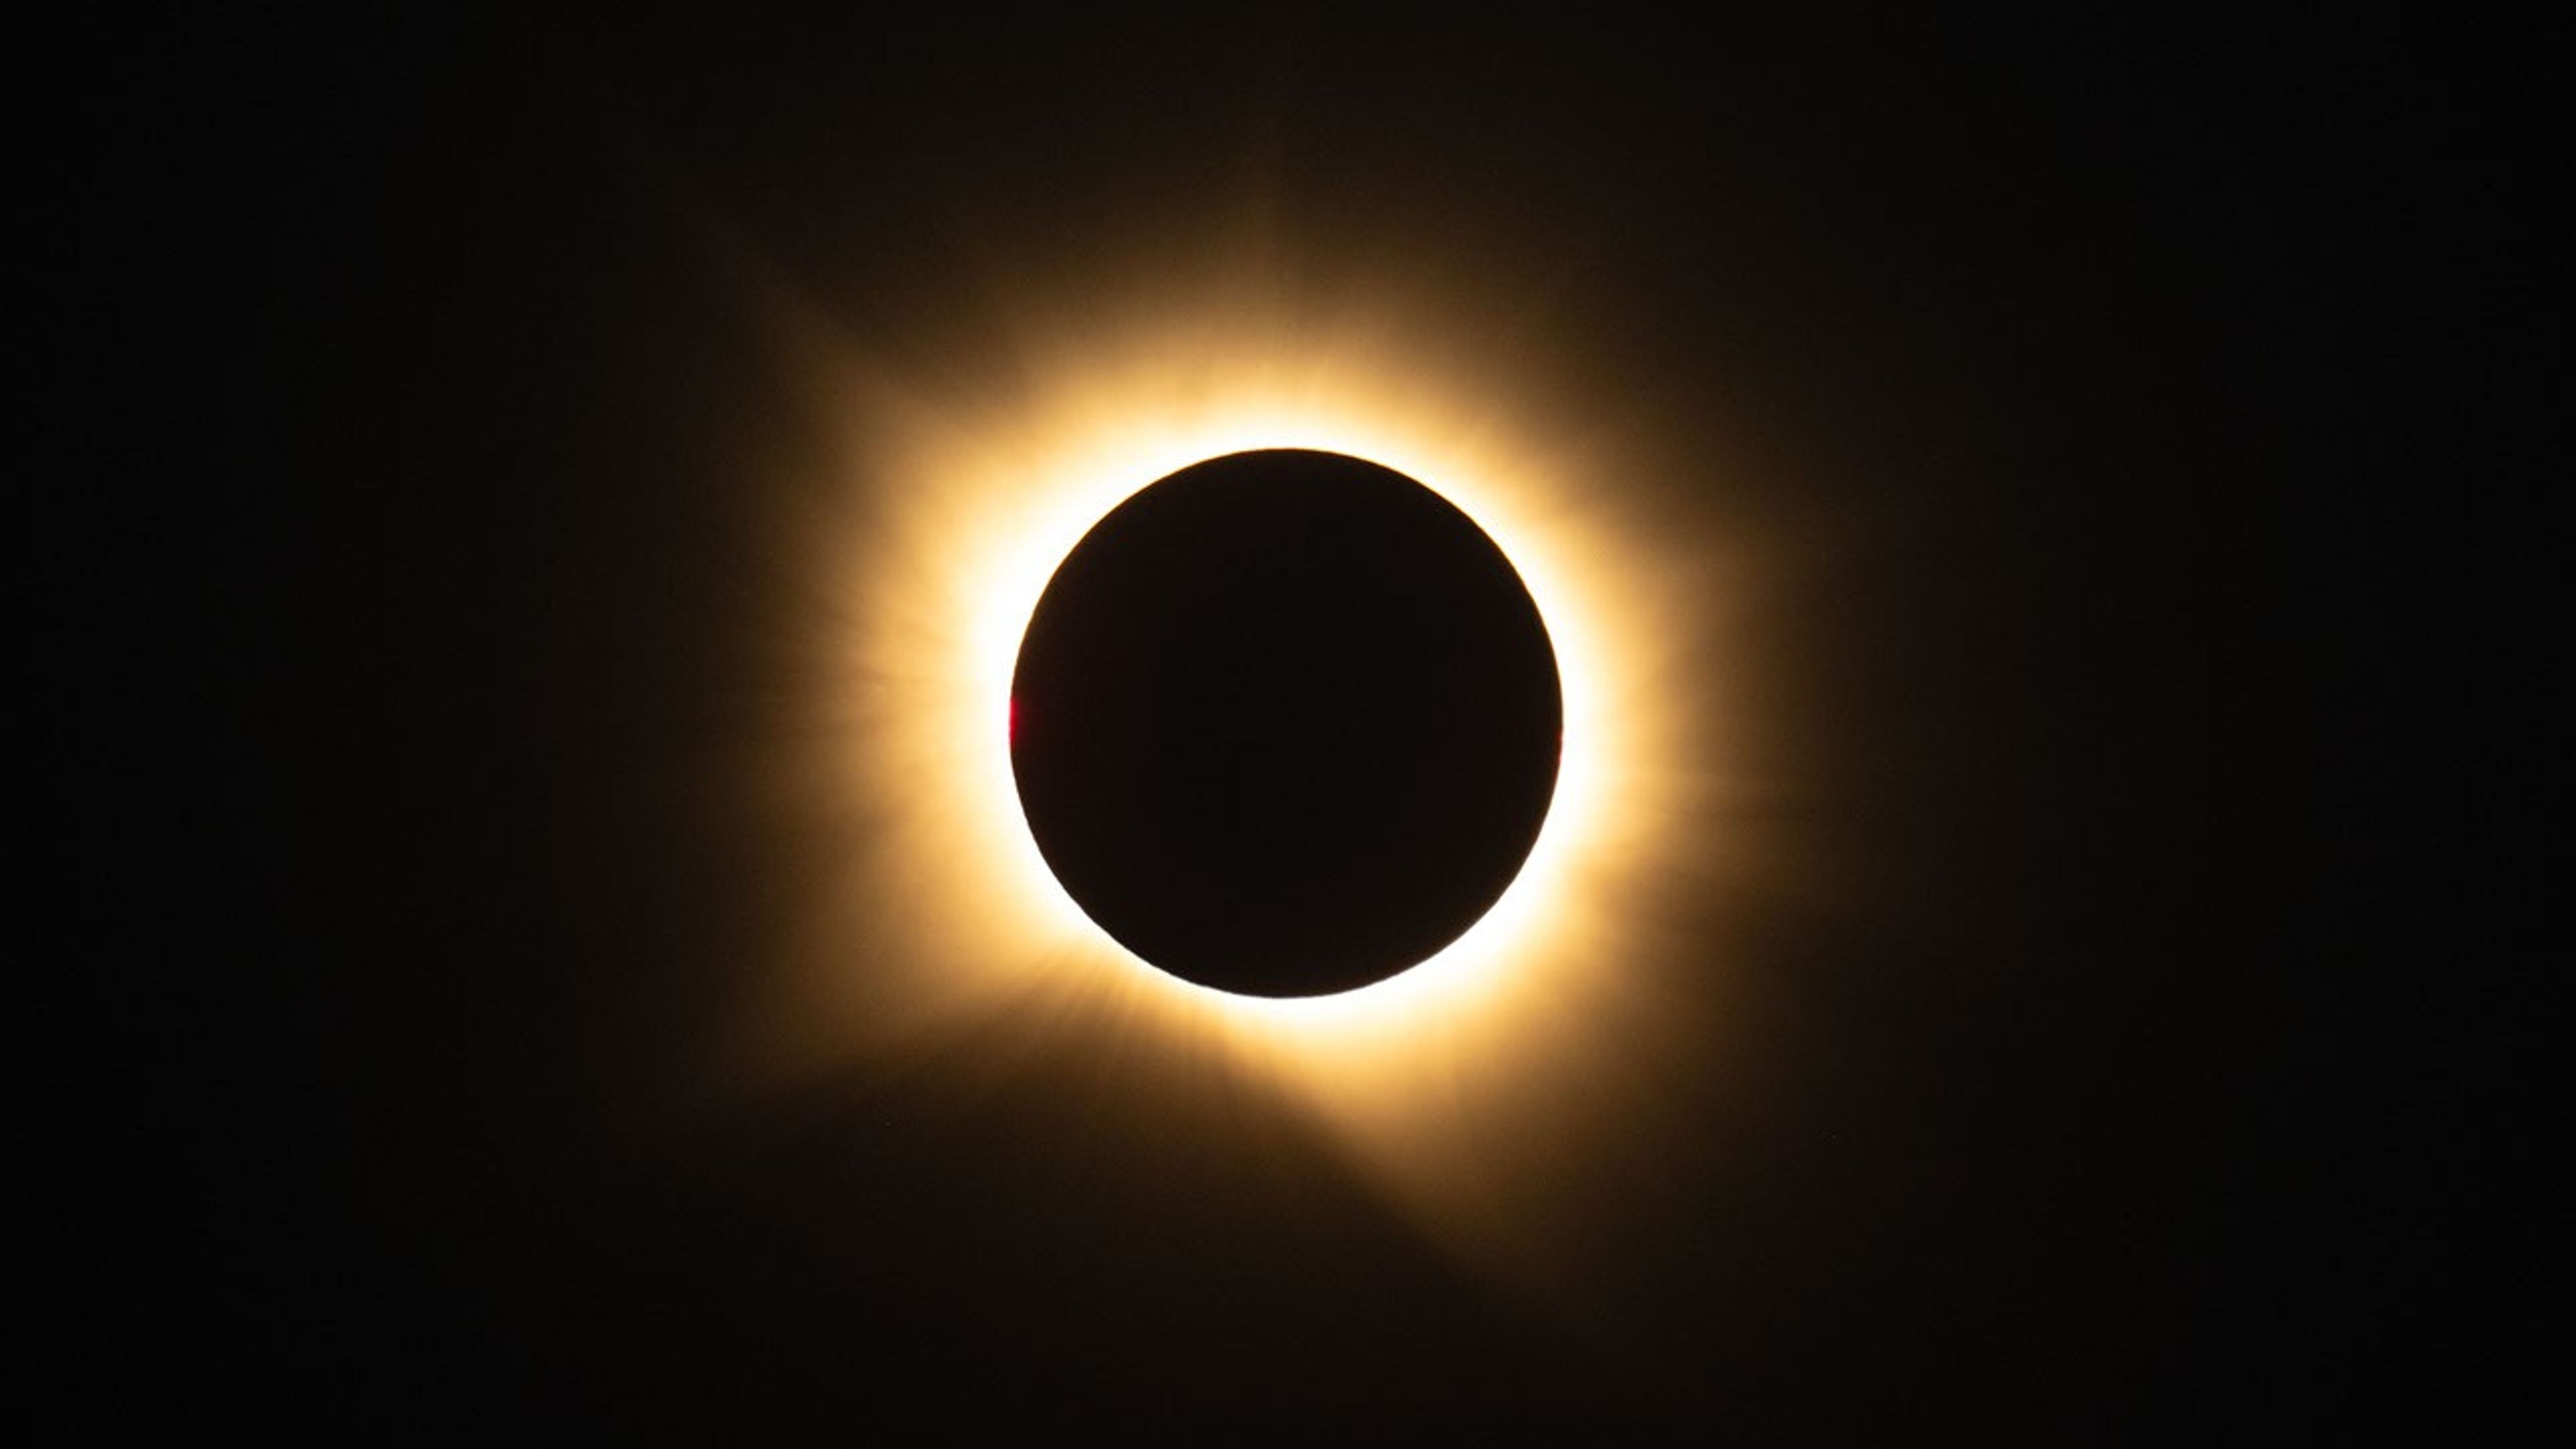
In this photograph of a total solar eclipse, the black disk of the Moon covers the face of the Sun, leaving a glowing, yellow, hazy ring of corona around the edges of the Moon, with large streamers extending toward the upper left, lower left, and lower right.
The solar corona appears in this photograph of a total solar eclipse captured from San Millán de los Caballeros, Spain, on Aug. 12, 2026. Credit: NASA/Bill Ingalls
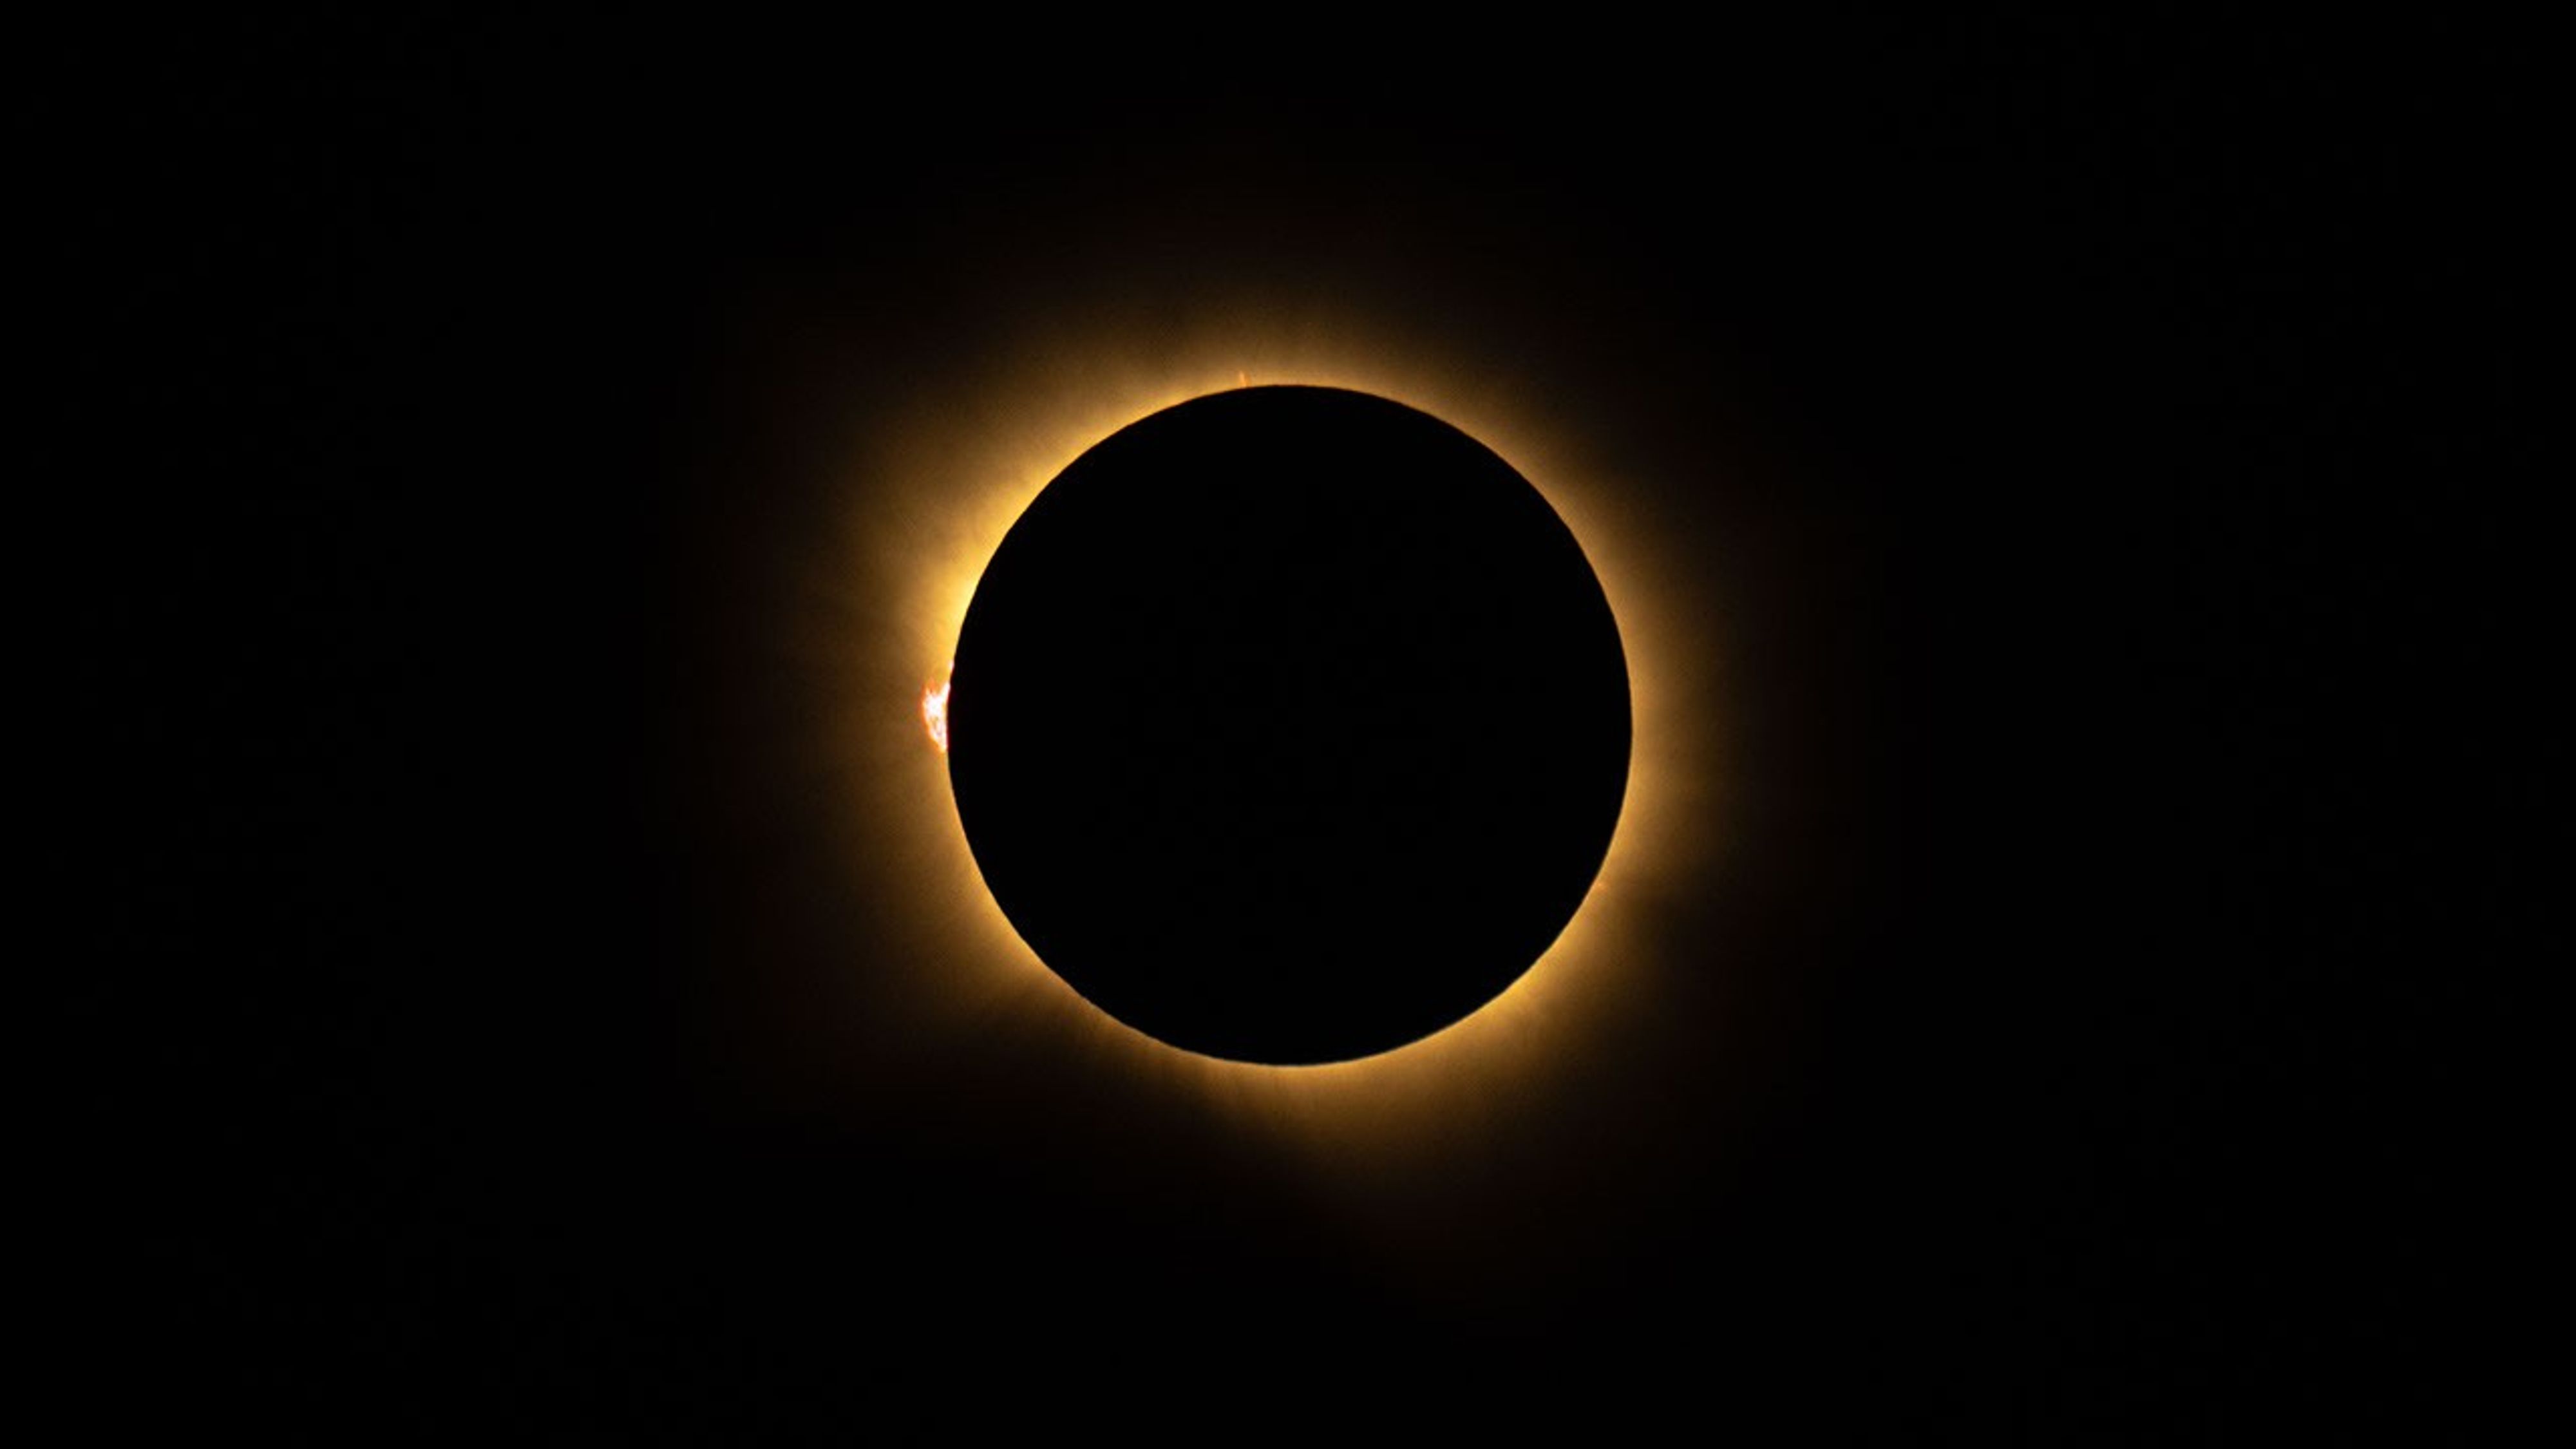
In this photograph of a total solar eclipse, the black disk of the Moon covers the face of the Sun, leaving a glowing, yellow, hazy ring of corona around the edges of the Moon. On the left edge is a pink, mountain-shaped prominence rising off of the edge of the eclipsed Sun.
A solar prominence, a plume of electrically charged gas suspended above the Sun by strong magnetic forces, appears as a pink feature along the left edge of the eclipsed Sun in this photograph taken from San Millán de los Caballeros, Spain, on Aug. 12, 2026. Credit: NASA/Bill Ingalls
A sequence of images in a diagonal line from upper left to lower right shows the progression of a total solar eclipse, with an uneclipsed Sun in the upper left and other images showing the Sun becoming more and more eclipsed toward the lower right. A total eclipse, with the white corona around the dark disk of the Moon, appears in the line of eclipse images, near the center. Three more images to the lower right of the total eclipse show a crescent Sun becoming less eclipsed. The final image in the lower right shows the Sun starting to dip below the horizon, with its lower portions covered by the foreground.
This composite image shows the progression of a total solar eclipse as the Sun sets in San Millán de los Caballeros, Spain, on Aug. 12, 2026. Credit: NASA/Bill Ingalls

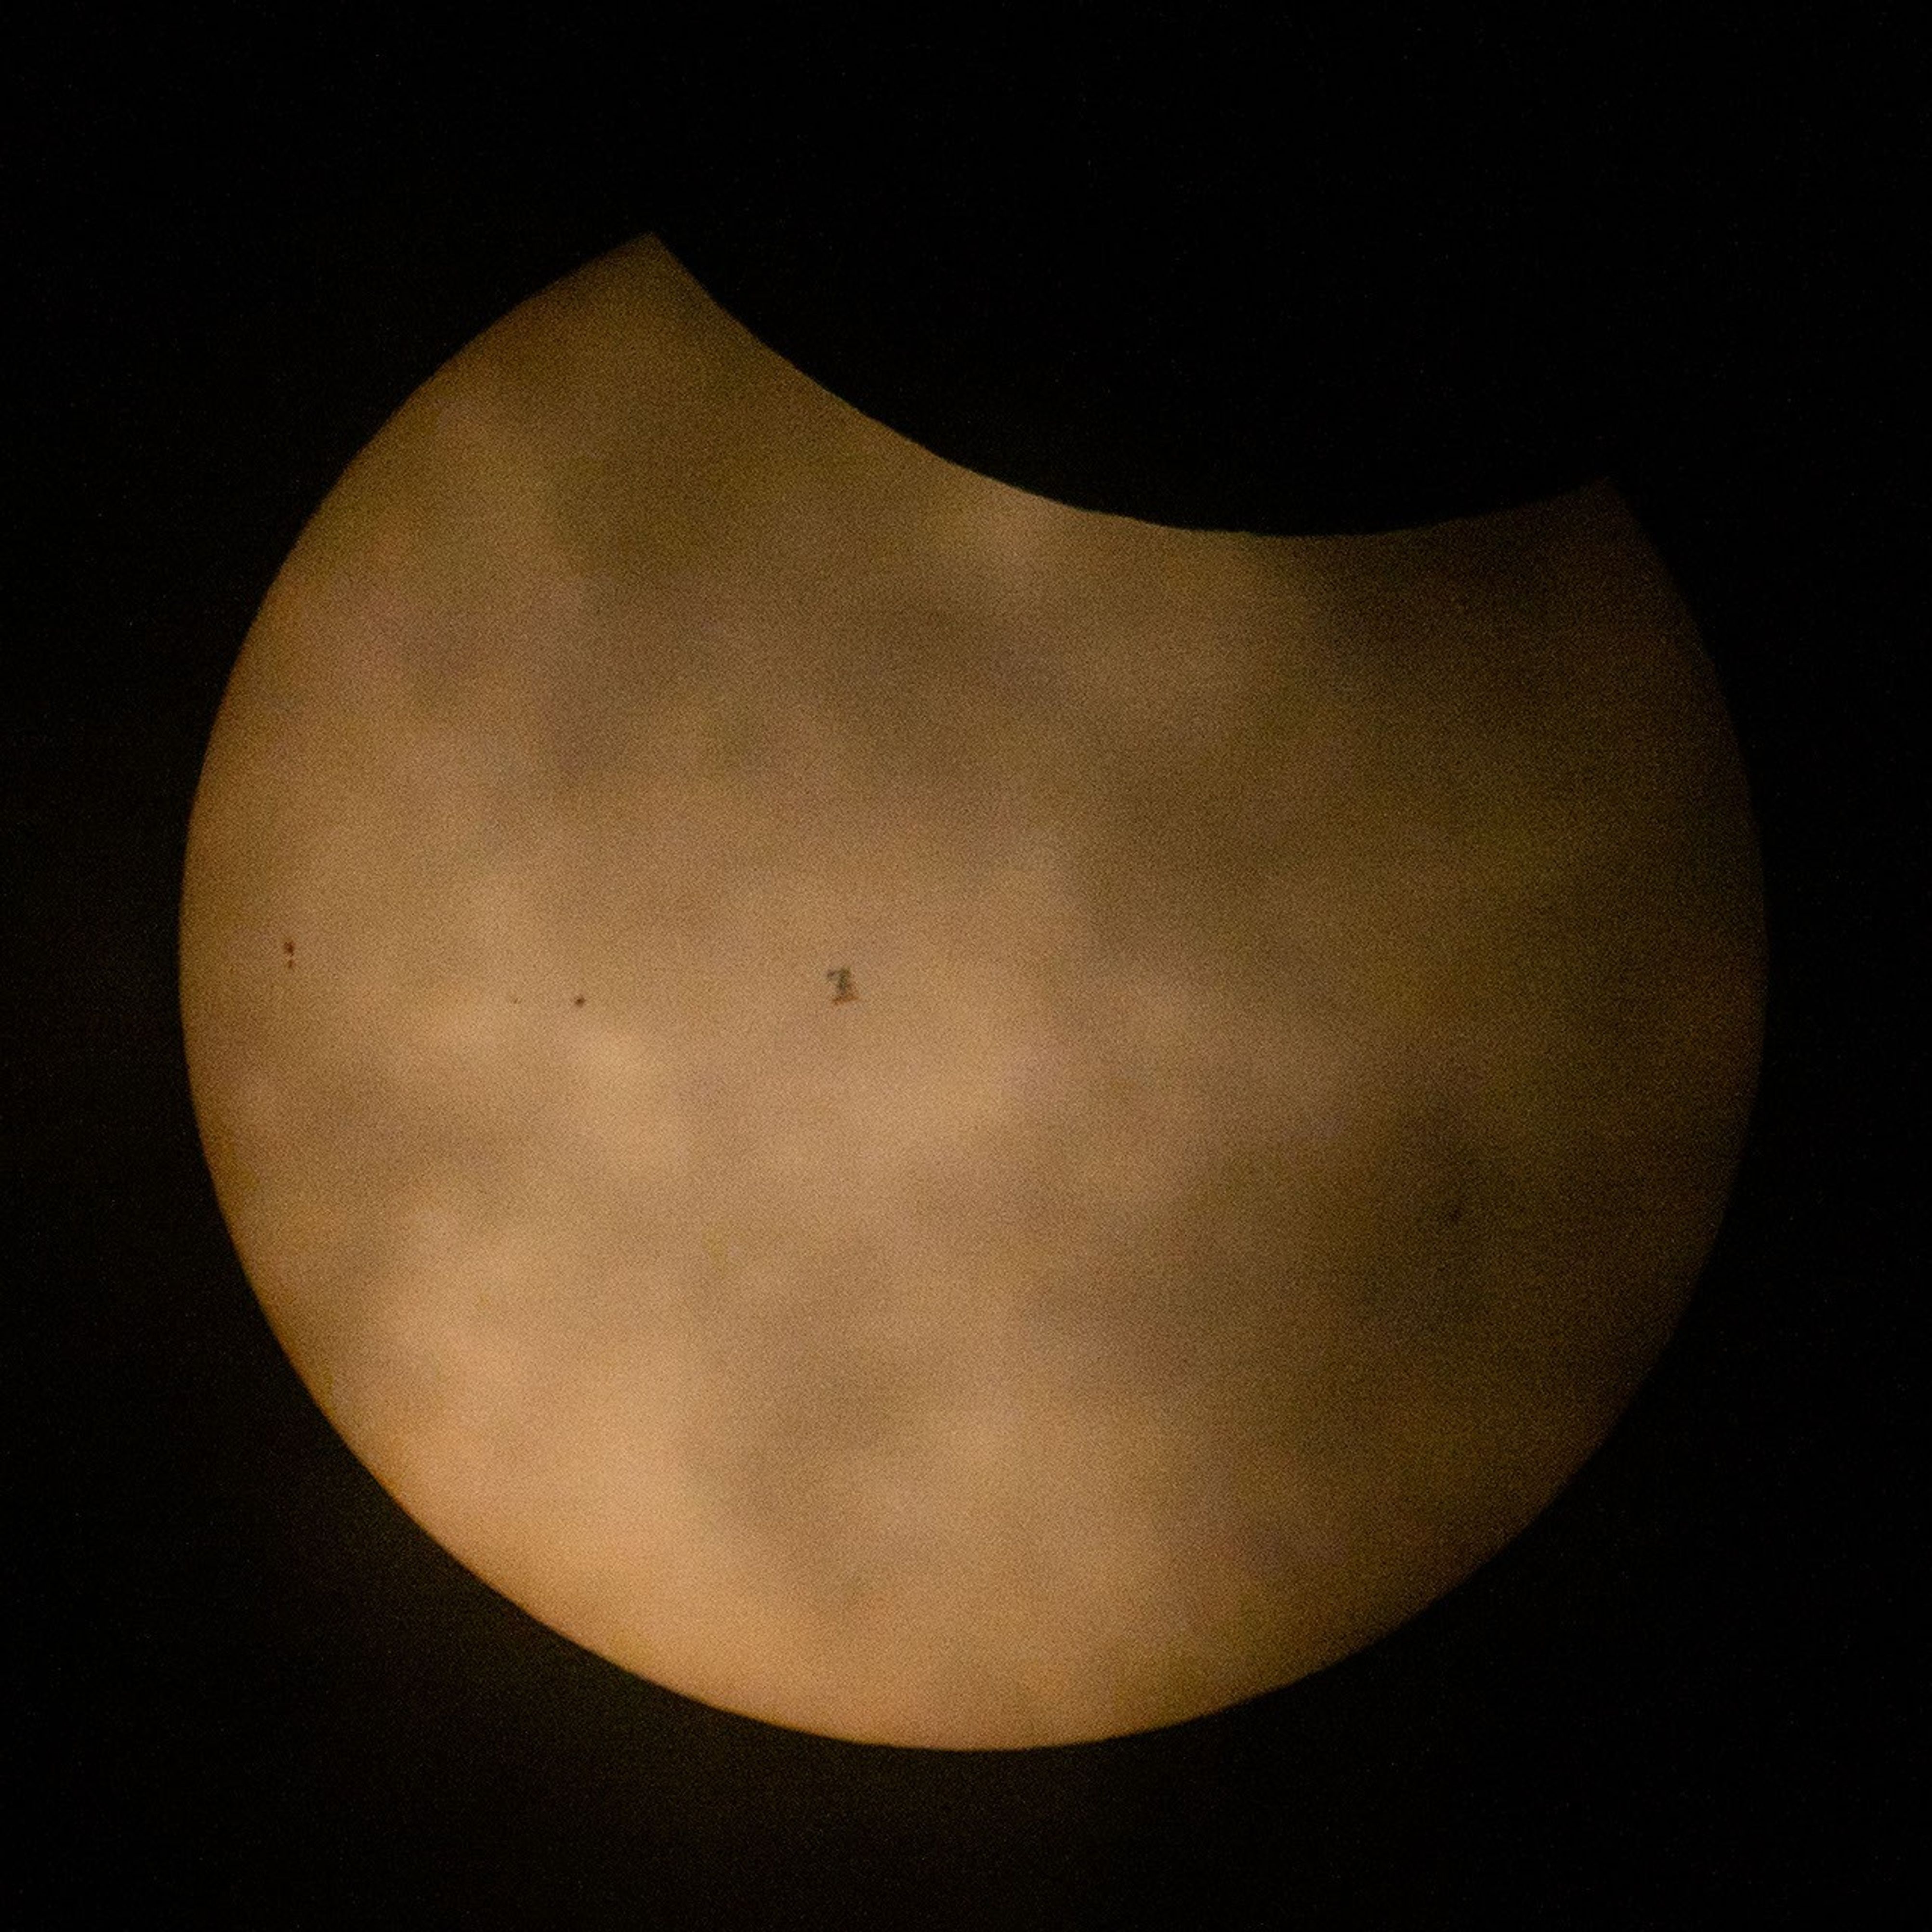
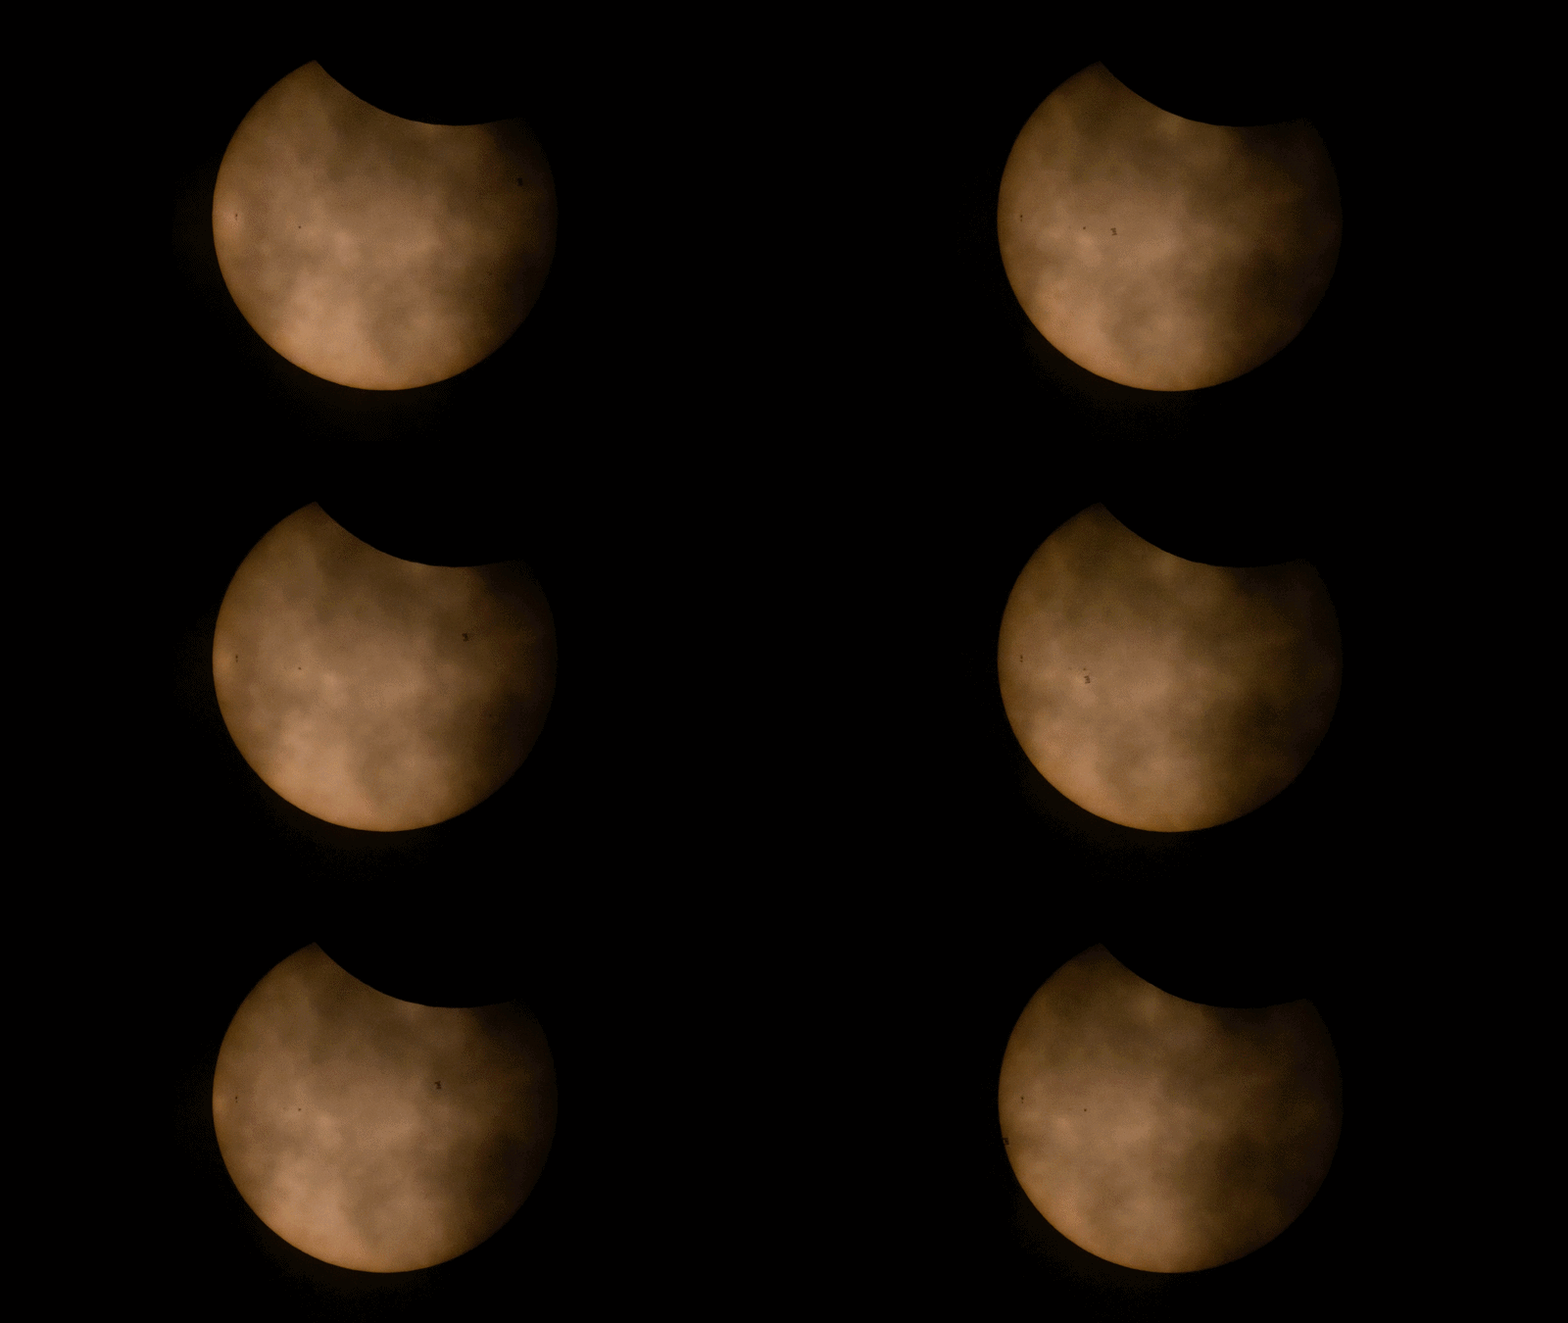
In northern Maine, where only a partial eclipse was visible, another NASA photographer captured the International Space Station, with its crew of seven aboard, speeding past the partially eclipsed Sun.

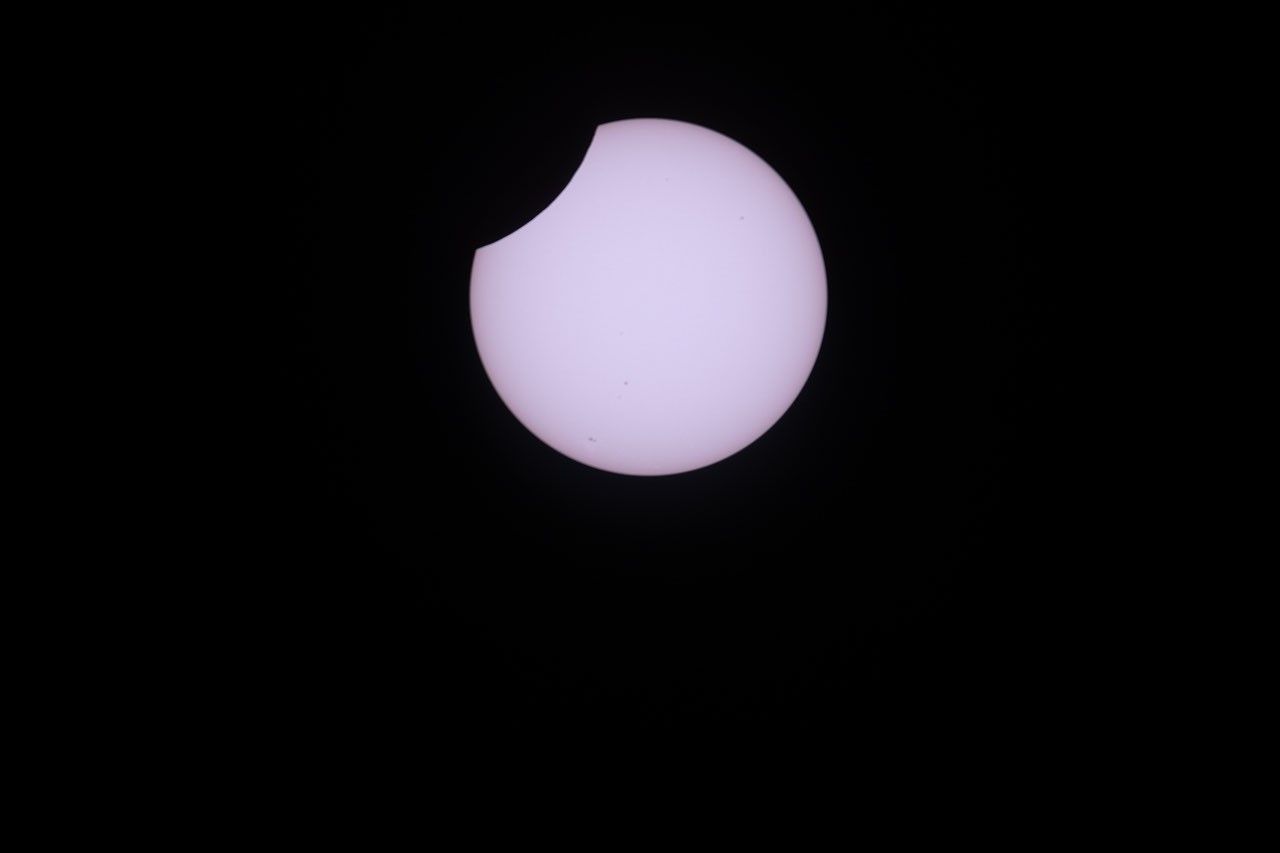
A partially eclipsed Sun appears with the Moon blocking a small portion of the Sun at top. Clouds also appear in front of the Sun. To the left of center is the small silhouette of the International Space Station. A few sunspots appear on the Sun to the left of the space station.
In this image of a partial solar eclipse, which is veiled by clouds, the International Space Station, with a crew of seven aboard, appears in silhouette as it transits at roughly five miles per second on Aug. 12, 2026, as seen near Hodgdon, Maine. Aboard the station as part of Expedition 75 are NASA astronauts Jessica Meir, Anil Menon, and Jack Hathaway; ESA (European Space Agency) astronaut Sophie Adenot; and Roscosmos cosmonauts Pyotr Dubrov, Andrey Fedyaev, and Anna Kikina. Credit: NASA/Joel Kowsky
An animated GIF shows the partially eclipsed Sun, with the Moon covering the top part of the Sun and thin clouds in front of the Sun, appearing like smoke. During the animation, a silhouette of the International Space Station passes from right to left across the center of the Sun.
Twelve frames assembled in sequence show the International Space Station, with a crew of seven aboard, in silhouette as it transits the Sun at roughly five miles per second during a partial solar eclipse on Aug. 12, 2026, as seen near Hodgdon, Maine. Clouds partially obscure the view of the Sun. Aboard the station as part of Expedition 75 are NASA astronauts Jessica Meir, Anil Menon, and Jack Hathaway; ESA (European Space Agency) astronaut Sophie Adenot; and Roscosmos cosmonauts Pyotr Dubrov, Andrey Fedyaev, and Anna Kikina. Credit: NASA/Joel Kowsky

Meanwhile, from about 250 miles above the ground, a NASA astronaut aboard the International Space Station snapped a few photos of the partial eclipse from their perspective as well.

A photo shows the partially eclipsed Sun as a white disk, set against a black sky, with a small
NASA astronaut Jessica Meir captured this photo of the partial solar eclipse from the International Space Station on Aug. 12, 2026, as the orbital outpost soared 262 miles above southern Quebec, Canada. From the station, the Moon covered about 18% of the Sun at the peak of the eclipse. Credit: NASA/Jessica Meir

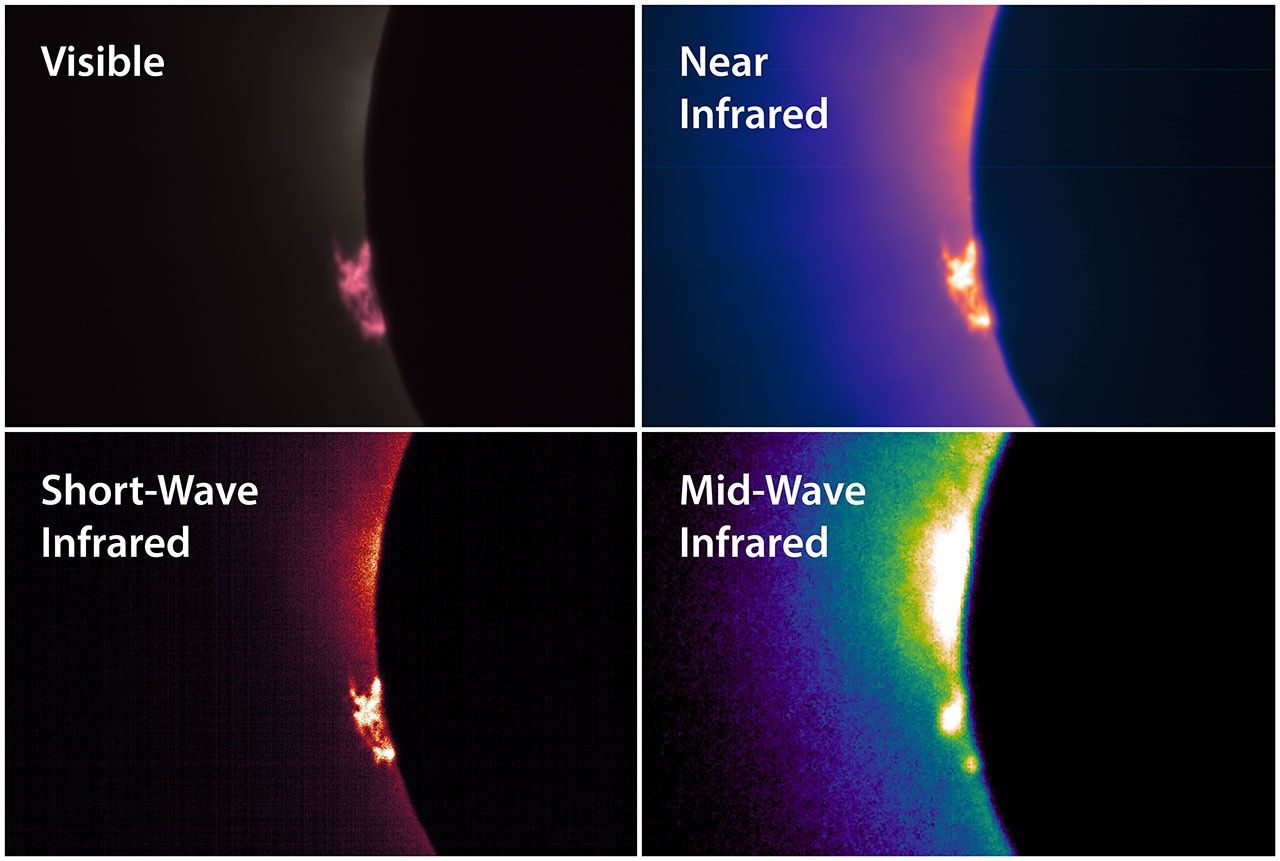
Between the ground and the space station, NASA pilots flew NASA’s WB-57F research jet at an altitude of 50,000 feet, passing through the eclipse’s shadow to lengthen their time in the eclipse. The jet carried a suite of cameras that captured high-resolution images of the corona and prominences, plumes of electrically charged gas rising off the Sun, in several different wavelengths of light.

The total solar eclipse on Aug. 12, 2026, was captured by a camera mounted inside the cockpit window of NASA’s WB-57F aircraft as it flew around 50,000 feet altitude off the coast of Iceland.
NASA
Four panels show the left edge of the eclipsed Sun in different wavelengths of light. In each image is a cloud of material, a prominence, rising off the left edge of the Sun. The prominence appears in different colors and resolutions in each image. The four images are labeled Visible, Near Infrared, Short-Wave Infrared, and Mid-Wave Infrared.
A suite of cameras installed on NASA’s WB-57F aircraft captured images of the solar corona and prominences in different wavelengths of visible and infrared light during the total solar eclipse on Aug. 12, 2026. A science team led by the Southwest Research Institute in Boulder, Colorado, will analyze the images to learn more about complex and dynamic features in the Sun’s outer atmosphere. Credit: NASA/SwRI/Will Ashfield
In both Iceland and Spain, teams of students participating in the NASA-funded Nationwide Eclipse Ballooning Project launched scientific balloons that carried instruments to capture images of the eclipse’s shadow and study the eclipse’s effects on our atmosphere. Even though clouds obscured the view of the eclipse from the ground in Iceland, the weather did not interfere with the balloon-borne instruments’ ability to gather information about how the brief loss of light and heat affected the lower atmosphere.

Four students in jackets hold a large white balloon in a grassy field under a gray, cloudy sky.
Students participating in the NASA-funded Nationwide Eclipse Ballooning Project prepare to launch a scientific balloon in Mosfellsbær, Iceland, during the total solar eclipse on Aug. 12, 2026. Credit: NASA/Abbey Interrante
The Moon’s shadow passes over the atmosphere during the total solar eclipse on Aug. 12, 2026. The video was taken by a camera carried by a scientific balloon launched from Spain by a student team from Montana State University participating in the NASA-funded Nationwide Eclipse Ballooning Project. The video captures about six minutes of time but is sped up to play at four times real speed. Passing through the foreground are some other science instruments carried by the same balloon.
Nationwide Eclipse Ballooning Project/Montana State University

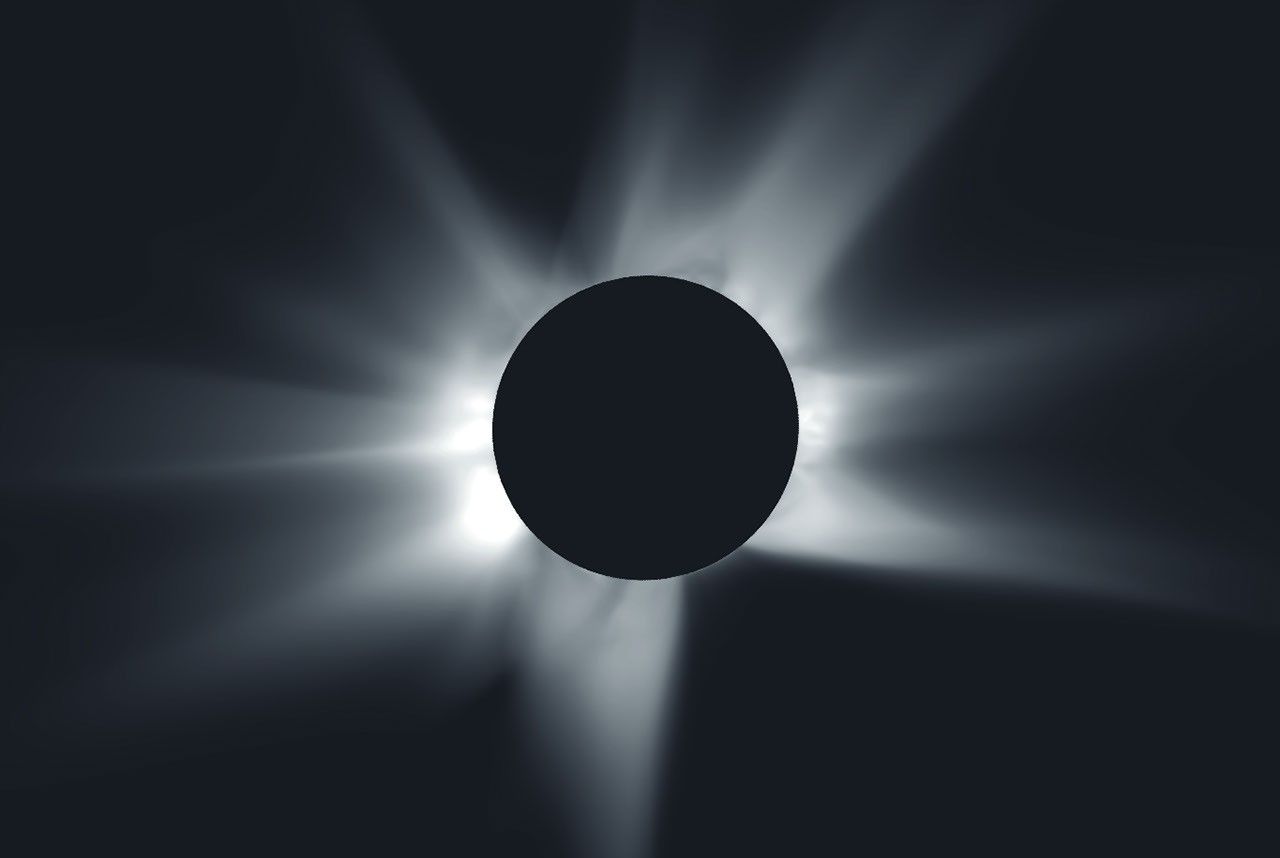
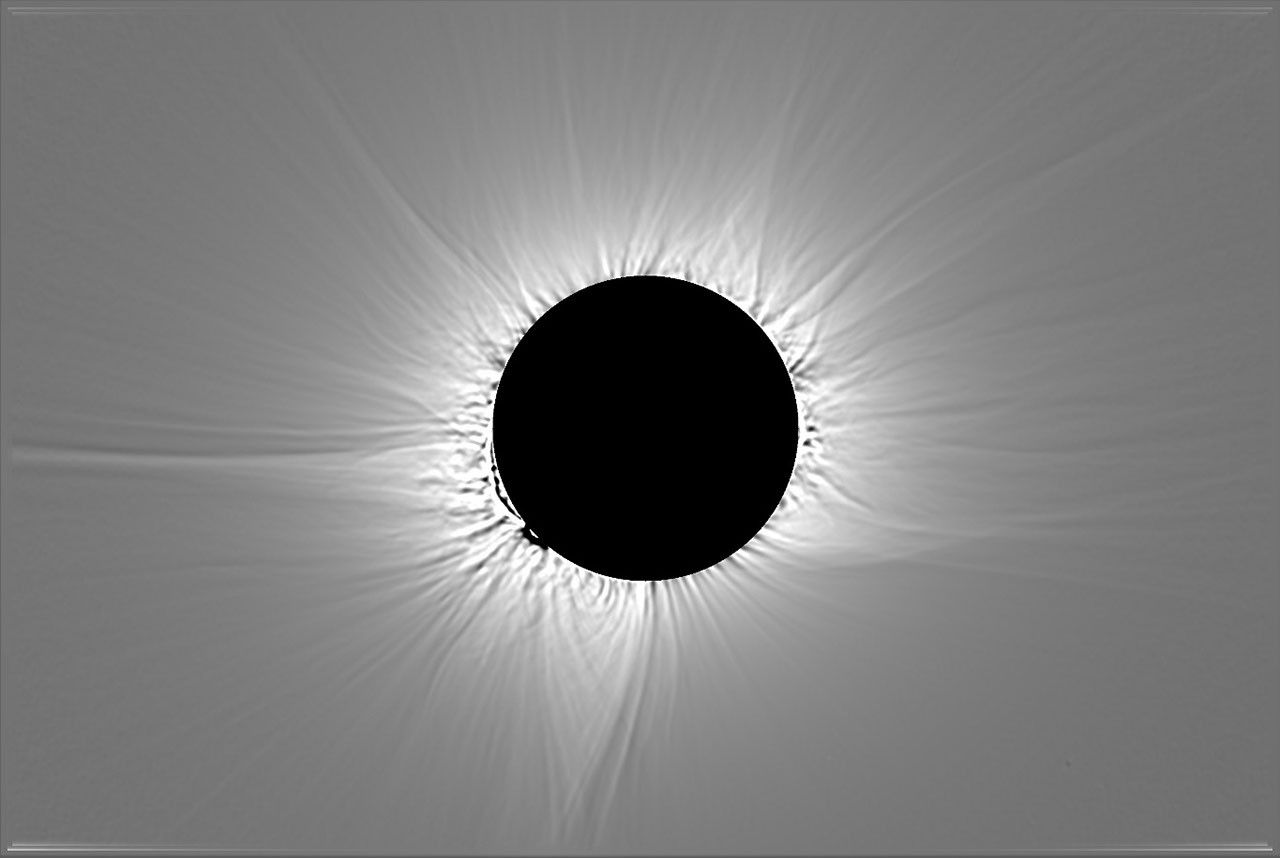
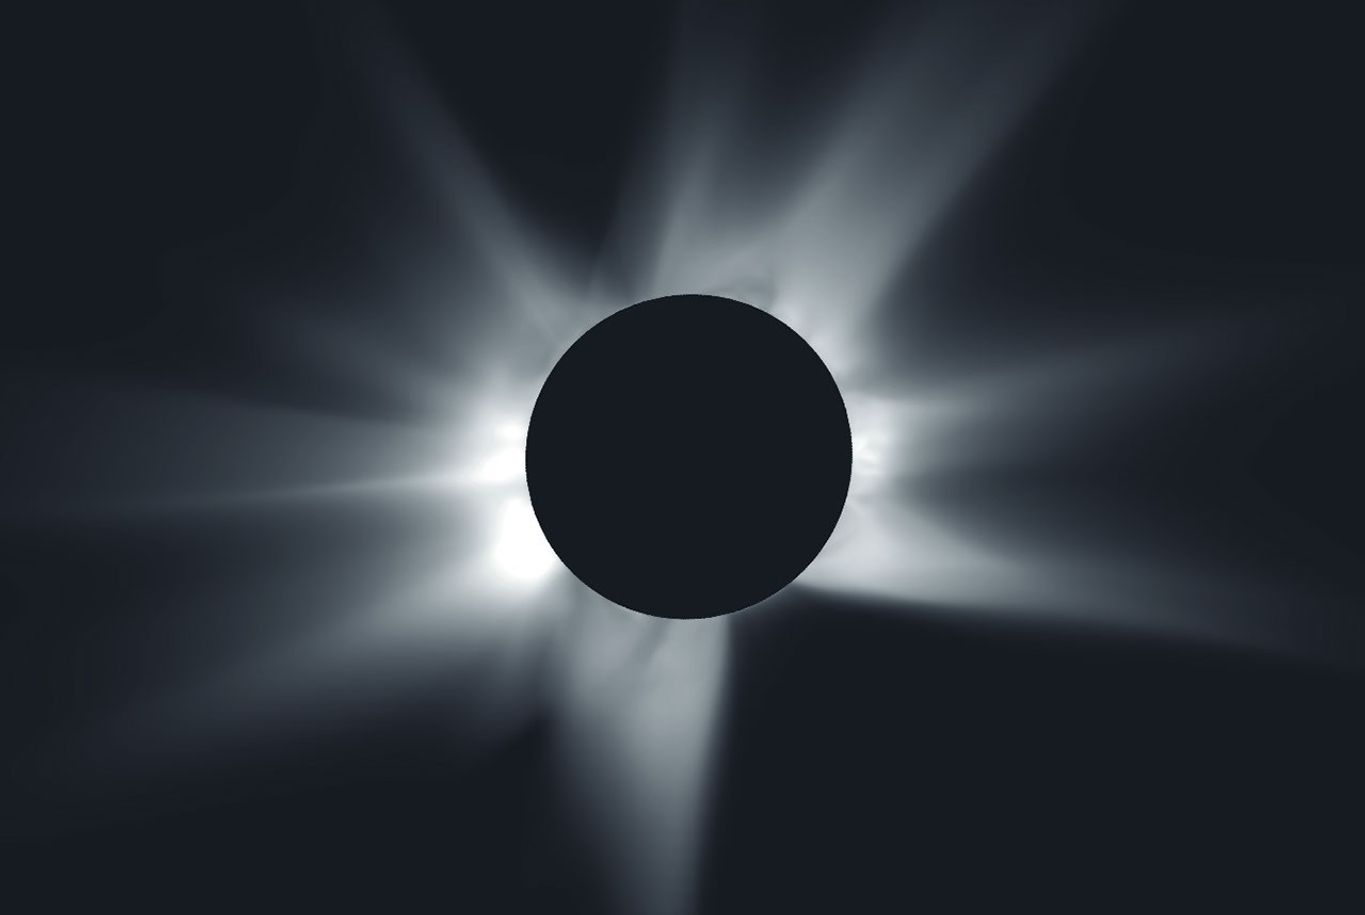
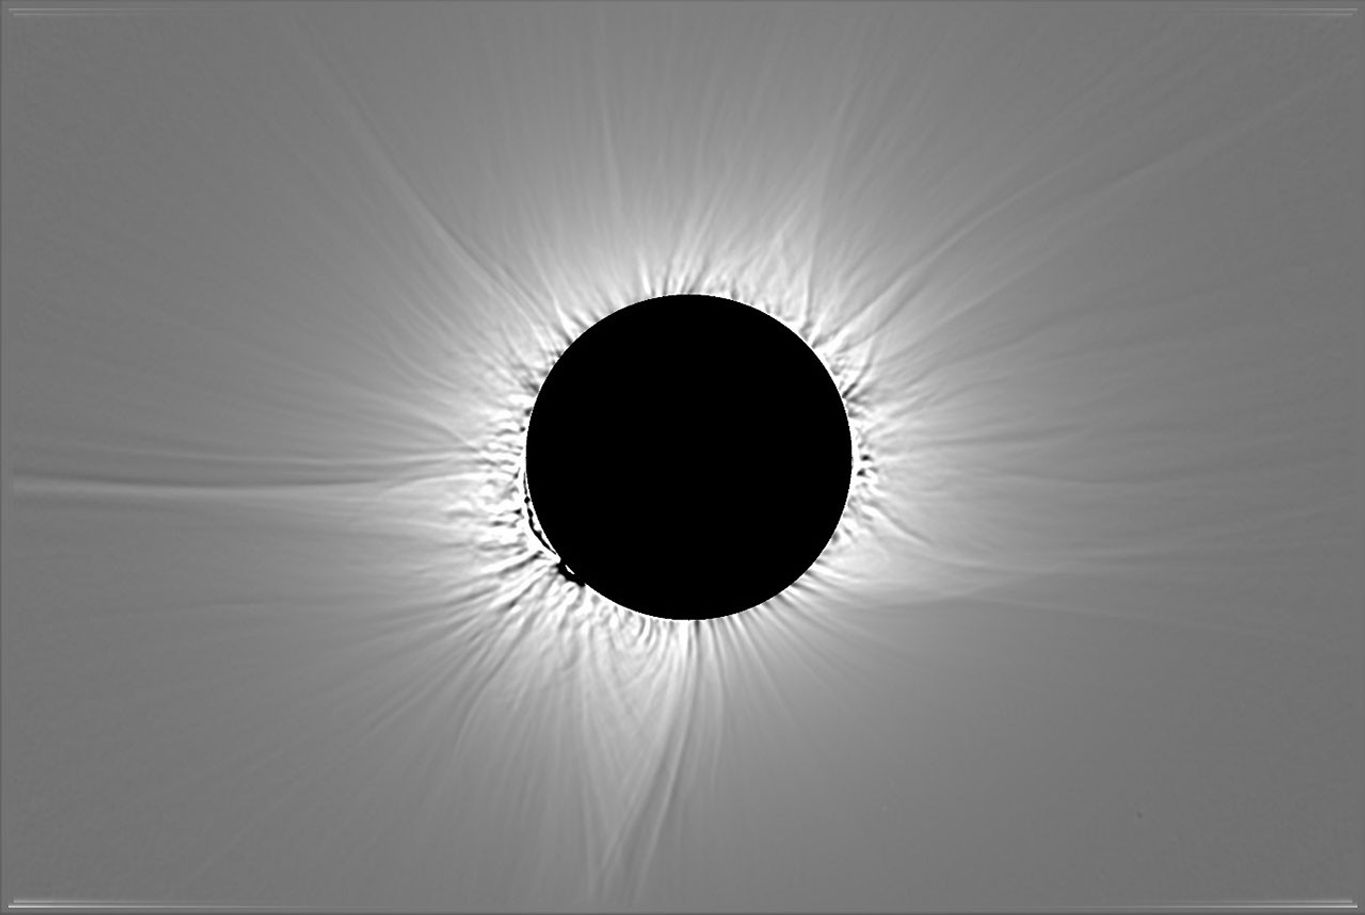
Before the eclipse, scientists at Predictive Science Inc., with support from NASA grants and supercomputers, used observations of the Sun from NASA spacecraft and ground-based telescopes to predict what the corona would look like during the eclipse. Below, their corona prediction is compared to a composite image of the corona, which combines multiple images captured by the NASA-supported DEB Initiative project during the total eclipse near León, Spain.


prediction
image

A simulated image of a total solar eclipse shows the Moon as a black disk at the center surrounded by white rays extending outward around the Moon, set against a black background. Some of the rays are longer or thicker than others.
This image shows a prediction from the morning of Aug. 12, 2026, of what the solar corona would look like to the human eye during the total solar eclipse that day.
Predictive Science Inc.

An image of a total solar eclipse shows the Moon as a black disk at the center surrounded by white rays extending outward around the Moon, set against a gray background. Some of the rays are longer or thicker than others.
This processed, composite image of the corona combines multiple images captured near León, Spain, during the total solar eclipse on Aug. 12, 2026.
DEB Initiative Team/Zack Stockbridge

A simulated image of a total solar eclipse shows the Moon as a black disk at the center surrounded by white rays extending outward around the Moon, set against a black background. Some of the rays are longer or thicker than others.
This image shows a prediction from the morning of Aug. 12, 2026, of what the solar corona would look like to the human eye during the total solar eclipse that day.
Predictive Science Inc.
An image of a total solar eclipse shows the Moon as a black disk at the center surrounded by white rays extending outward around the Moon, set against a gray background. Some of the rays are longer or thicker than others.
This processed, composite image of the corona combines multiple images captured near León, Spain, during the total solar eclipse on Aug. 12, 2026.
DEB Initiative Team/Zack Stockbridge

prediction

image


The left image shows a prediction from the morning of Aug. 12, 2026, of what the solar corona would look like to the human eye during the total solar eclipse that day. The right image is processed, composite image of the corona that combines multiple images captured near León, Spain, during the total solar eclipse on Aug. 12, 2026. Left image credit: Predictive Science Inc.; right image credit: DEB Initiative Team/Zack Stockbridge

Over the coming months, scientists will analyze the observations and images captured during the solar eclipse on Aug. 12 and present what they have learned about the Sun and its effects on our home planet. These observations will also help prepare science teams to investigate future solar eclipses, such as a much longer total solar eclipse that will be visible from southern Spain and northern Africa on Aug. 2, 2027.

Read more about NASA’s research during the eclipse and rewatch NASA’s eclipse broadcast to hear from some of the scientists and students who conducted the experiments.

About the Author

Vanessa Thomas

Vanessa Thomas

Vanessa Thomas is a science writer with the heliophysics communications team at NASA’s Goddard Space Flight Center in Greenbelt, Maryland.

Share

Details

Last Updated
Aug 21, 2026
Keep Exploring

Discover More Topics From NASA

NASA’s COFFIES Uses AI to Predict Storm-Causing Active Regions on Sun 

5 min read

NASA’s COFFIES Uses AI to Predict Storm-Causing Active Regions on Sun 

As humanity looks to the Moon and stars for future exploration, predicting space weather — conditions in space primarily driven by the Sun — is more important than ever. 

Now, a team of astrophysicists and data scientists with NASA’s COFFIES (Consequence Of Fields and Flows in the Interior and Exterior of the Sun) has developed a novel machine-learning model capable of predicting the emergence of active regions on the Sun up to 12 hours before they appear. 

The Sun is constantly churning. Intense concentrations of localized magnetic fields can suddenly break through the solar surface, forming sunspots. Space weather forecasters then collectively number and track sunspots since they are visible manifestations of active regions, which serve as the main engines behind severe space weather events such as solar flares and coronal mass ejections. These eruptions send waves of high-energy radiation and charged particles across space, creating storms that can threaten astronauts, disable satellites, and disrupt radio communications on Earth. 

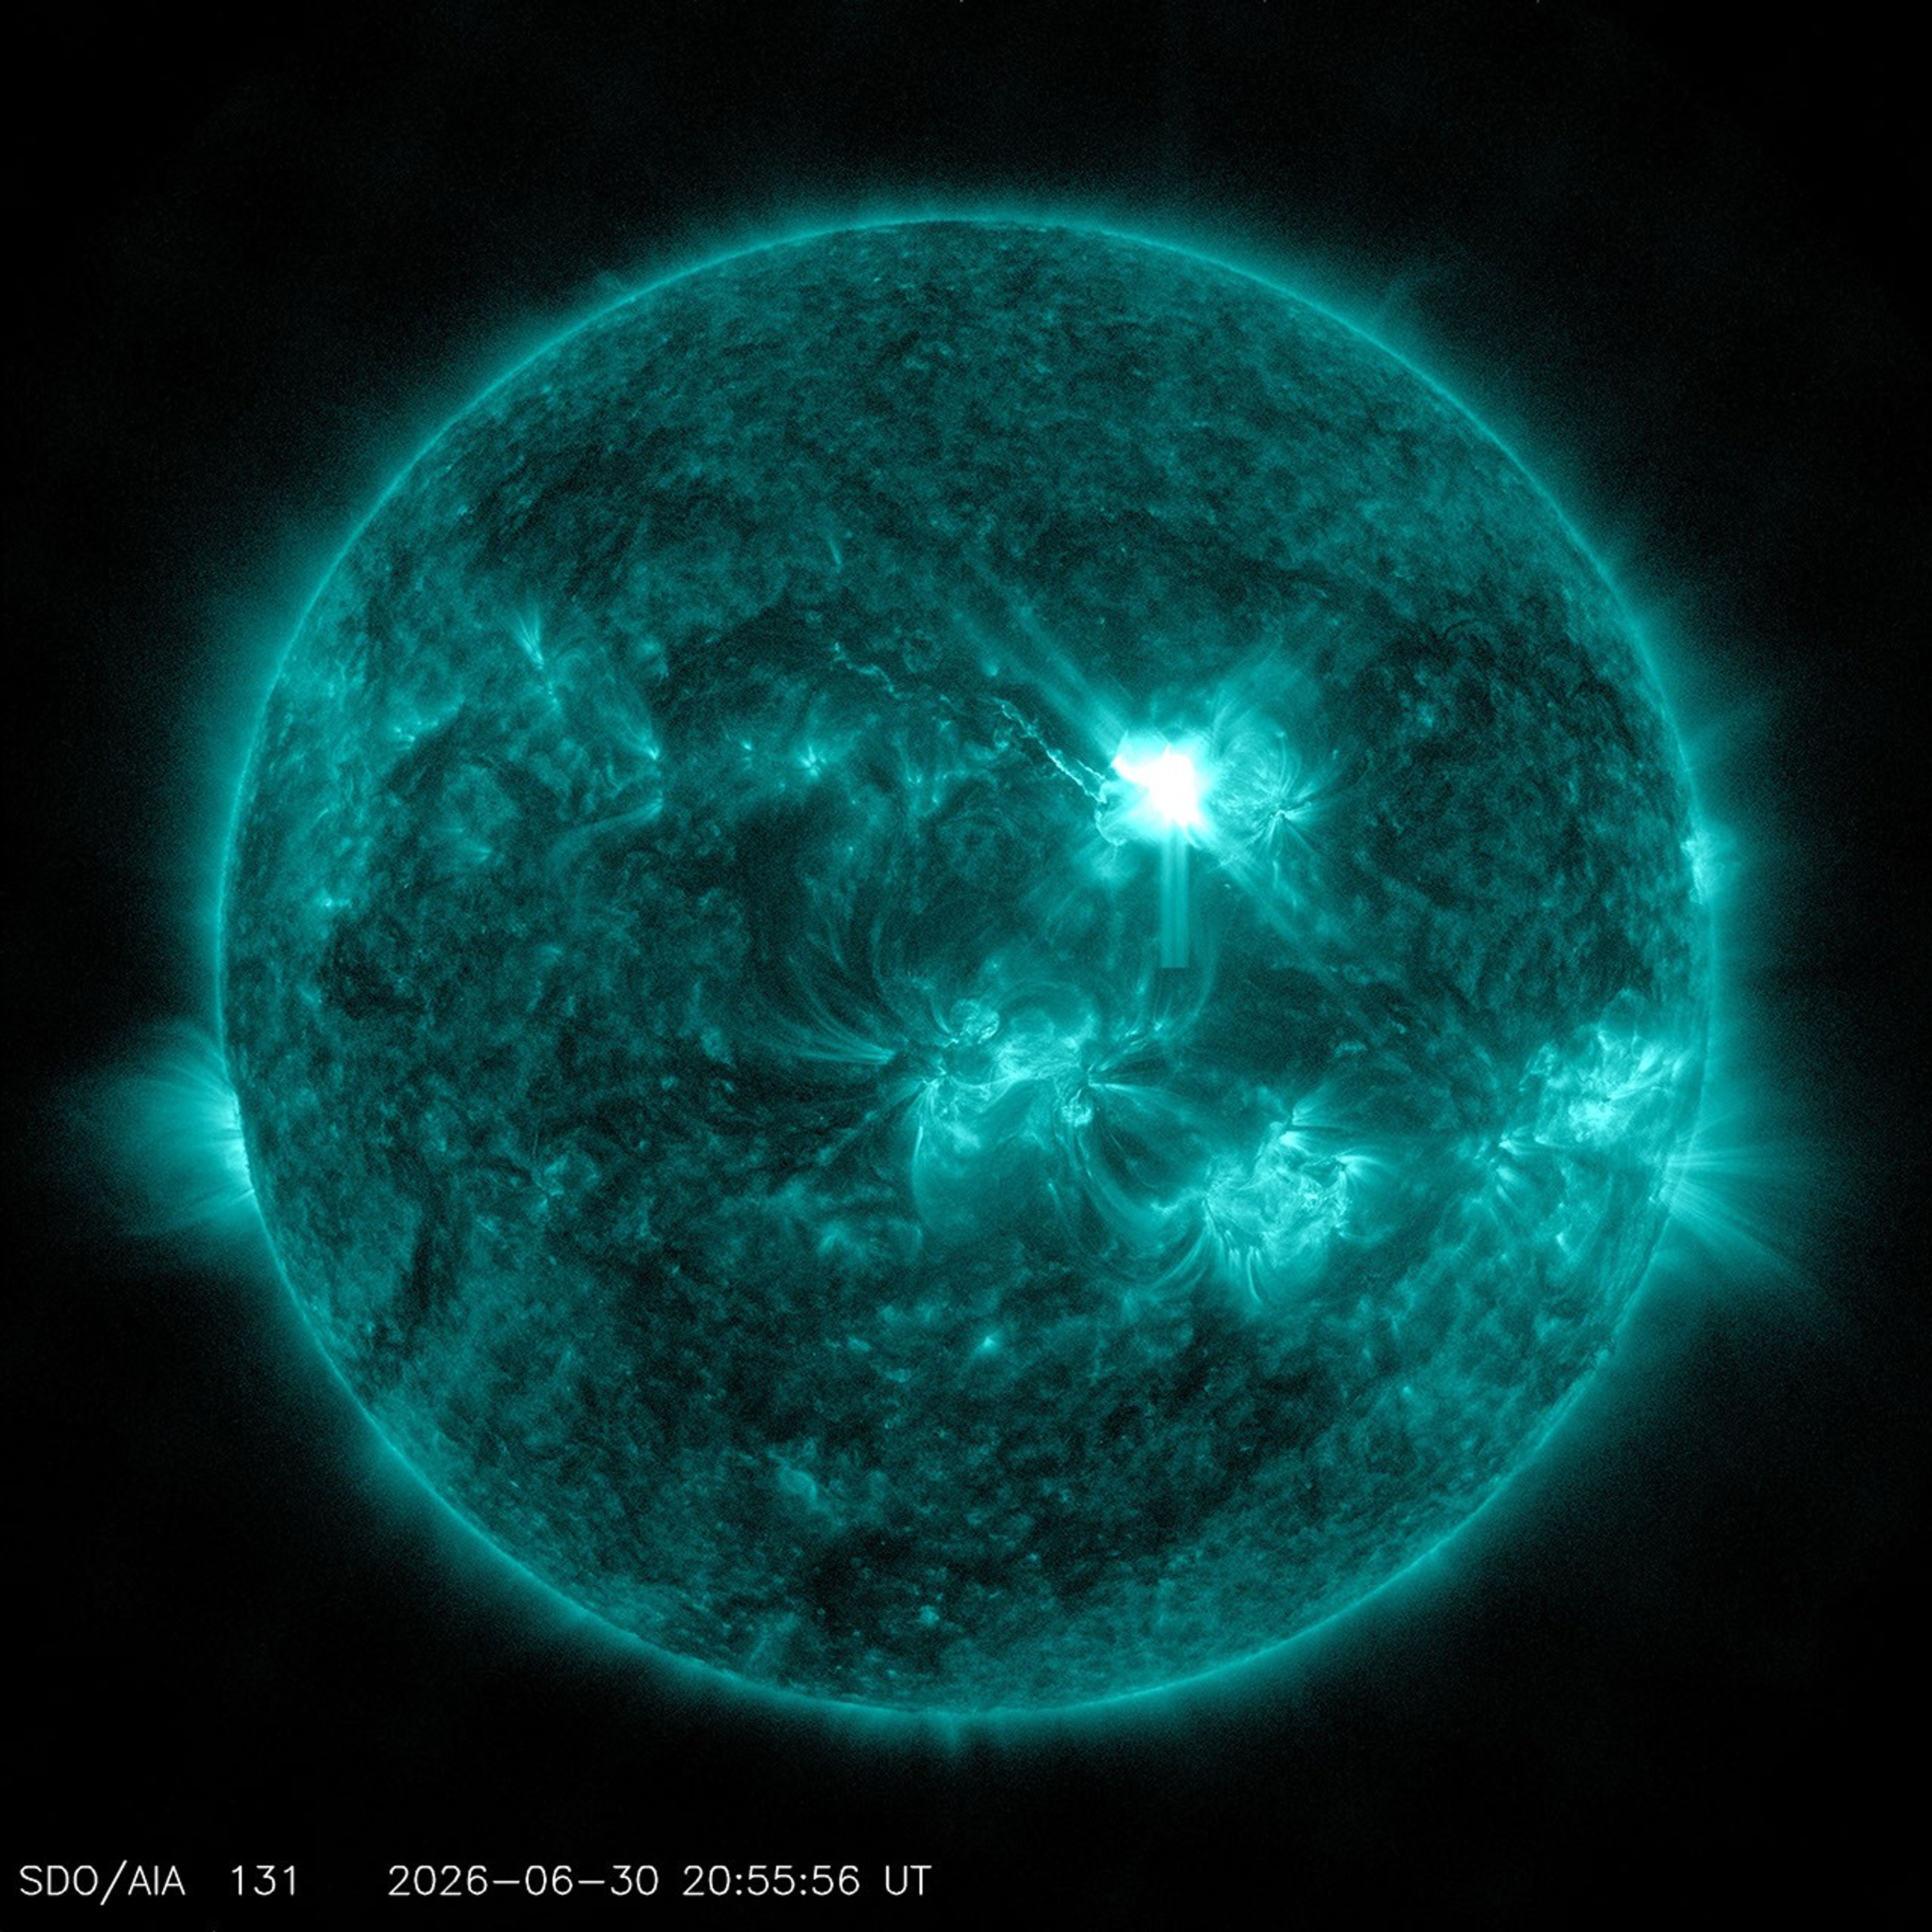
The Sun appears in shades of teal with some brighter and darker regions, set against a black background. In the upper right part of the Sun is a bright flash of white, a solar flare.
NASA’s Solar Dynamics Observatory captured this image of a solar flare — seen as the bright flash in the upper right — on June 30, 2026. The image shows a subset of extreme ultraviolet light that highlights the extremely hot material in flares and which is colorized in teal.
NASA’s Goddard Space Flight Center/SDO 

By bridging expertise across different scientific institutions, COFFIES, a NASA DRIVE (Diversify, Realize, Integrate, Venture, Educate) Science Center, brought together a team of researchers from New Jersey Institute of Technology (NJIT), Princeton University, and NASA’s Ames Research Center in California’s Silicon Valley. The team turned to advanced artificial intelligence architectures — which dictate how data is processed and used to produce reliable predictions or actions — to capture subtle, time-based pattern changes on the solar surface before an active region took shape. By analyzing data captured by the agency’s Solar Dynamics Observatory and using NASA Ames’ supercomputing resources, this new approach, published in the Journal of Geophysical Research: Machine Learning and Computation, looks at fluctuations in acoustic waves caused by sunspot regions when the regions form beneath the solar surface and begin the journey upward to emerge on the surface. 

“We cannot directly see the magnetic structure while it is still rising through the solar interior. Instead, we must look for indirect effects — very small changes in the magnetic field and in the pattern of acoustic waves continually traveling through the Sun,” said Alexander Kosovichev, a COFFIES co-investigator at NJIT. “The developed technique identifies precursors associated with an emerging active region in slight changes of the Sun’s acoustic power — more like a slight change in rhythm within a very noisy orchestra.” 

This video is an example of what scientists use when analyzing the solar surface. This particular time frame tracks the magnetic field on the Sun’s surface during the emergence of active region AR11158 in February 2011. The blue square grid highlights a target area on the Sun. The squares on the right side translates the data from the target grid area to show opposing magnetic polarities, indicated by the warm and cool-colored tones. The first column of blocks shows targeted areas at original resolution, the middle column displays data as 2D maps, and the right column plots changes in magnetic polarity over time as 1D curves. By watching these blocks, scientists can see signs of active region emergence, such as drops in acoustic waves and rises in magnetic fields.
NASA’s COFFIES DRIVE Science Center/Irina Kitiashvili and Spiridon Kasapis

To develop current operational forecasts, the National Oceanic and Atmospheric Administration’s Space Weather Prediction Center and the United States Air Force monitor active regions that are already visible on the Sun to analyze the regions’ characteristics and estimate the probability of solar flares.

The COFFIES team aims to revolutionize this process. The AI model the team developed a specialized early detection system to handle very long sequences of data — called sliding-window transformer architecture — to use observations to find tiny reductions in the Sun’s acoustic activity and magnetic field, signals that scientists struggled to capture until now. These reductions form patterns that the AI model uses to predict active regions several hours before they become visible on the solar surface. Instead of looking at all activity on the solar surface at once, like earlier deep learning approaches have done, this new model moves a fixed-size “viewing window” across a long timeline of the Sun’s activity to focus on recent data while remembering overall patterns. This method allows forecasters the ability to predict approximate locations of emerging sunspots, rather than relying on counting already visible sunspots. 

This promising AI architecture shows how deep machine learning can contribute to heliophysics — the field studying the nature of the Sun and how it influences the very nature of space and the planets that exist there. While the model is not ready for operational real-time forecasting, the team plans to validate the approach across many more known solar events to fine-tune the model. 

NASA’s real-time space weather monitoring 

As NASA focuses on sending humans to explore the Moon with the Artemis missions and sending the first crewed missions to Mars, monitoring and forecasting space weather is important for ensuring the safety of our astronauts and the equipment they rely on. This predictive leap from the COFFIES team could prove vital for safeguarding technology and deep-space explorers from the volatile environment of our solar system.

NASA’s Moon to Mars Space Weather Analysis Office monitors space weather 7 days a week. This important work helps decision makers not only protect people and equipment but maintain the services our modern society relies on every day. NASA’s space weather monitoring is also critical for safeguarding astronauts as they journey to the Moon and onward to Mars.
NASA/Lacey Young

Teams across NASA and NOAA collaborate to transition research capabilities into actual 360-degree space weather monitoring operational tools — including NASA’s Space Radiation Analysis Group, Moon to Mars Space Weather Analysis Office (M2M SWAO), and Community Coordinated Modeling Center as well as NOAA’s Space Weather Prediction Center. Sunspot region emergence prediction capabilities, especially of the Sun’s far side, could provide new information that supplements current models used by these teams.  

“The COFFIES AI model is exciting to our team because it could provide us with new capabilities towards predicting potential flaring locations ahead of time,” said Michelangelo Romano, M2M SWAO deputy director. “With this heads up, we can provide additional support to NASA missions.”

NASA’s COFFIES is one of three DRIVE Science Centers created to encourage collaborative science by establishing centers that are made of multidisciplinary teams from several institutions across the U.S. These pioneering facilities employ modelers, theoreticians, computer scientists, and observers to study important mysteries of our star and its influence, a branch of science known as heliophysics.  

The COFFIES team focuses on the interconnected processes behind the Sun’s activity. Understanding the Sun’s interior and magnetic variability is key to advancing our understanding of the Sun’s 11-year activity cycle and fine-tuning space weather forecasting tools.  

About the Author

Desiree Apodaca

Desiree Apodaca

NASA’s Heliophysics Missions Communications Lead

Keep Exploring

Discover More Topics From NASA

2026 Total Solar Eclipse in Spain

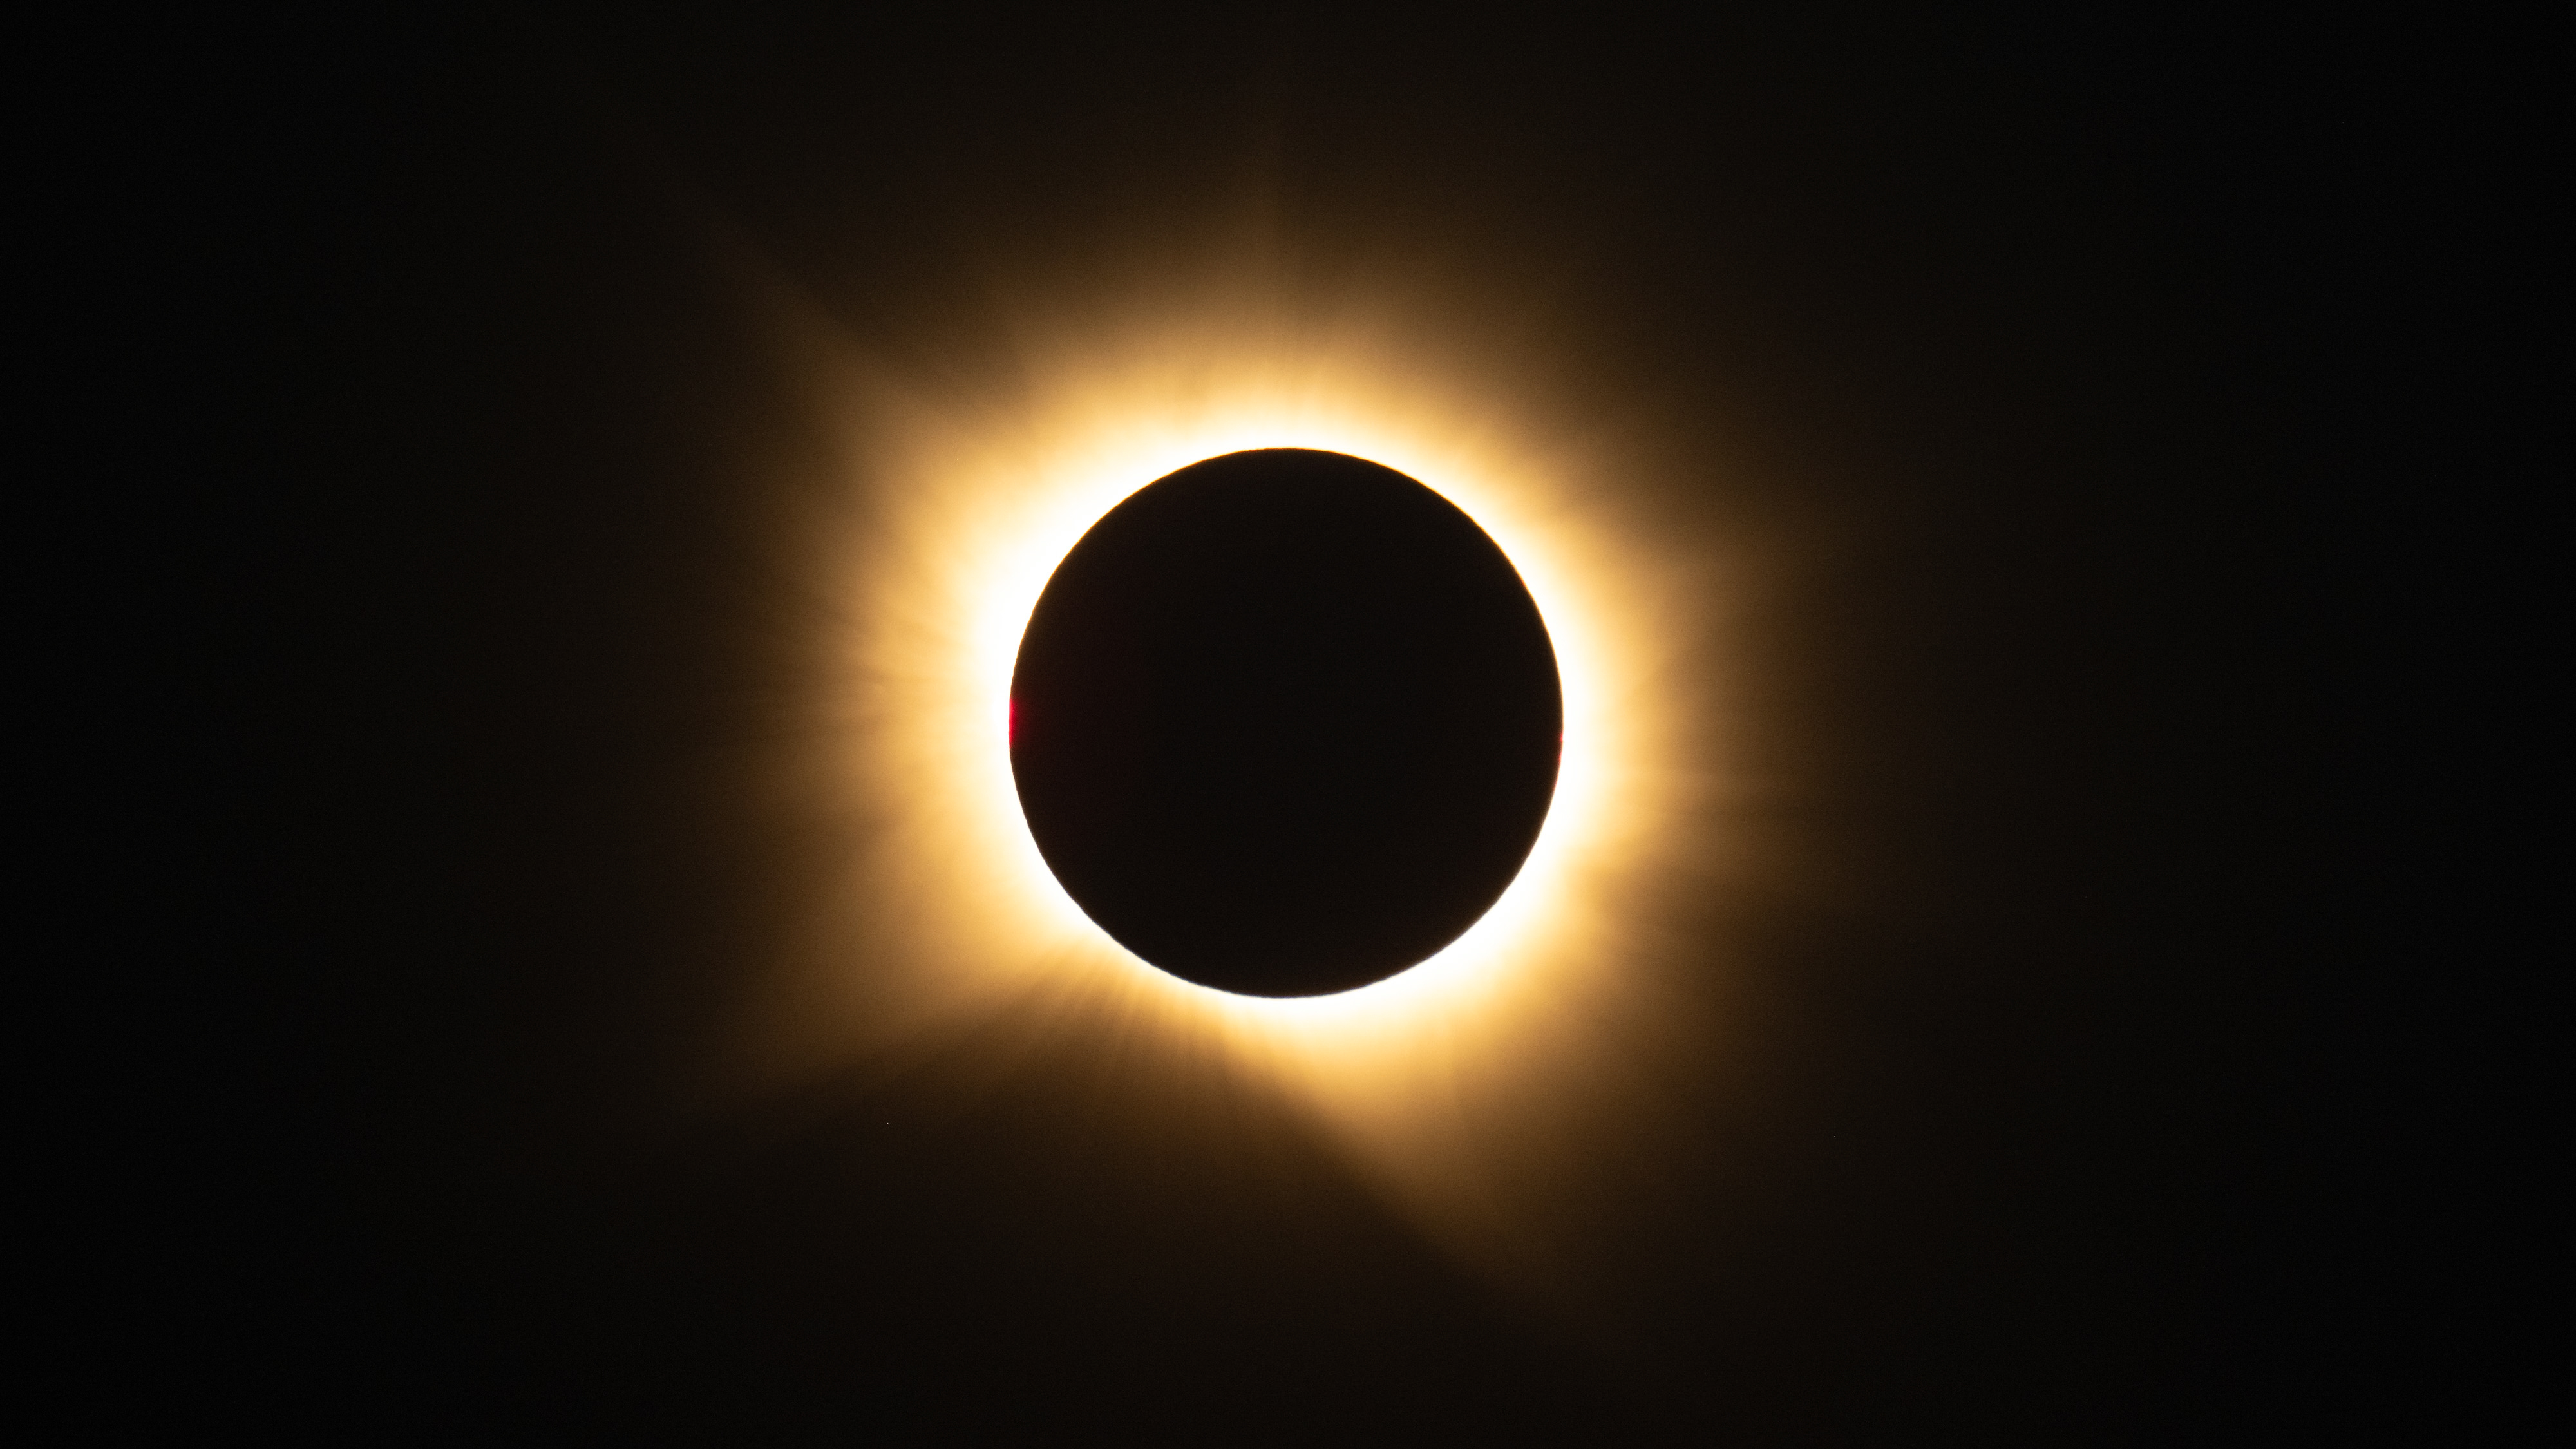
The light of the Sun makes a fiery yellow halo around the Moon during a total solar eclipse. There is a hint of red at the 9 o'clock position on the Moon's edge.
NASA/Bill Ingalls

A total solar eclipse is seen from San Millán de los Caballeros, Spain, Wednesday, Aug. 12, 2026. A total solar eclipse – the Moon passing between the Sun and Earth, completely blocking the face of the Sun – swept across parts of Greenland, Iceland, northern Russia, the Atlantic Ocean, Spain, and a small corner of Portugal. A partial eclipse was visible in parts of the U.S., most of Canada, much of Europe, and northwest Africa.

Relive the eclipse on NASA’s YouTube channel.

Image credit: NASA/Bill Ingalls

NASA’s PUNCH Sharpens Solar Storm Forecasting in First Test

Using continuous imagery from NASA’s PUNCH (Polarimeter to Unify the Corona and Heliosphere) mission, scientists predicted the near-Earth arrival of a solar eruption to within 30 minutes in an initial proof of concept test. The results, presented Tuesday at the Committee on Space Research Scientific Meeting and under review at the journal Space Weather, could revolutionize the way Earth-impacting storms are forecasted.

“We thought PUNCH would be good at this, but it’s a stunning result,” said Craig DeForest, principal investigator for PUNCH at Southwest Research Institute’s Solar System Science and Exploration Division in Boulder, Colorado. “To put it in perspective, this could be the space weather equivalent of going from a steam engine to a modern internal combustion engine.”

Solar storms are caused by huge explosions of material off the Sun called coronal mass ejections. Forecasting when the ejections will reach Earth is key for mitigating their impacts on power grids, satellites, and astronauts. However, until recently, coronal mass ejections could not continuously be tracked for much of their journey across the solar system.

That changed in 2025 with the launch of the PUNCH mission, which uses four spacecraft in low Earth orbit to make continuous 3D observations of the inner solar system. Before PUNCH, coronal mass ejections could only be seen as they traversed one-fifth the way from the Sun to Earth, leaving scientists to guess what happened over the rest of the distance. With PUNCH’s wider field-of-view, scientists can now routinely track the solar explosions nearly all the way to Earth, capturing a new image every four minutes.

This video created from PUNCH images shows the May 31, 2025 coronal mass ejection (CME) streaming out from the Sun. The yellow line shows the leading edge of the CME. By tracking a CME across the inner solar system, scientists are now able to predict when a solar storm will reach Earth better than ever before.
NASA/PUNCH/SwRI

Scientists used data from a coronal mass ejection that left the Sun on May 31, 2025, to retroactively test if they could improve forecast modeling. Scientists input the images into a computer model, which analyzed the leading edge of the coronal mass ejection over time. As it moved and evolved across the inner solar system, the model used the coronal mass ejection’s speed and geometry to calculate when it would reach Earth.

Twelve hours after the coronal mass ejection left the Sun, the model settled on a final prediction showing the storm would arrive eight hours later. That predicted arrival time was ultimately accurate to within a half hour, making it 10 times better than currently used methods, which only provide a 5-hour window. In addition, the model itself revealed when the estimate had stabilized, so that a space weather forecaster would be able to predict the arrival time with confidence.

“We accomplished an order of magnitude better result than the state-of-the-art method with a really basic process, just informed by the fact that the coronal mass ejection could be tracked continuously across the solar system,” DeForest said.

These first results demonstrate the power of PUNCH’s wide-field imagery to track the solar events as they travel out from the Sun. Ultimately, the scientists think that with more refined PUNCH data and better models, they could be able to forecast coronal mass ejection arrival times even further in advance.

Beyond space weather forecasting, the images also help scientists glean new insights on coronal mass ejections. The high-resolution images allowed the scientists to see new structures in coronal mass ejections, revealing that the clouds of material are clumpier than previously thought and continue to evolve as they cross the solar system.

The PUNCH data is also helping scientists better understand how plasma, the solar material launched by coronal mass ejections, moves across space. This information can help astrophysicists better understand plasma’s behavior across the galaxy, such as in star-forming regions where it is nearly impossible to study on small scales.

Southwest Research Institute, based in San Antonio, leads the PUNCH mission and operates the mission’s four spacecraft from its facilities in Boulder. The mission is managed by Space Science Mission Operations at NASA’s Goddard Space Flight Center in Greenbelt, Maryland, for the Science Mission Directorate at the agency’s headquarters in Washington.

By Mara Johnson-Groh
NASA’s Goddard Space Flight Center, Greenbelt, Md.

❌