❌

Reading view

There are new articles available, click to refresh the page.

The Land of the Standing-Up Rocks

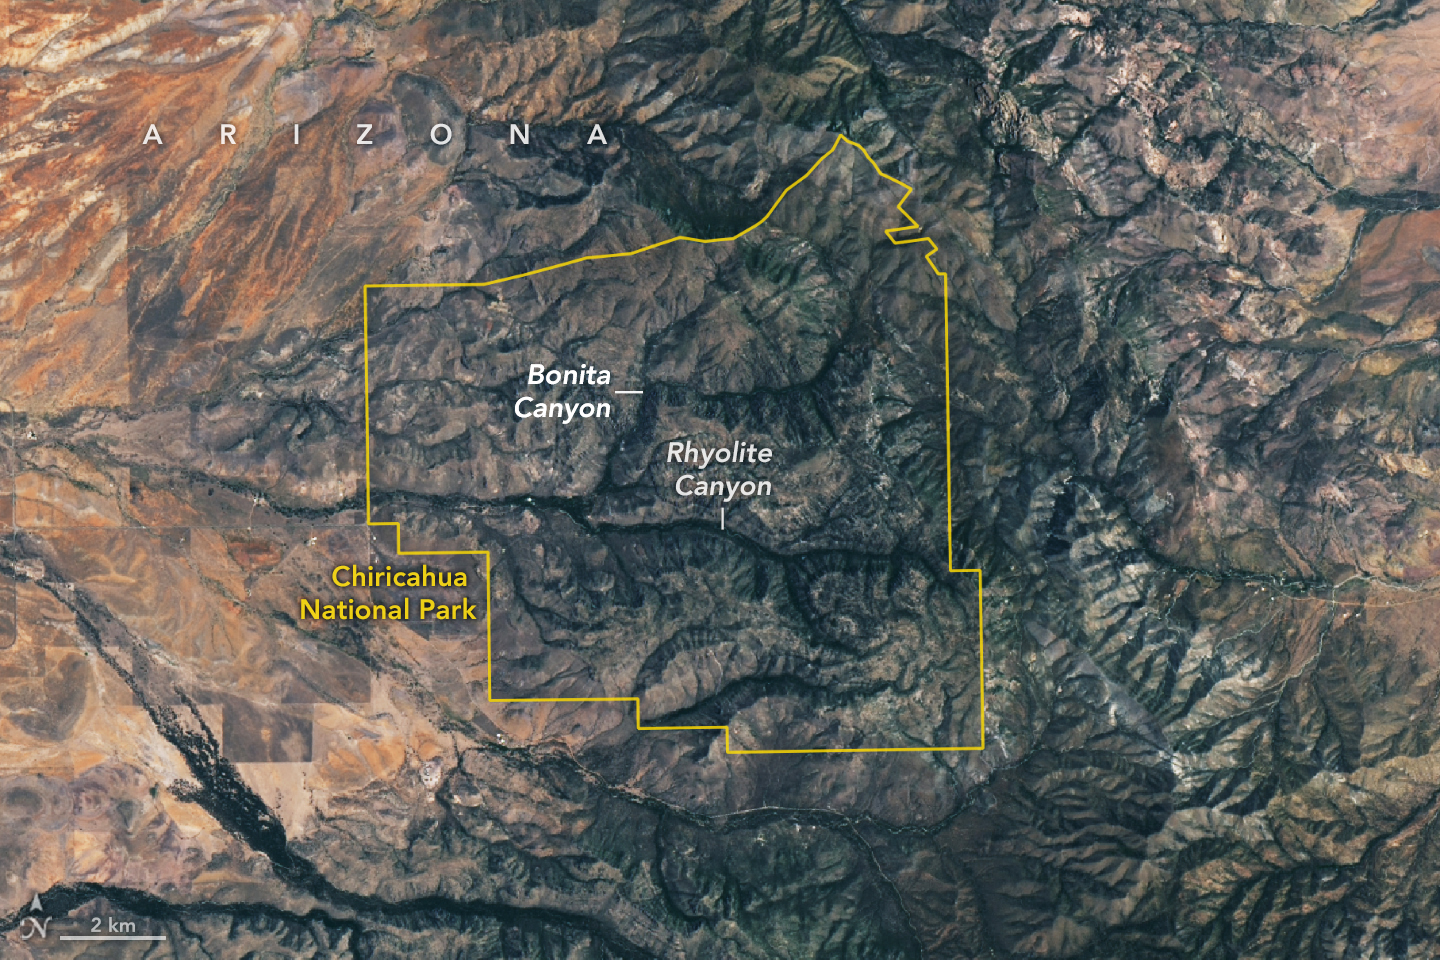
A satellite image shows Chiricahua National Park outlined in yellow amid mountainous terrain. Within the park, gray ridges are cut by green, vegetated canyons, two of which are labeled Bonita Canyon and Rhyolite Canyon. To the west, the land is flatter and redder with less vegetation.

Some 27 million years ago, a volcano in what’s now southeastern Arizona unleashed a spectacular series of eruptions, strewing more than 1,000 times as much volcanic material across the landscape as Mount St. Helens did in 1980.

The explosive eruptions blanketed the region, part of the Chiricahua Apache Nation’s traditional lands, with ash and pumice. Layered into this were massive pyroclastic flows that hardened into deposits of welded rhyolitic tuff that in some areas were nearly 1,600 feet (500 meters) thick, about three times the height of the Washington Monument. As the magma chamber emptied, the ground above it collapsed, leaving a gaping depression—the Turkey Creek caldera—that was roughly 12 miles (19 kilometers) wide and 4,900 feet (1,500 meters) deep.

An array of geologic processes, including erosion and weathering, gradually sculpted the welded layer of tuff into the collection of dramatic spires, hoodoos, and canyons that visitors to the caldera area encounter today.

The Apache called the area “The Land of the Standing-Up Rocks” for good reason. Hiking through Rhyolite Canyon or driving through Bonita Canyon means encountering a dizzying maze of rock pinnacles, some hundreds of feet tall. Others, like Big Balanced Rock, have surprisingly large boulders precariously perched on top. Meanwhile, those at Heart of Rocks and Massai Point are gathered into groups of hundreds.

The area was designated a national monument in 1924 to preserve its remarkable geology. In October 2026, it was redesignated as Chiricahua National Park (pronounced cheery-cow-ah). The OLI (Operational Land Imager) on Landsat 9 captured this cloud-free image of the new national park on July 2, 2026.

Individual rock spires are too small to distinguish, but the eroding rhyolitic tuff landscape appears gray. Stream valleys dense with trees and other vegetation, including Rhyolite Canyon and Bonita Canyon, snake across the landscape. With four biogeographic regions converging in the park—the Sonoran Desert, the Chihuahuan Desert, the Rocky Mountains, and the Sierra Madre—it is a haven of plant diversity.

Among the 1,000 species growing within the park’s varied desert, grassland, chaparral, deciduous forest, and coniferous forest ecosystems are agaves, prickly pear cacti, yuccas, manzanita, pine, fir, cypress, sycamore, juniper, and oak. The park’s location within the Chiricahua Mountains puts it among several “sky islands” in Arizona—isolated mountain ranges that emerge from the surrounding desert “sea.” According to the National Park Service, the range’s highest point (outside the park) rises 2,986 meters (9,795 feet) above sea level, more than 1,800 meters above the surrounding valley.

NASA Earth Observatory image by Lauren Dauphin, using Landsat data from the U.S. Geological Survey. Story by Adam Voiland.

Downloads

A satellite image shows Chiricahua National Park outlined in yellow amid mountainous terrain. Within the park, gray ridges are cut by green, vegetated canyons, two of which are labeled Bonita Canyon and Rhyolite Canyon. To the west, the land is flatter and redder with less vegetation.

July 2, 2026

JPEG (6.09 MB)

References & Resources

You may also be interested in:

Stay up-to-date with the latest content from NASA as we explore the universe and discover more about our home planet.
The Forested Floodplains of Congaree National Park
4 min read

The meandering Congaree River sustains towering forest ecosystems and fashions oxbow lakes as it shifts across its floodplain.
Article
Minute Man National Historical Park
3 min read

Sites relevant to the start of the American Revolutionary War are interspersed throughout the modern-day Boston metropolitan region.
Article
Colonial National Historical Park
2 min read

The colonial communities of “America’s historic triangle” played defining roles in the road to American independence.

Article

Autumn Paints Poland’s Bieszczady Mountains

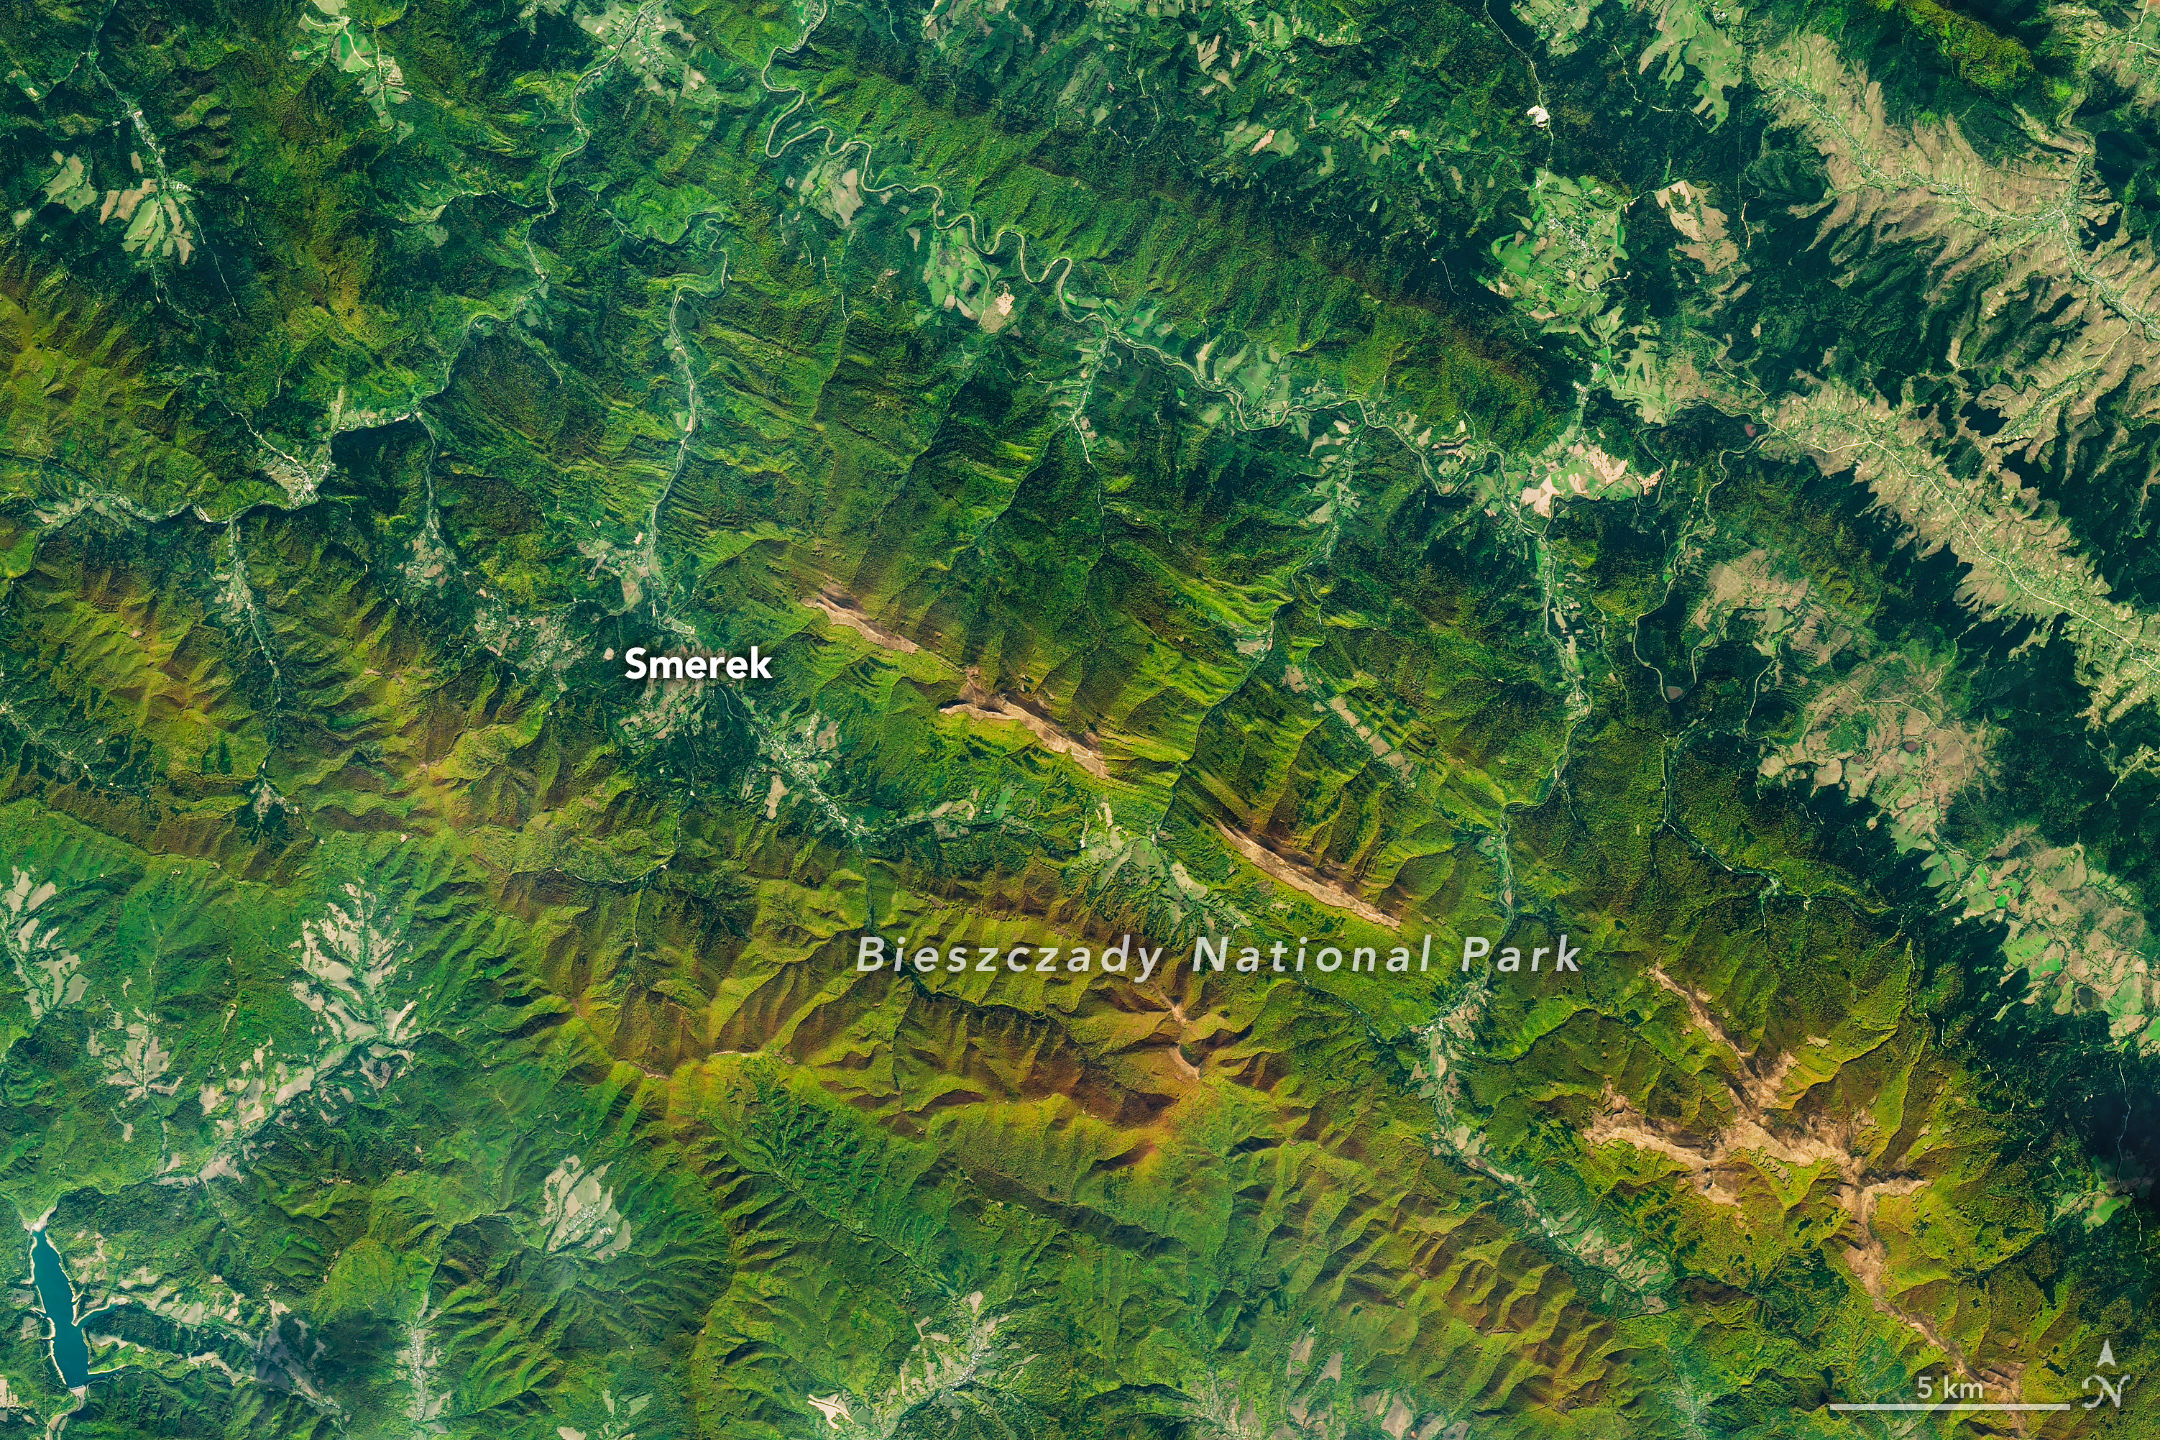
A satellite image of mountains in southeastern Poland in autumn. Green and orange forest covers parallel ridges running diagonally across the scene, and tan grasslands stretch along the highest crests.

As the air grows cooler and days shorter, brown bears prowl the Carpathian Mountains of southern Poland with the goal of fattening up ahead of winter hibernation. In a more conspicuous sign of autumn, beech and other deciduous trees blanketing the hillsides start to sport reds and golds. The seasonal transformation was underway in southeast Poland’s Bieszczady National Park on October 8, 2026, when the OLI (Operational Land Imager) on the NASA-USGS Landsat 9 satellite captured this image.

European beech (Fagus sylvatica) dominates the area’s forests, with other species such as sycamore maple (Acer pseudoplatanus) also contributing to vibrant color in the fall. Dropping air temperatures and waning daylight cause these trees to curtail the production of chlorophyll, the molecule that plants use to synthesize food. Without it, the leaves’ green pigments fade, allowing the yellows and reds of other pigments to show through.

A descendent of ice-age survivors, the European beech has persisted across millennia in a range of climates. After the glaciers retreated, beech forests spread northward across the European continent from isolated refugia in the Carpathians, Alps, and other mountain ranges, and played a crucial role in reforesting the previously ice-covered land. Portions of Bieszczady National Park are included within UNESCO’s network of ancient and primeval beech forests spanning 18 countries.

Expansive as their footprint across Europe may be, beech forests reach only so high in elevation—about 1,000 to 1,260 meters (3,300 to 4,100 feet)—in this area. Above that is the realm of the polonina, a Slavic term for subalpine meadow, consisting of open grasslands and shrubby thickets of rowan (mountain ash), willows, and green alder. Patches of polonina stretch across ridge tops to the east-southeast of Smerek and appear tan, having lost their summer greenness.

The Bieszczady Mountains are renowned not only for forests and mountain meadows but also for charismatic wildlife. European bison, once extinct in the wild, were reintroduced to the area in the 1960s and now roam the hills by the hundreds, according to recent surveys. Additionally, populations of brown bears and Eurasian lynx find refuge and ample food sources in the forests.

NASA Earth Observatory image by Michala Garrison, using Landsat data from the U.S. Geological Survey. Story by Lindsey Doermann.

Downloads

A satellite image of mountains in southeastern Poland in autumn. Green and orange forest covers parallel ridges running diagonally across the scene, and tan grasslands stretch along the highest crests.

October 8, 2026

JPEG (16.00 MB)

References & Resources

You may also be interested in:

Stay up-to-date with the latest content from NASA as we explore the universe and discover more about our home planet.

The Forested Floodplains of Congaree National Park
4 min read

The meandering Congaree River sustains towering forest ecosystems and fashions oxbow lakes as it shifts across its floodplain.

Article
Minute Man National Historical Park
3 min read

Sites relevant to the start of the American Revolutionary War are interspersed throughout the modern-day Boston metropolitan region.

Article
Colonial National Historical Park
2 min read

The colonial communities of “America’s historic triangle” played defining roles in the road to American independence.

Article

Isaias Dims the Gulf Coast


August 2026 Composite
October 11, 2026

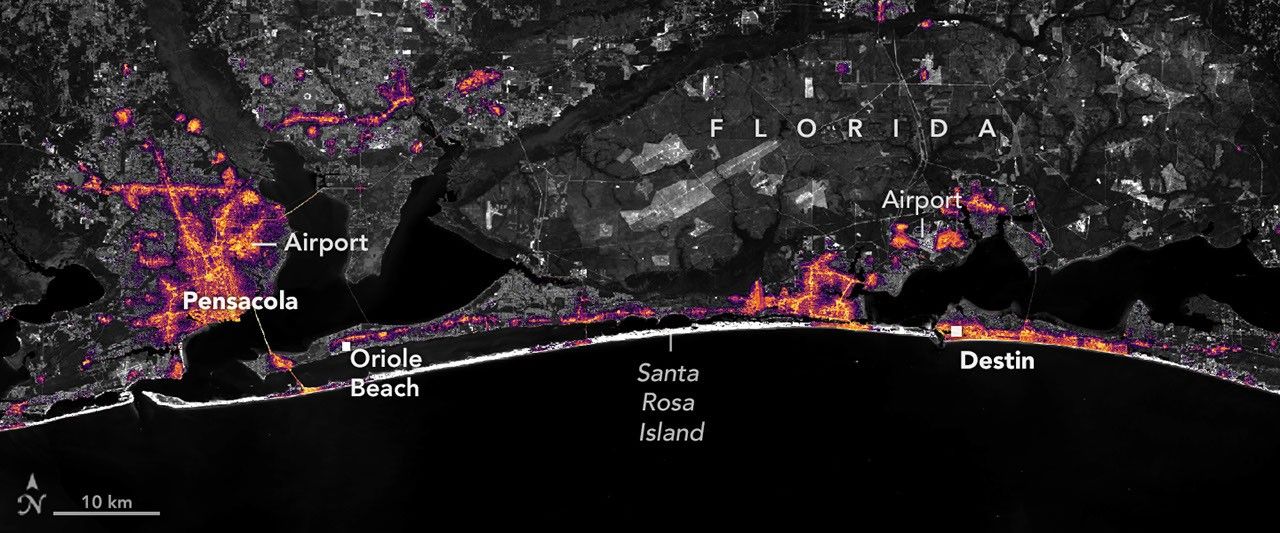
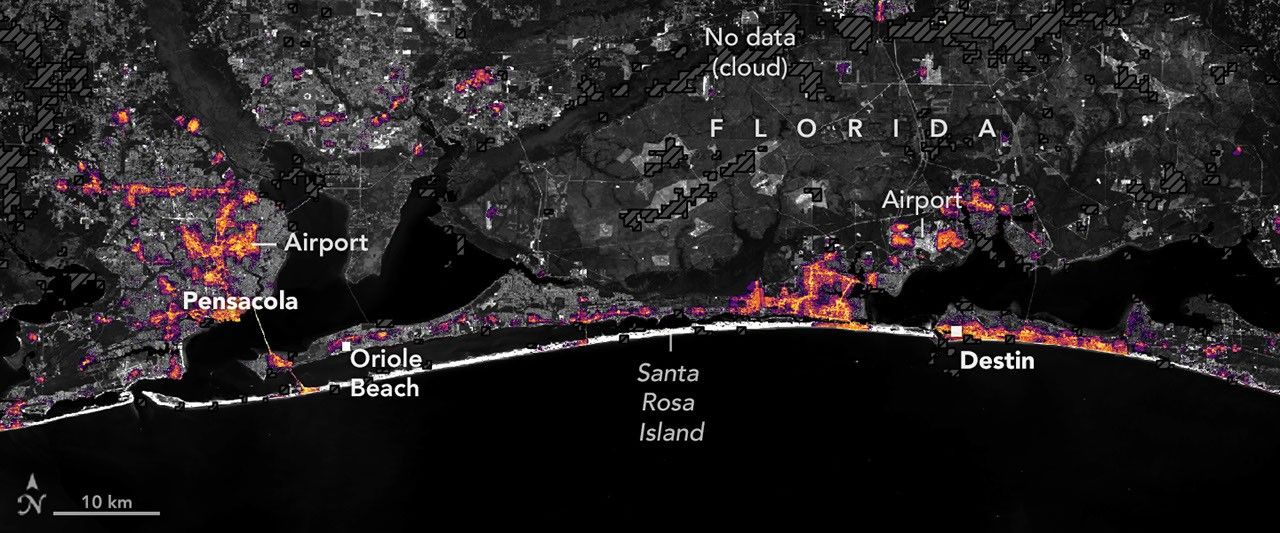
Nighttime lights along the Florida Panhandle coast in August 2026, brightest in Pensacola and Destin and along the road between them.
NASA Earth Observatory / Lauren Dauphin

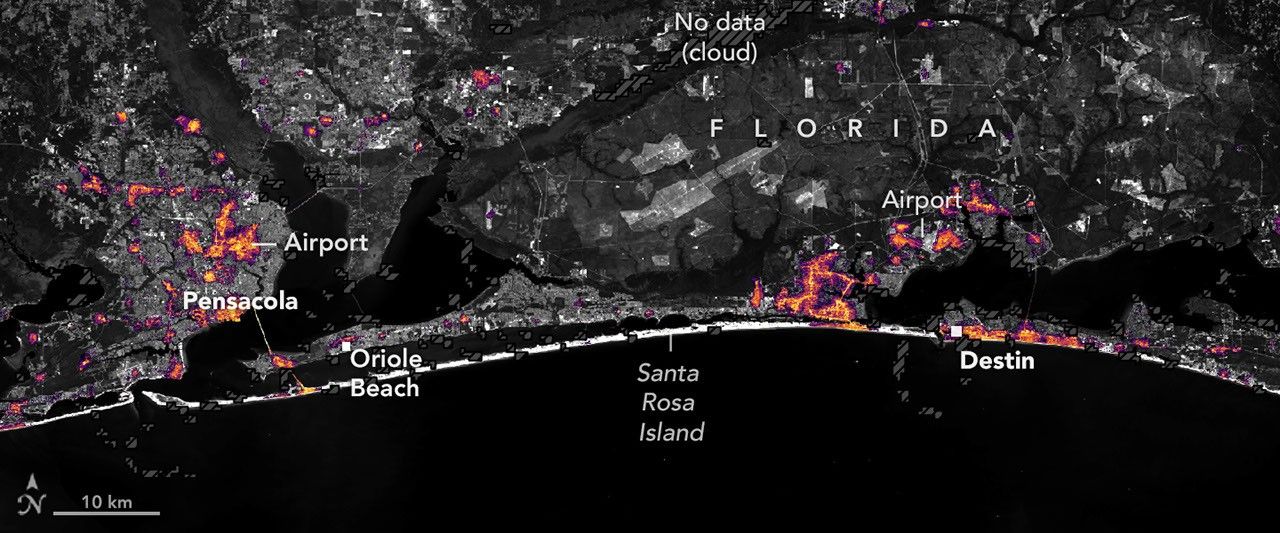
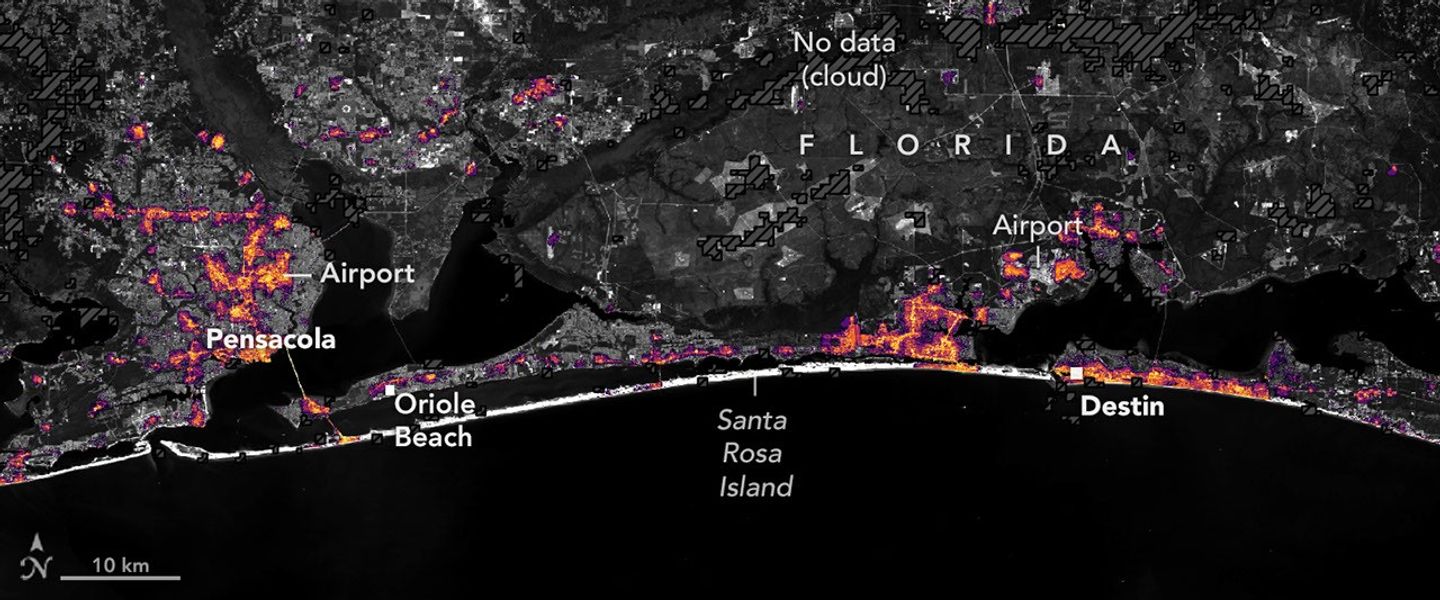
Nighttime lights along the Florida Panhandle coast on October 11, 2026, after Hurricane Isaias, with fewer and dimmer lights in Pensacola and Destin and gaps along the road between them.
NASA Earth Observatory / Lauren Dauphin

Nighttime lights along the Florida Panhandle coast in August 2026, brightest in Pensacola and Destin and along the road between them.
NASA Earth Observatory / Lauren Dauphin
Nighttime lights along the Florida Panhandle coast on October 11, 2026, after Hurricane Isaias, with fewer and dimmer lights in Pensacola and Destin and gaps along the road between them.
NASA Earth Observatory / Lauren Dauphin

August 2026 Composite

October 11, 2026


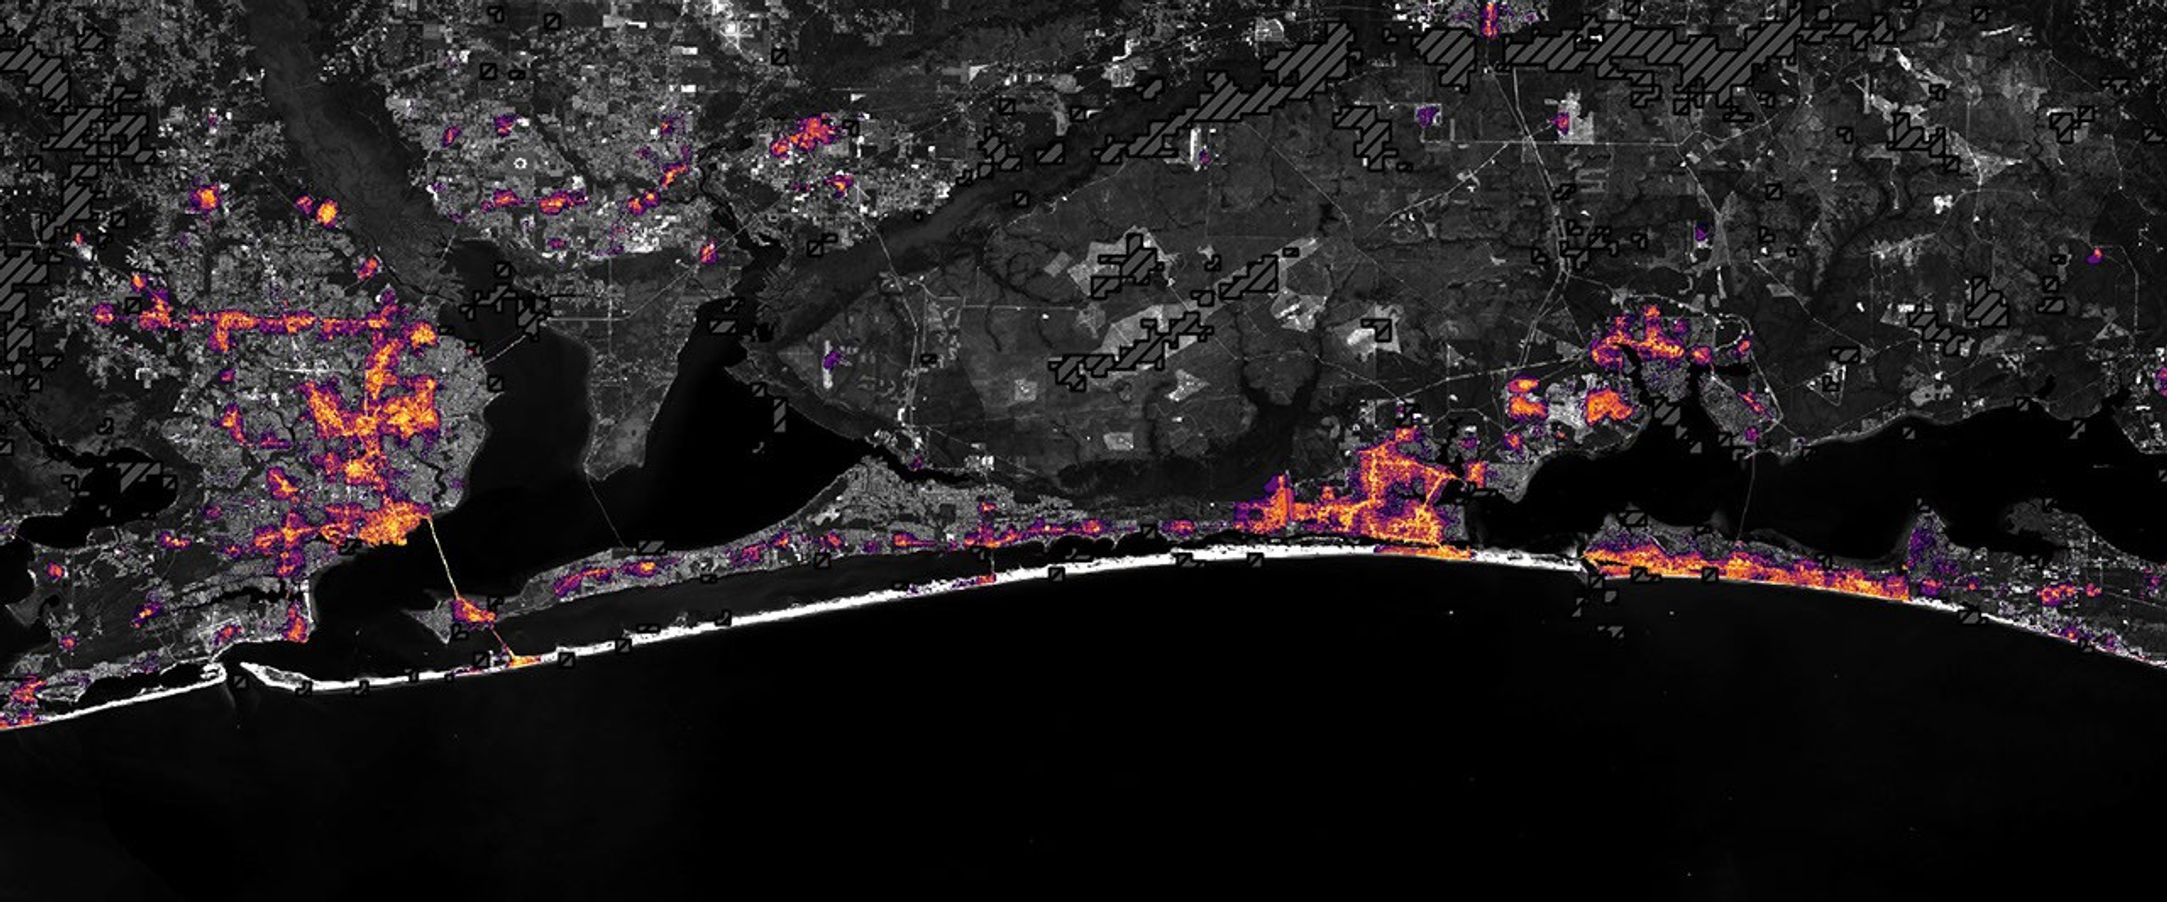
Lights around Pensacola, Florida, and along the U.S. Route 98 corridor toward Destin appear sharply reduced on October 11, 2026 (right), compared with typical conditions in August 2026 (left), suggesting widespread power outages after Hurricane Isaias. Images are from NASA’s Black Marble HD product.

After a quiet start to the 2026 Atlantic hurricane season, Isaias became the season’s first hurricane on October 8 as it tracked toward the U.S. Gulf Coast. The storm brought heavy rain and flash flooding to parts of the Southeast, including Alabama and the Florida Panhandle, and winds that toppled trees and downed power lines, leaving many people in the dark.

Isaias made landfall near Destin, Florida, on the evening of October 9 as a Category 2 hurricane with maximum sustained winds of 105 miles (170 kilometers) per hour. Gusts topped 100 miles per hour along a corridor west of the storm’s center, according to the National Weather Service, with preliminary reports showing a 117-mile-per-hour gust in Oriole Beach and a 102-mile-per-hour gust at Pensacola City Hall.

These areas of high winds overlapped a broader area west of the storm’s eye where satellite images showed substantial decreases in nighttime lights. The image pair above shows nighttime lights before and after the storm. The left image is a composite of August 2026 data representing typical conditions, and the right image shows lights on October 11, after most of the storm’s clouds had cleared.

The data depicted in the images, provided by Ranjay Shrestha of NASA’s Black Marble science team, come from the Black Marble HD product. The product uses data from the VIIRS (Visible Infrared Imaging Radiometer Suite) on the NOAA-20 satellite, which has a day-night band that detects light emitted and reflected at night. The team processed the data to account for changes in the landscape, the atmosphere, and phase of the Moon, and to filter out stray light that does not come from electric lights. Dark gray, hash-marked areas show where clouds prevented VIIRS from collecting data. The nighttime lights are shown over a base map from the Landsat 9 satellite.
“Standard Black Marble nighttime lights imagery, available through NASA Worldview, provides a broad picture of the storm’s immediate impacts,” Shrestha said. “Black Marble HD takes this a step further by allowing us to visualize these changes at a much finer spatial scale.”

At these finer scales, the images reveal lights decreasing sharply around parts of Pensacola, Florida, and along the U.S. Route 98 corridor toward Destin, suggesting widespread power disruptions. Shrestha also pointed out pockets where lights persisted, including Pensacola International Airport, Pensacola Christian College, and parts of downtown Pensacola. “These patterns could reflect backup power systems, differences in electrical infrastructure, or areas that maintained electricity during the storm, although the imagery alone cannot confirm the underlying reasons,” he said.


October 11, 2026
October 12, 2026

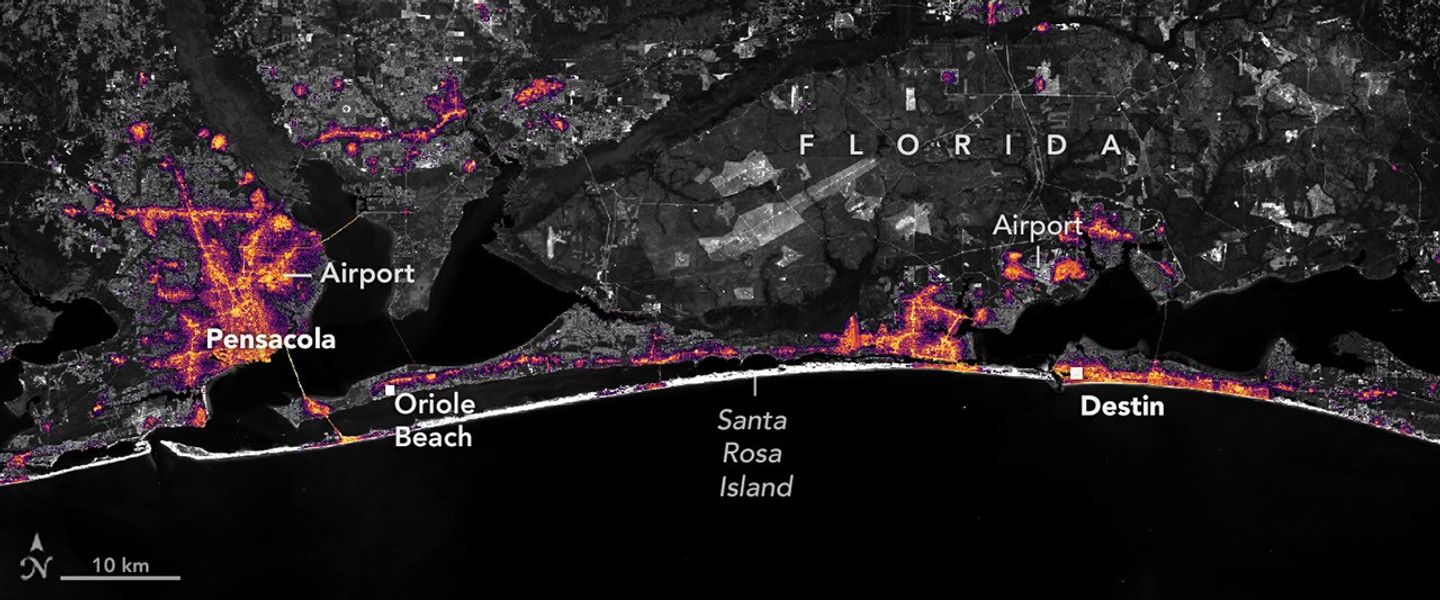
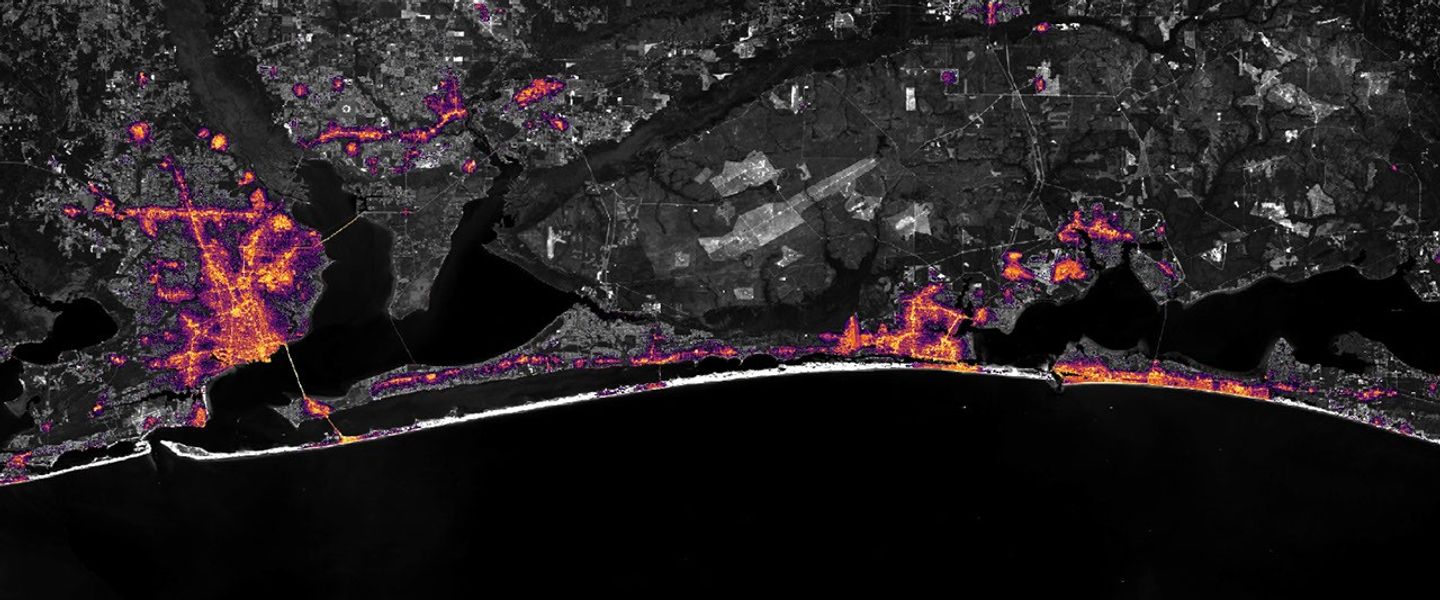
Nighttime lights along the Florida Panhandle coast on October 11, 2026, after Hurricane Isaias, with fewer and dimmer lights in Pensacola and Destin and gaps along the road between them.
NASA Earth Observatory / Lauren Dauphin

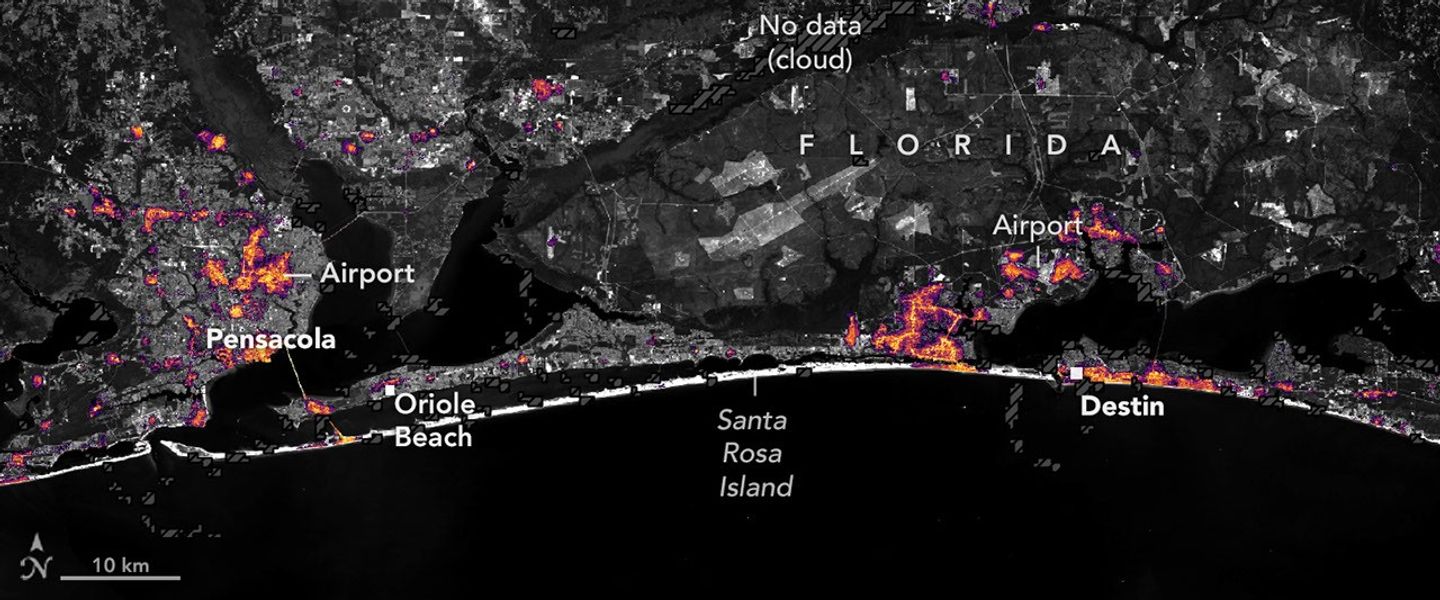
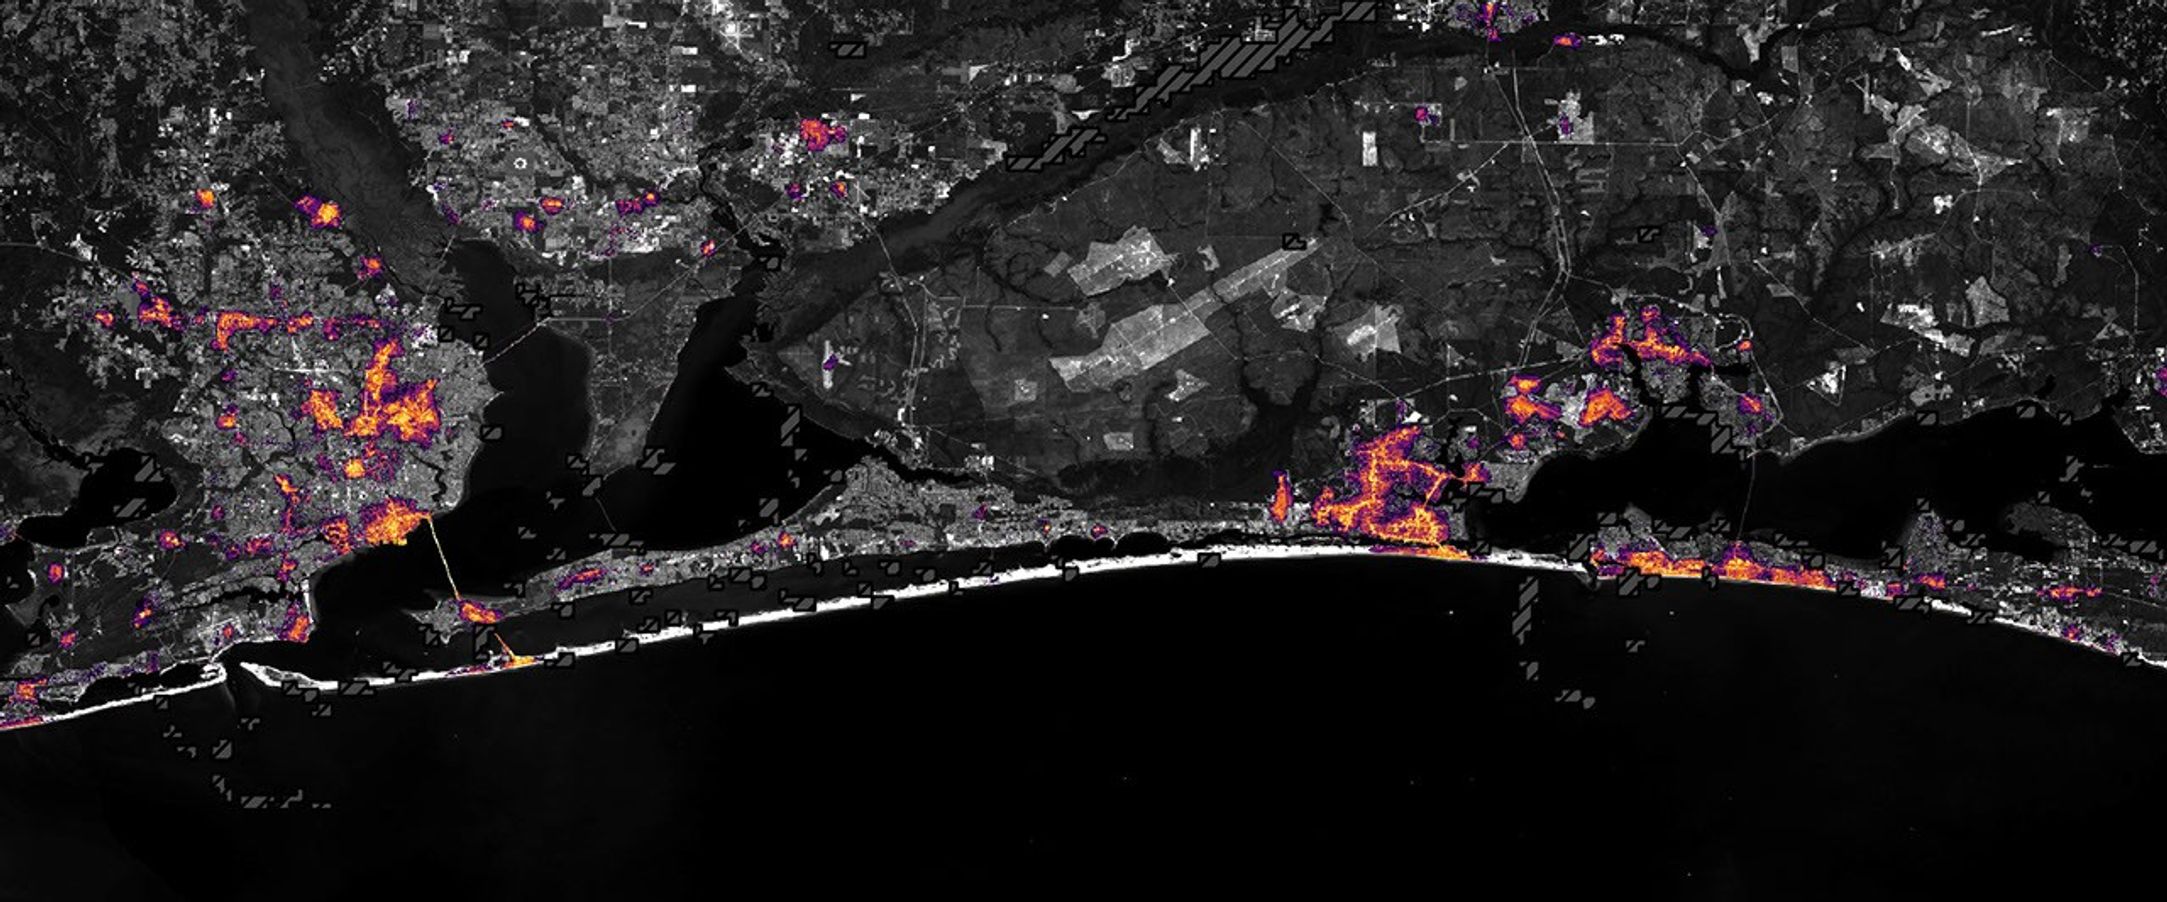
The same area on October 12, 2026, with lights in Pensacola and Destin and along the road between them closer to pre-storm levels.
NASA Earth Observatory / Lauren Dauphin

Nighttime lights along the Florida Panhandle coast on October 11, 2026, after Hurricane Isaias, with fewer and dimmer lights in Pensacola and Destin and gaps along the road between them.
NASA Earth Observatory / Lauren Dauphin
The same area on October 12, 2026, with lights in Pensacola and Destin and along the road between them closer to pre-storm levels.
NASA Earth Observatory / Lauren Dauphin

October 11, 2026

October 12, 2026


Widespread outages darken the region around Pensacola, Florida, and along the U.S. Route 98 corridor toward Destin on October 11, 2026 (left). By October 12 (right), lights have returned to some affected areas. Images are from NASA’s Black Marble HD product.

Black Marble HD images also reveal the pace and spatial patterns of recovery. The image pair above compares the same October 11 view (left) with one from October 12 (right), when lights had begun to return to some affected areas. By October 14, lighting patterns looked similar to pre-storm conditions.
 
“Understanding where recovery is progressing and where disruptions persist can help emergency responders and decision makers identify areas that may require additional attention, prioritize resources, and assess the effectiveness of restoration efforts,” Shrestha said.
 
Black Marble data complement ground-based outage reports rather than replace them, offering a more comprehensive view of disasters’ impacts and recovery. “Ultimately, this is where the value of Black Marble lies: turning nighttime Earth observations into actionable insights that support informed decisions and help bridge the gap between Earth science and action,” Shrestha said.
 
The NASA Disasters Program, in coordination with FEMA and the USGS Coastal Storms Team, is supporting the Alabama Red Cross and the Alabama Emergency Management Agency’s response to Hurricane Isaias. The team will be posting maps and data products on its open-access mapping portal as new information becomes available.
NASA Earth Observatory images by Lauren Dauphin, using Black Marble HD data courtesy of Ranjay Shrestha/NASA’s Goddard Space Flight Center and Landsat data from the U.S. Geological Survey. Story by Kathryn Hansen.
Downloads

Nighttime lights along the Florida Panhandle coast in August 2026, brightest in Pensacola and Destin and along the road between them.

August 2026 Composite

JPEG (558.38 KB)

Nighttime lights along the Florida Panhandle coast on October 11, 2026, after Hurricane Isaias, with fewer and dimmer lights in Pensacola and Destin and gaps along the road between them.

October 11, 2026

JPEG (1.10 MB)

The same area on October 12, 2026, with lights in Pensacola and Destin and along the road between them closer to pre-storm levels.

October 12, 2026

JPEG (1.14 MB)

References & Resources

You may also be interested in:

Stay up-to-date with the latest content from NASA as we explore the universe and discover more about our home planet.

Tropical Storm Arthur

2 min read

The first named storm of the 2026 Atlantic hurricane season brought intense rainfall and the threat of flash flooding to…

Article

Hurricane Simon Lurks Off the Mexican Coast

3 min read

Though it remained offshore, the storm lashed coastal areas with high winds and flooding—and produced remarkable rippling patterns in the…

Article

Powerful Storms Continue to Prowl the Pacific

4 min read

Hurricanes Polo and Nolo sent destructive effects ashore amid an active season in the northeastern and central Pacific.

Article

An Impact Structure With Legs

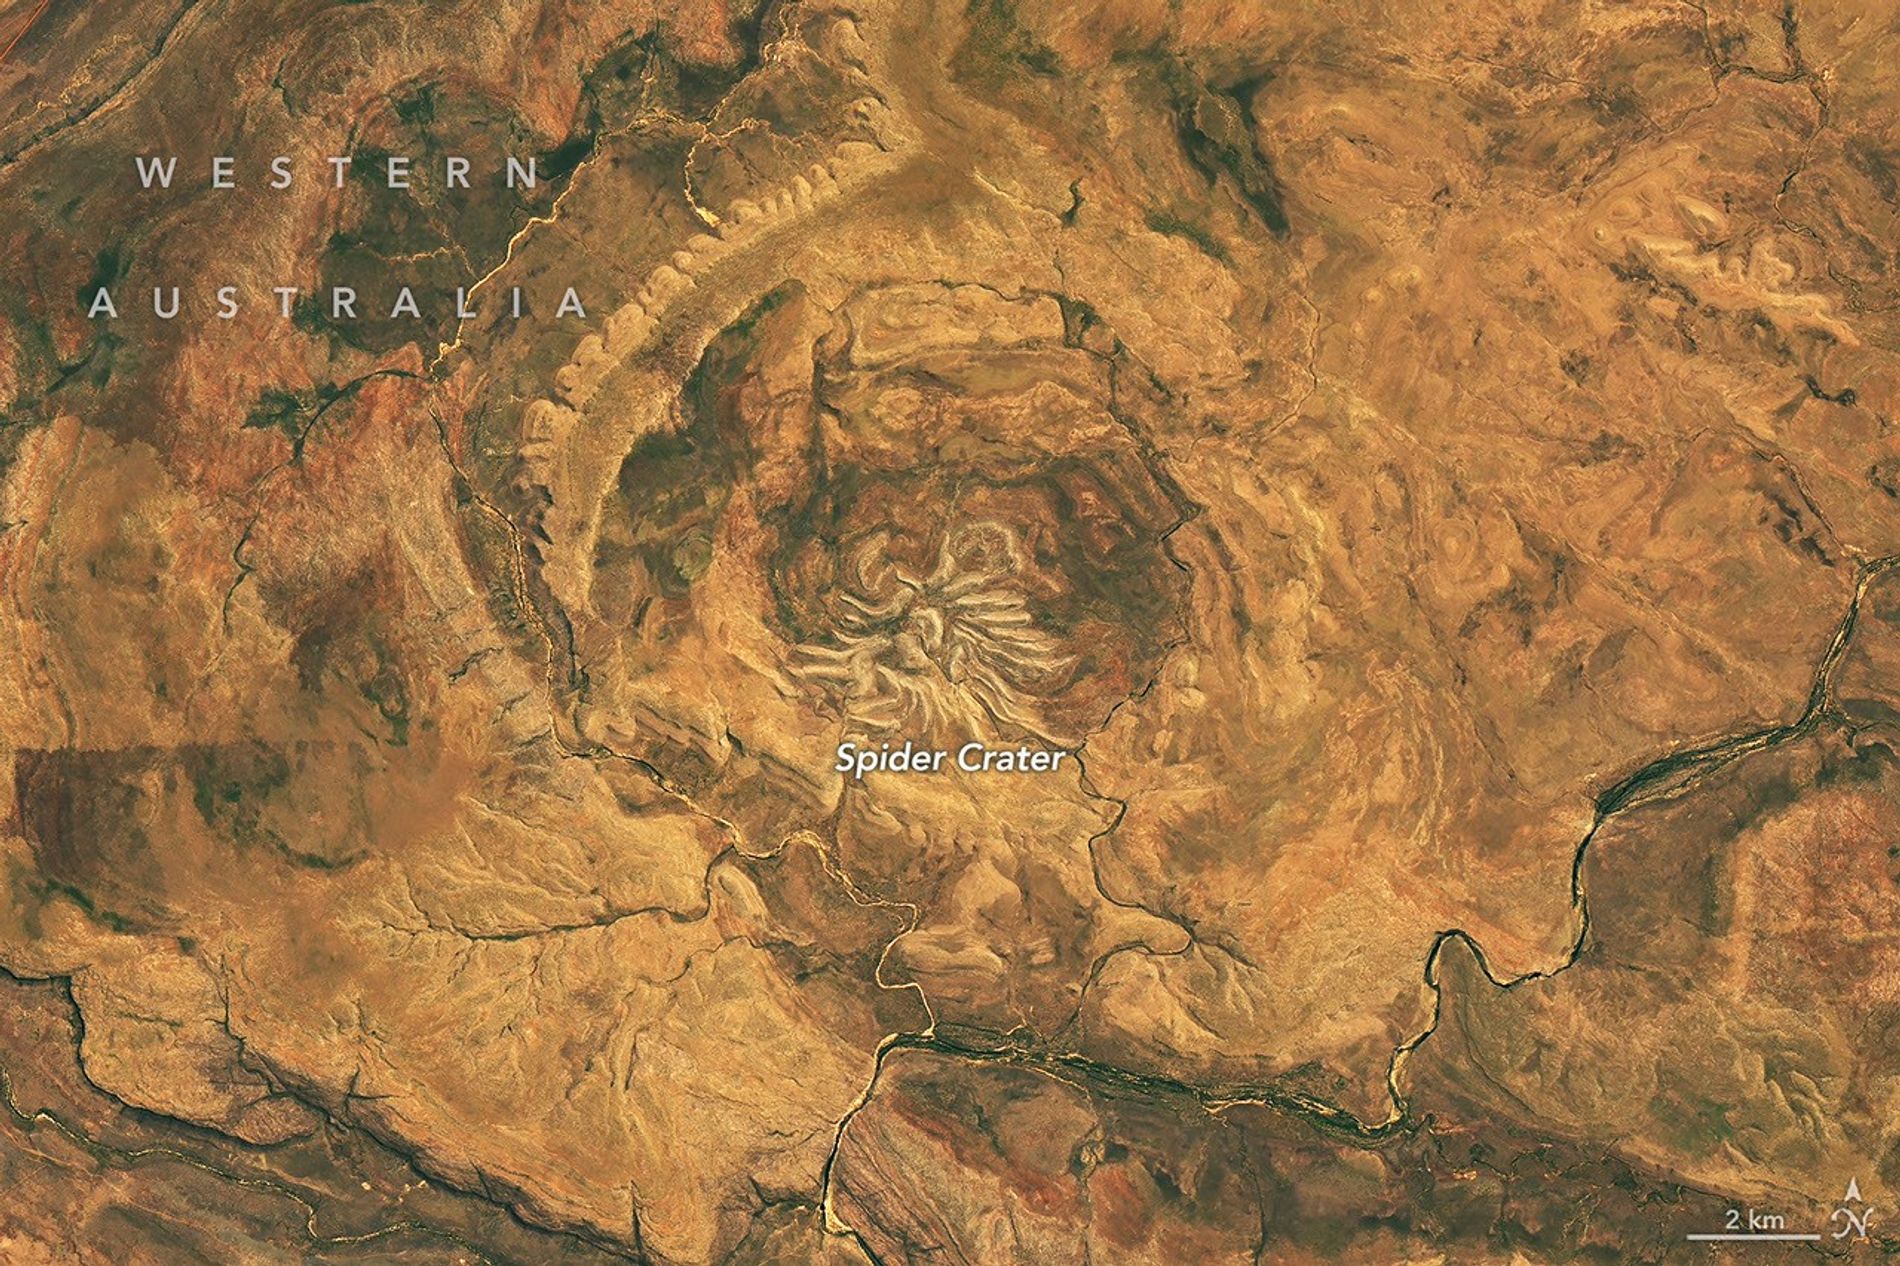
Several short, light-colored rocky ridges radiate out from a central point amid an orange and tan desert landscape.

Editor’s Note: Today’s story is the answer to the October Puzzler.

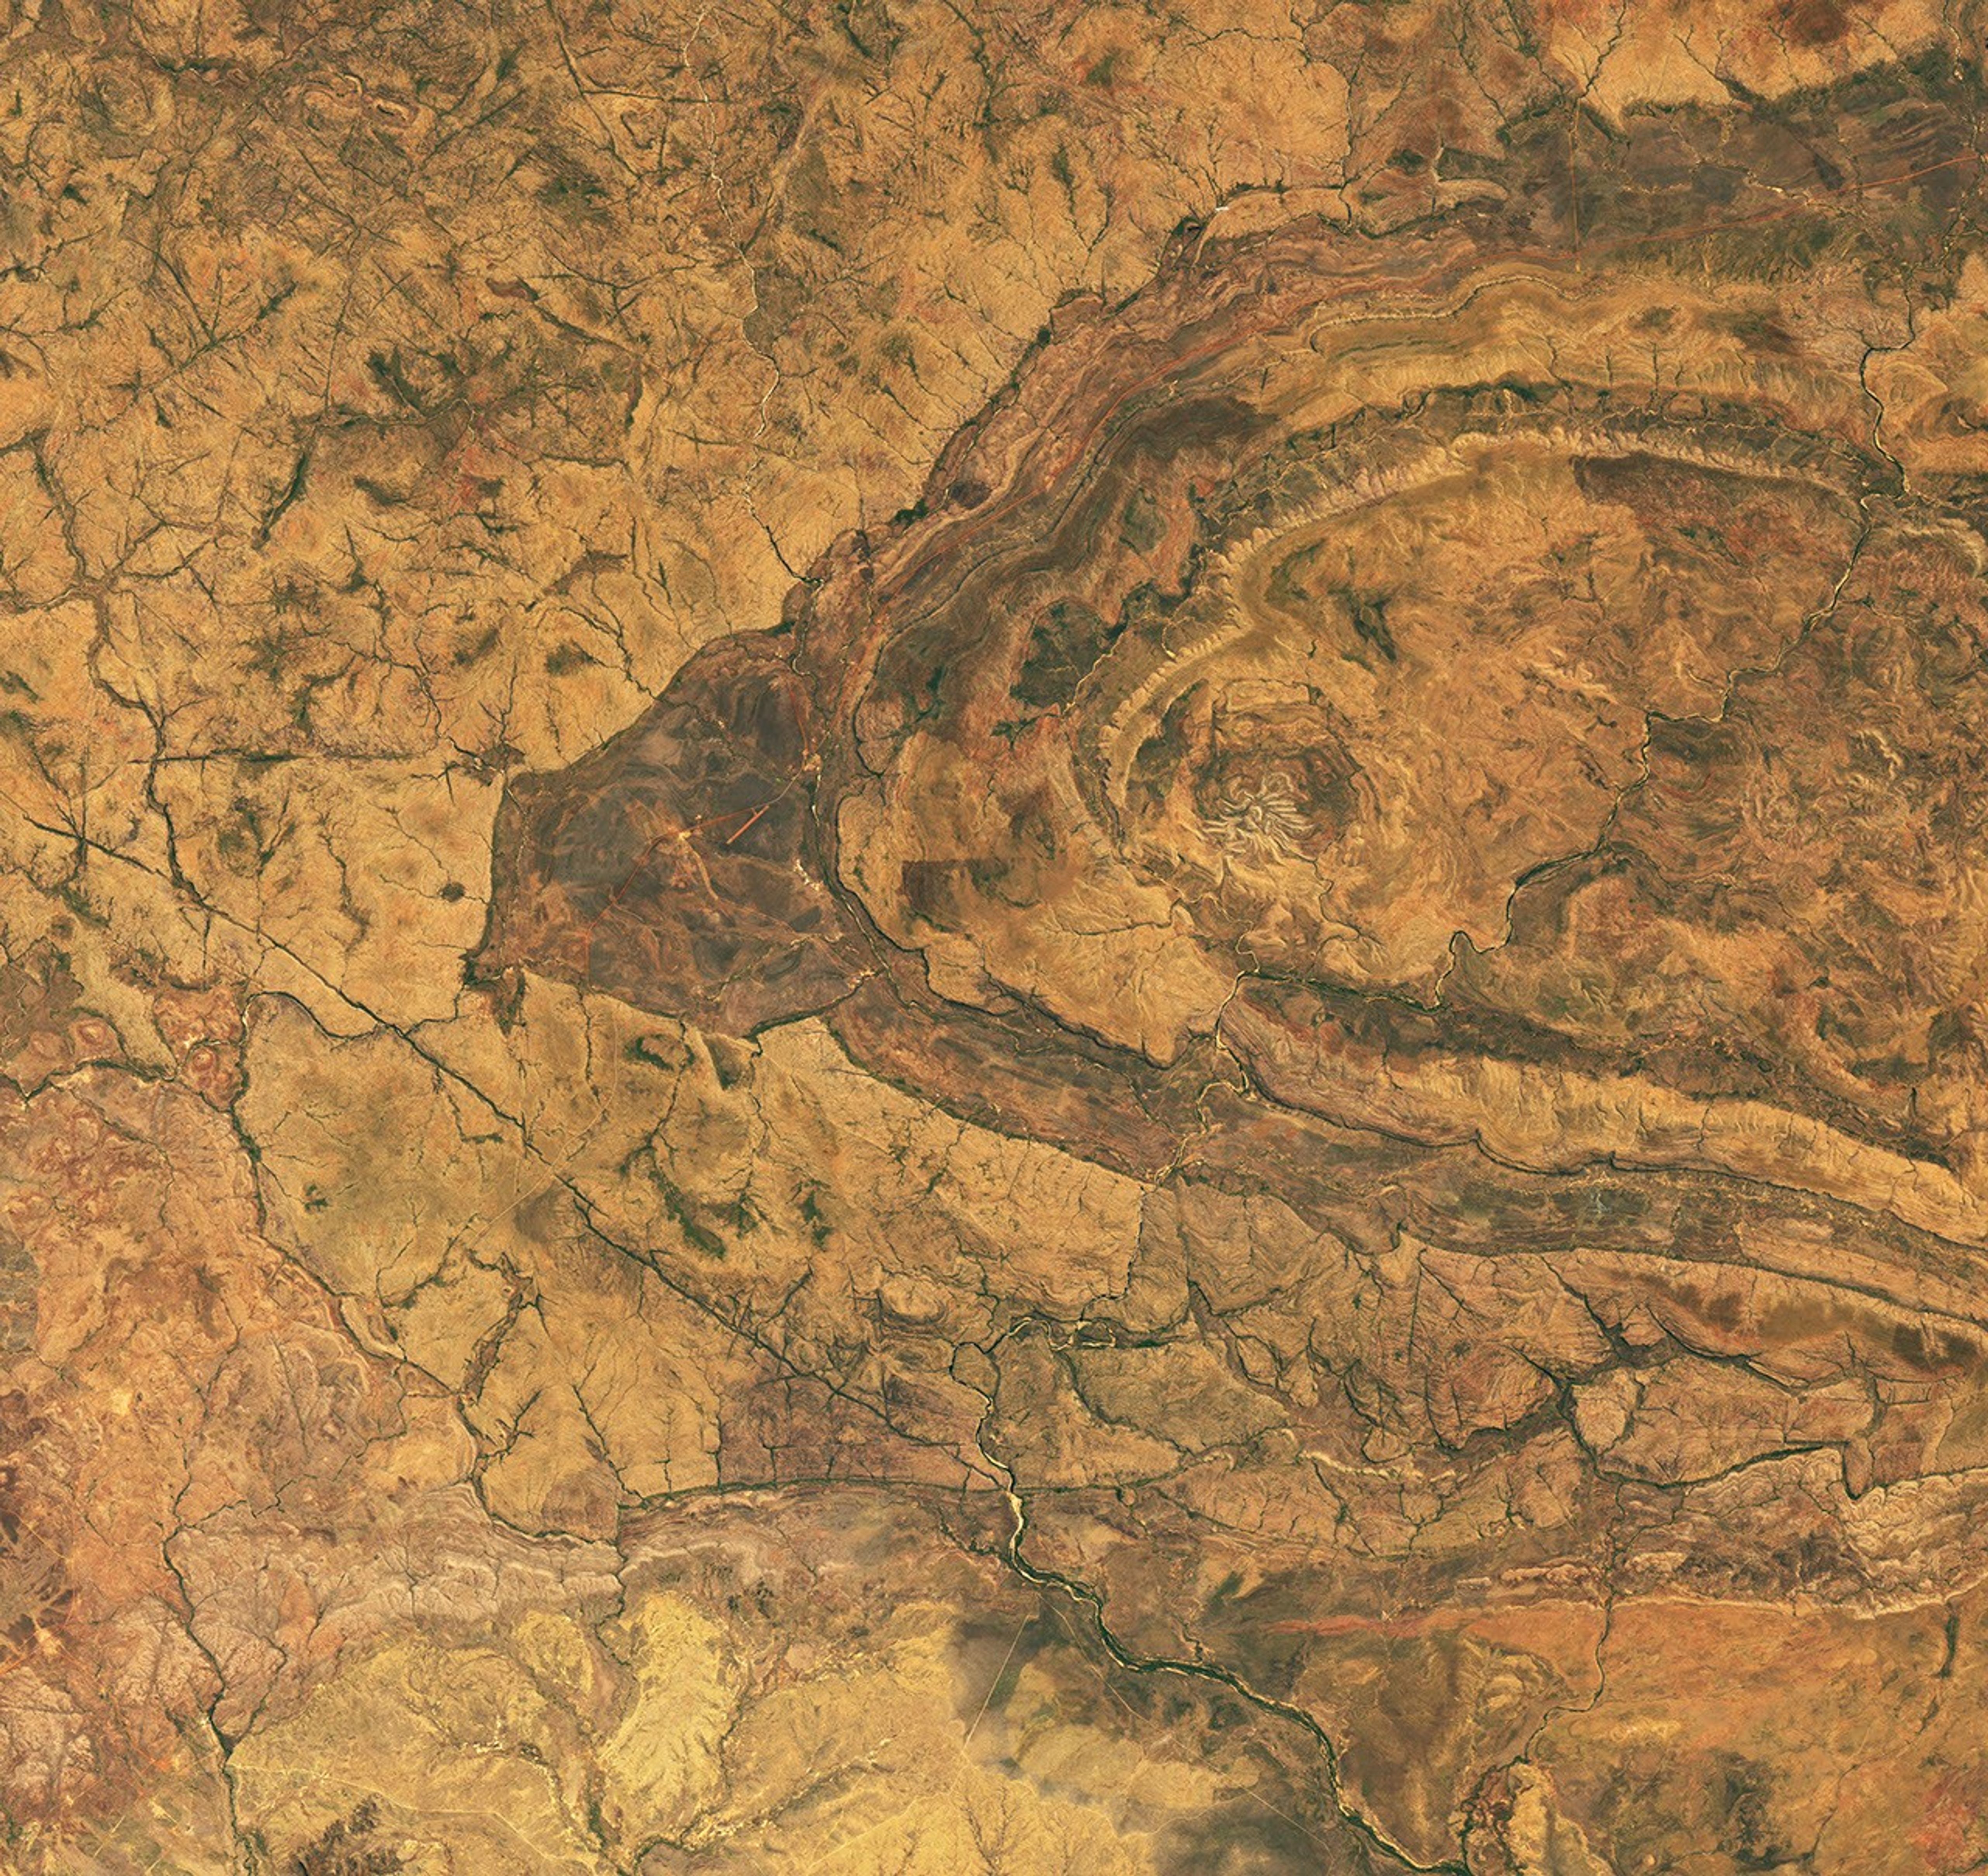
From above, the mere appearance of a curious geologic feature in Western Australia is enough to cause a fright. The aptly named Spider Crater, the product of a meteorite impact followed by hundreds of millions of years of erosion, sprawls across the landscape in the country’s Kimberley region.

The OLI (Operational Land Imager) on the NASA-USGS Landsat 9 satellite captured this image of the crater on September 20, 2026. The full impact structure has an oval shape measuring about 13 kilometers by 11 kilometers (8 miles by 7 miles), with the spiderlike central portion measuring about 4 kilometers (2.5 miles) across.

Geologists believe the unusual arachnoid pattern is the remnant of a central uplift, the raised portion of the crater floor that formed in the rebound of the initial impact shock. The light-colored “legs” are sandstone ridges that have endured while other rock layers in the impact zone have eroded away.

For decades after the feature’s discovery, scientists struggled to weave a tale about its formation. Some proposed it had a volcanic past. But with some legwork in the field, geologists identified telltale signs of a past impact: fan-shaped fractures called shatter cones. These fractures form only when intense shock waves travel through rock, and they are ubiquitous in Spider Crater’s central dome.

Scientists have subsequently performed lab analyses of shocked quartz and zircon crystals from the sandstone, which can help them reconstruct the angle of the meteorite’s impact. The date of the impact is uncertain, but estimates based on rocks in the region place it between about 900 million and 600 million years ago—making Spider Crater a creature of the late Precambrian.

NASA Earth Observatory image by Michala Garrison, using Landsat data from the U.S. Geological Survey. Story by Lindsey Doermann.

Downloads

Several short, light-colored rocky ridges radiate out from a central point amid an orange and tan desert landscape.

September 20, 2026

JPEG (23.76 MB)

References & Resources

You may also be interested in:

Stay up-to-date with the latest content from NASA as we explore the universe and discover more about our home planet.

An Accidental Impact Crater Discovery 
5 min read

An amateur astronomer scouting online satellite maps for campsites in Quebec found an impact crater instead.

Article
Boom Year for Desert Blooms
3 min read

Carpets of wildflowers burst from arid, ochre-colored land in Western Australia following winter rains.

Article
Moon-Like Madagascar
3 min read

A bright lens of anorthosite, a rock type prevalent on the lunar surface, is cradled within sheared rocks in the…

Article

Floodwaters Overwhelm Thailand


October 7, 2025
October 2, 2026

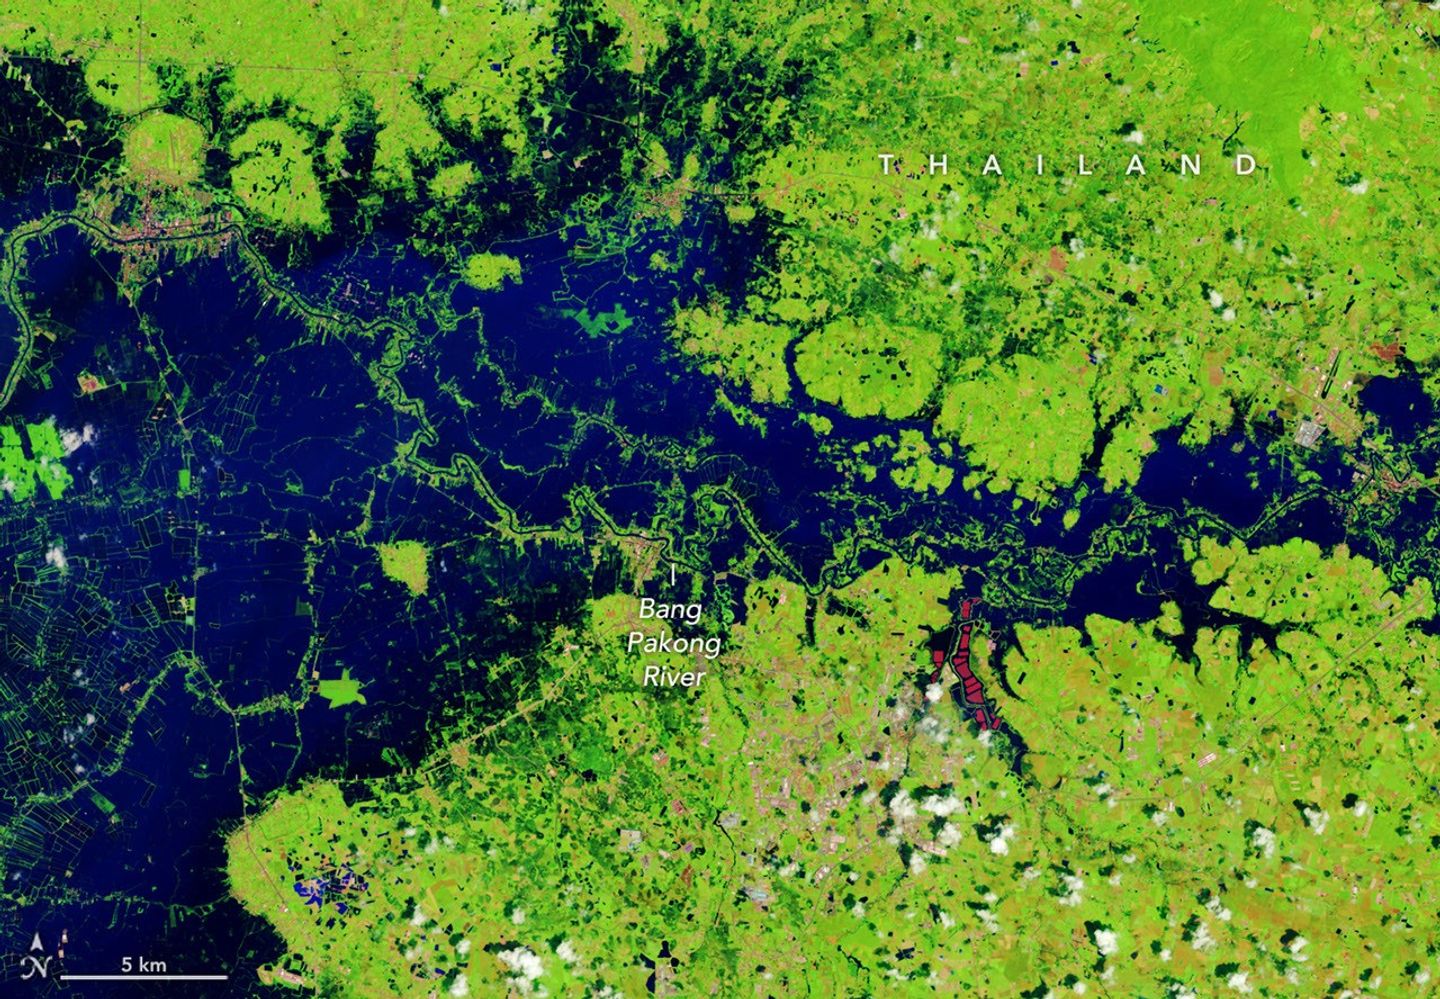
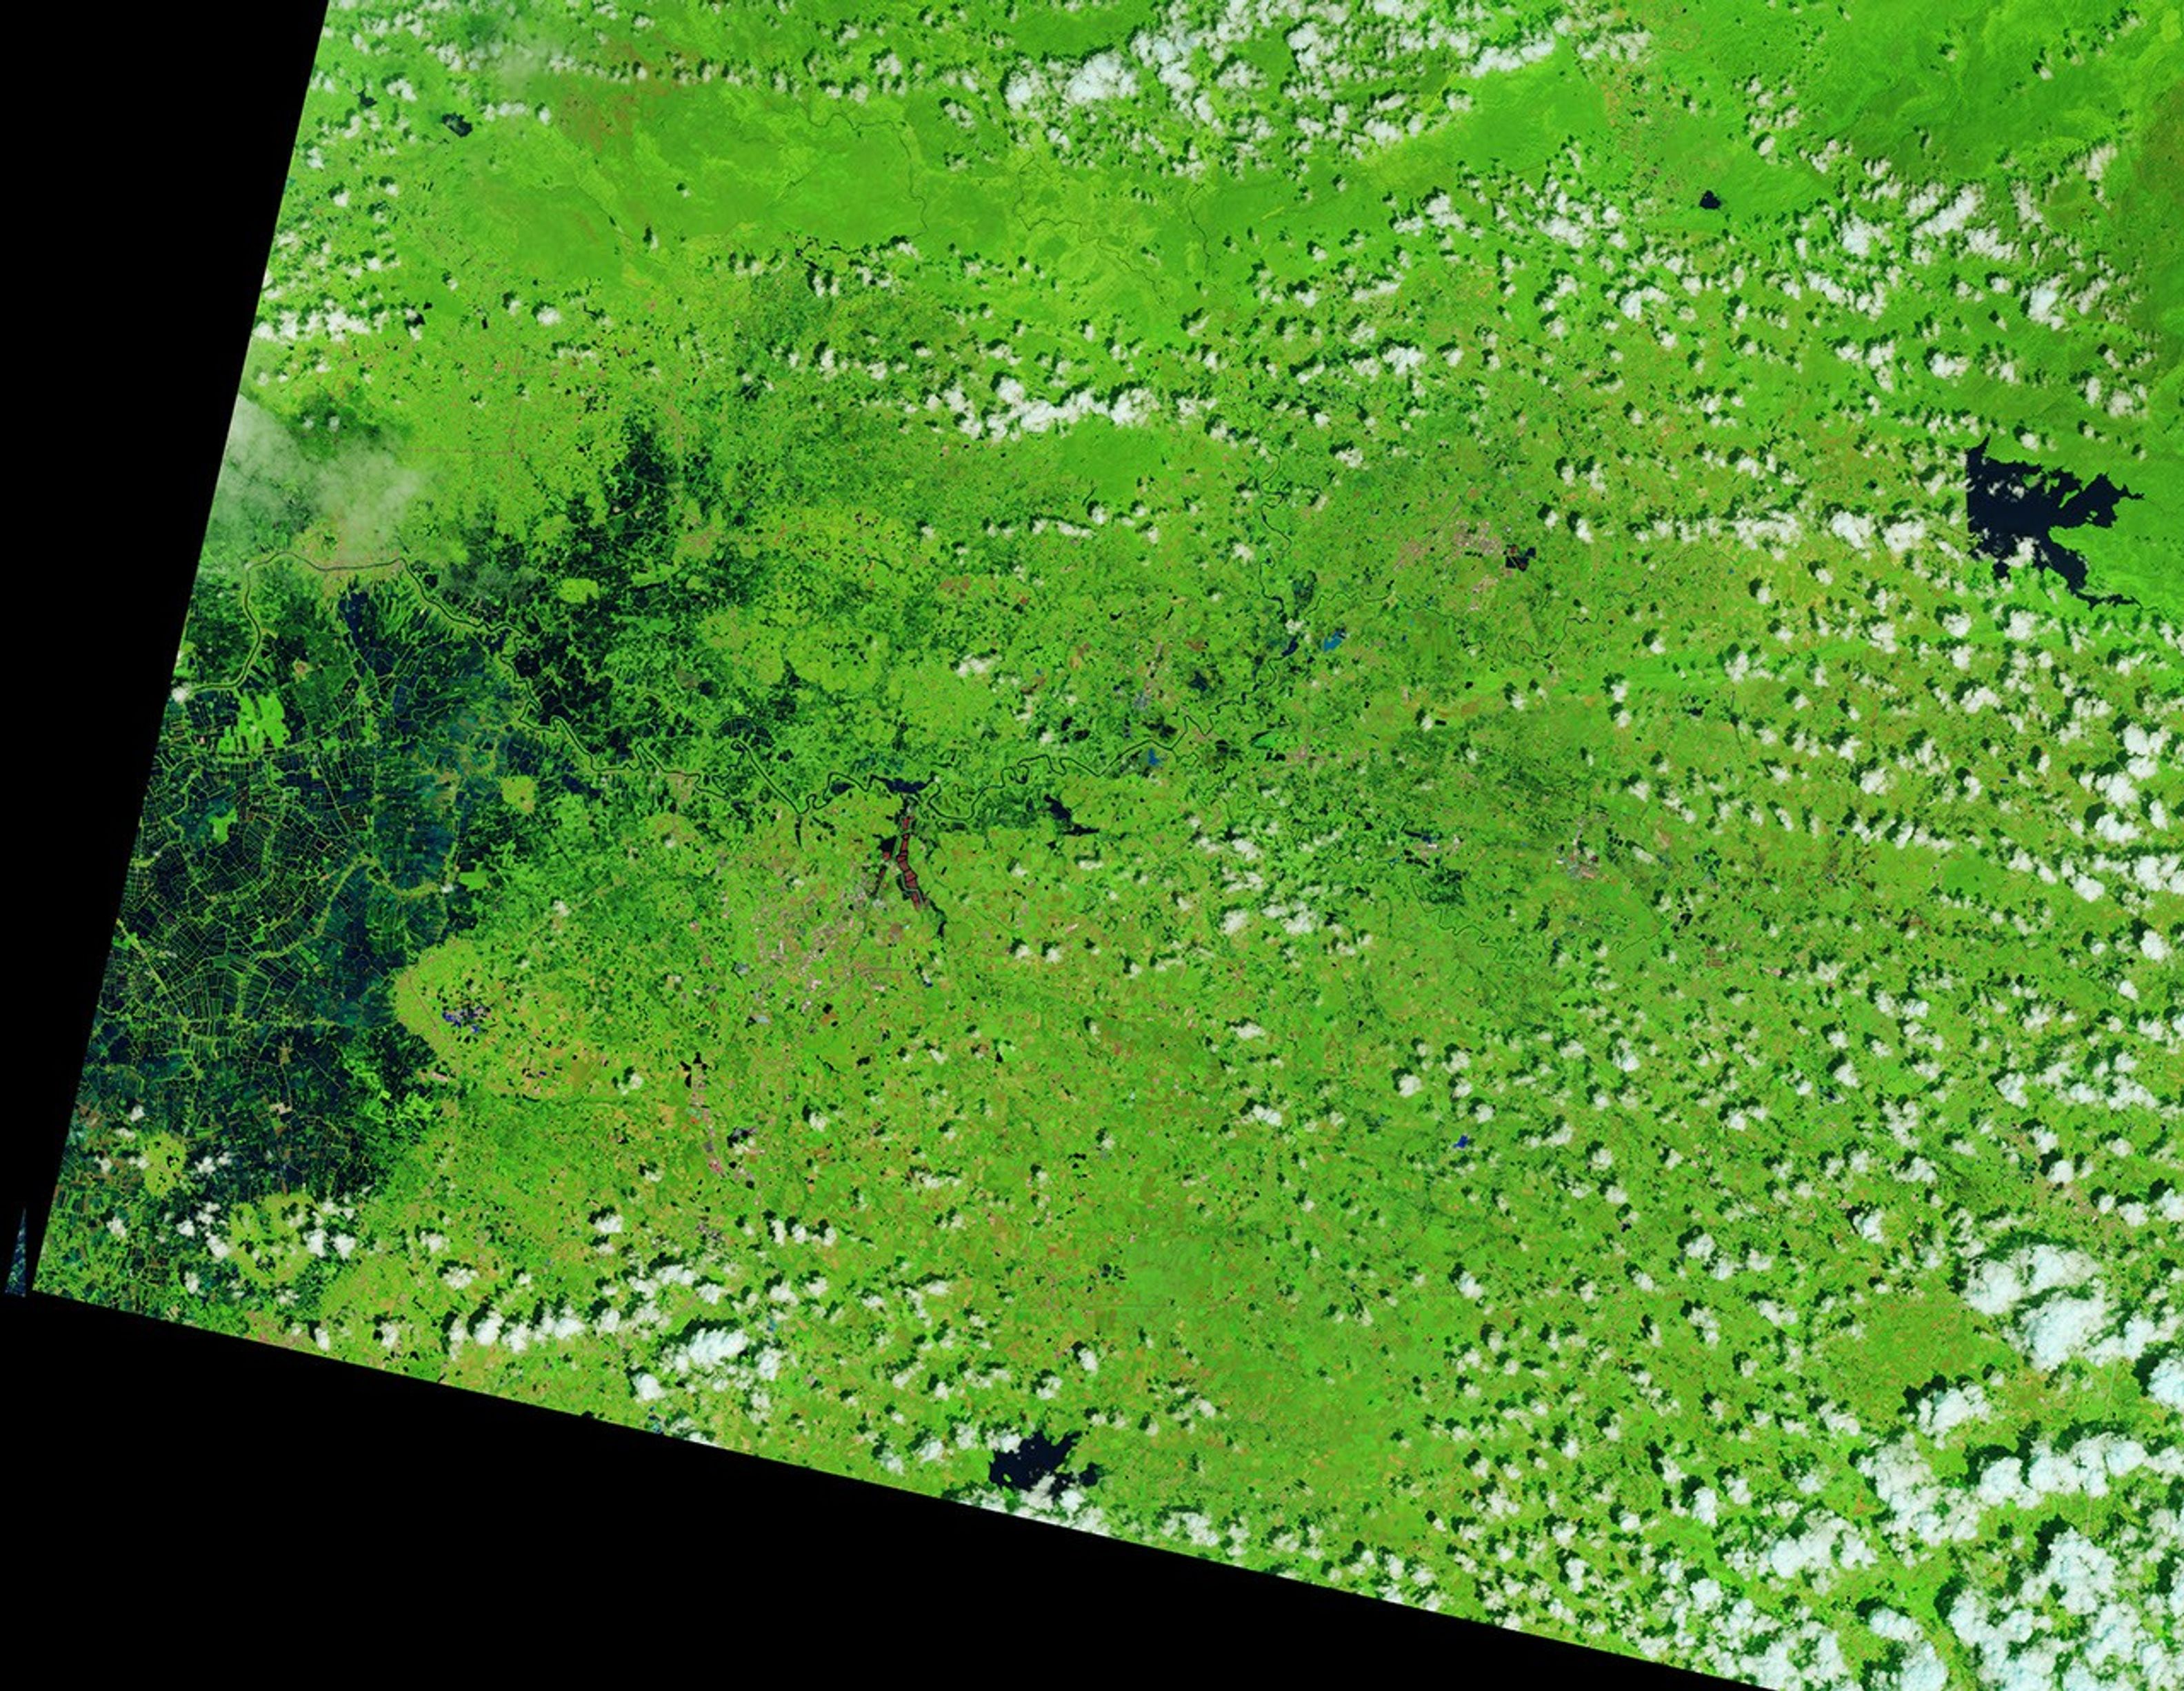
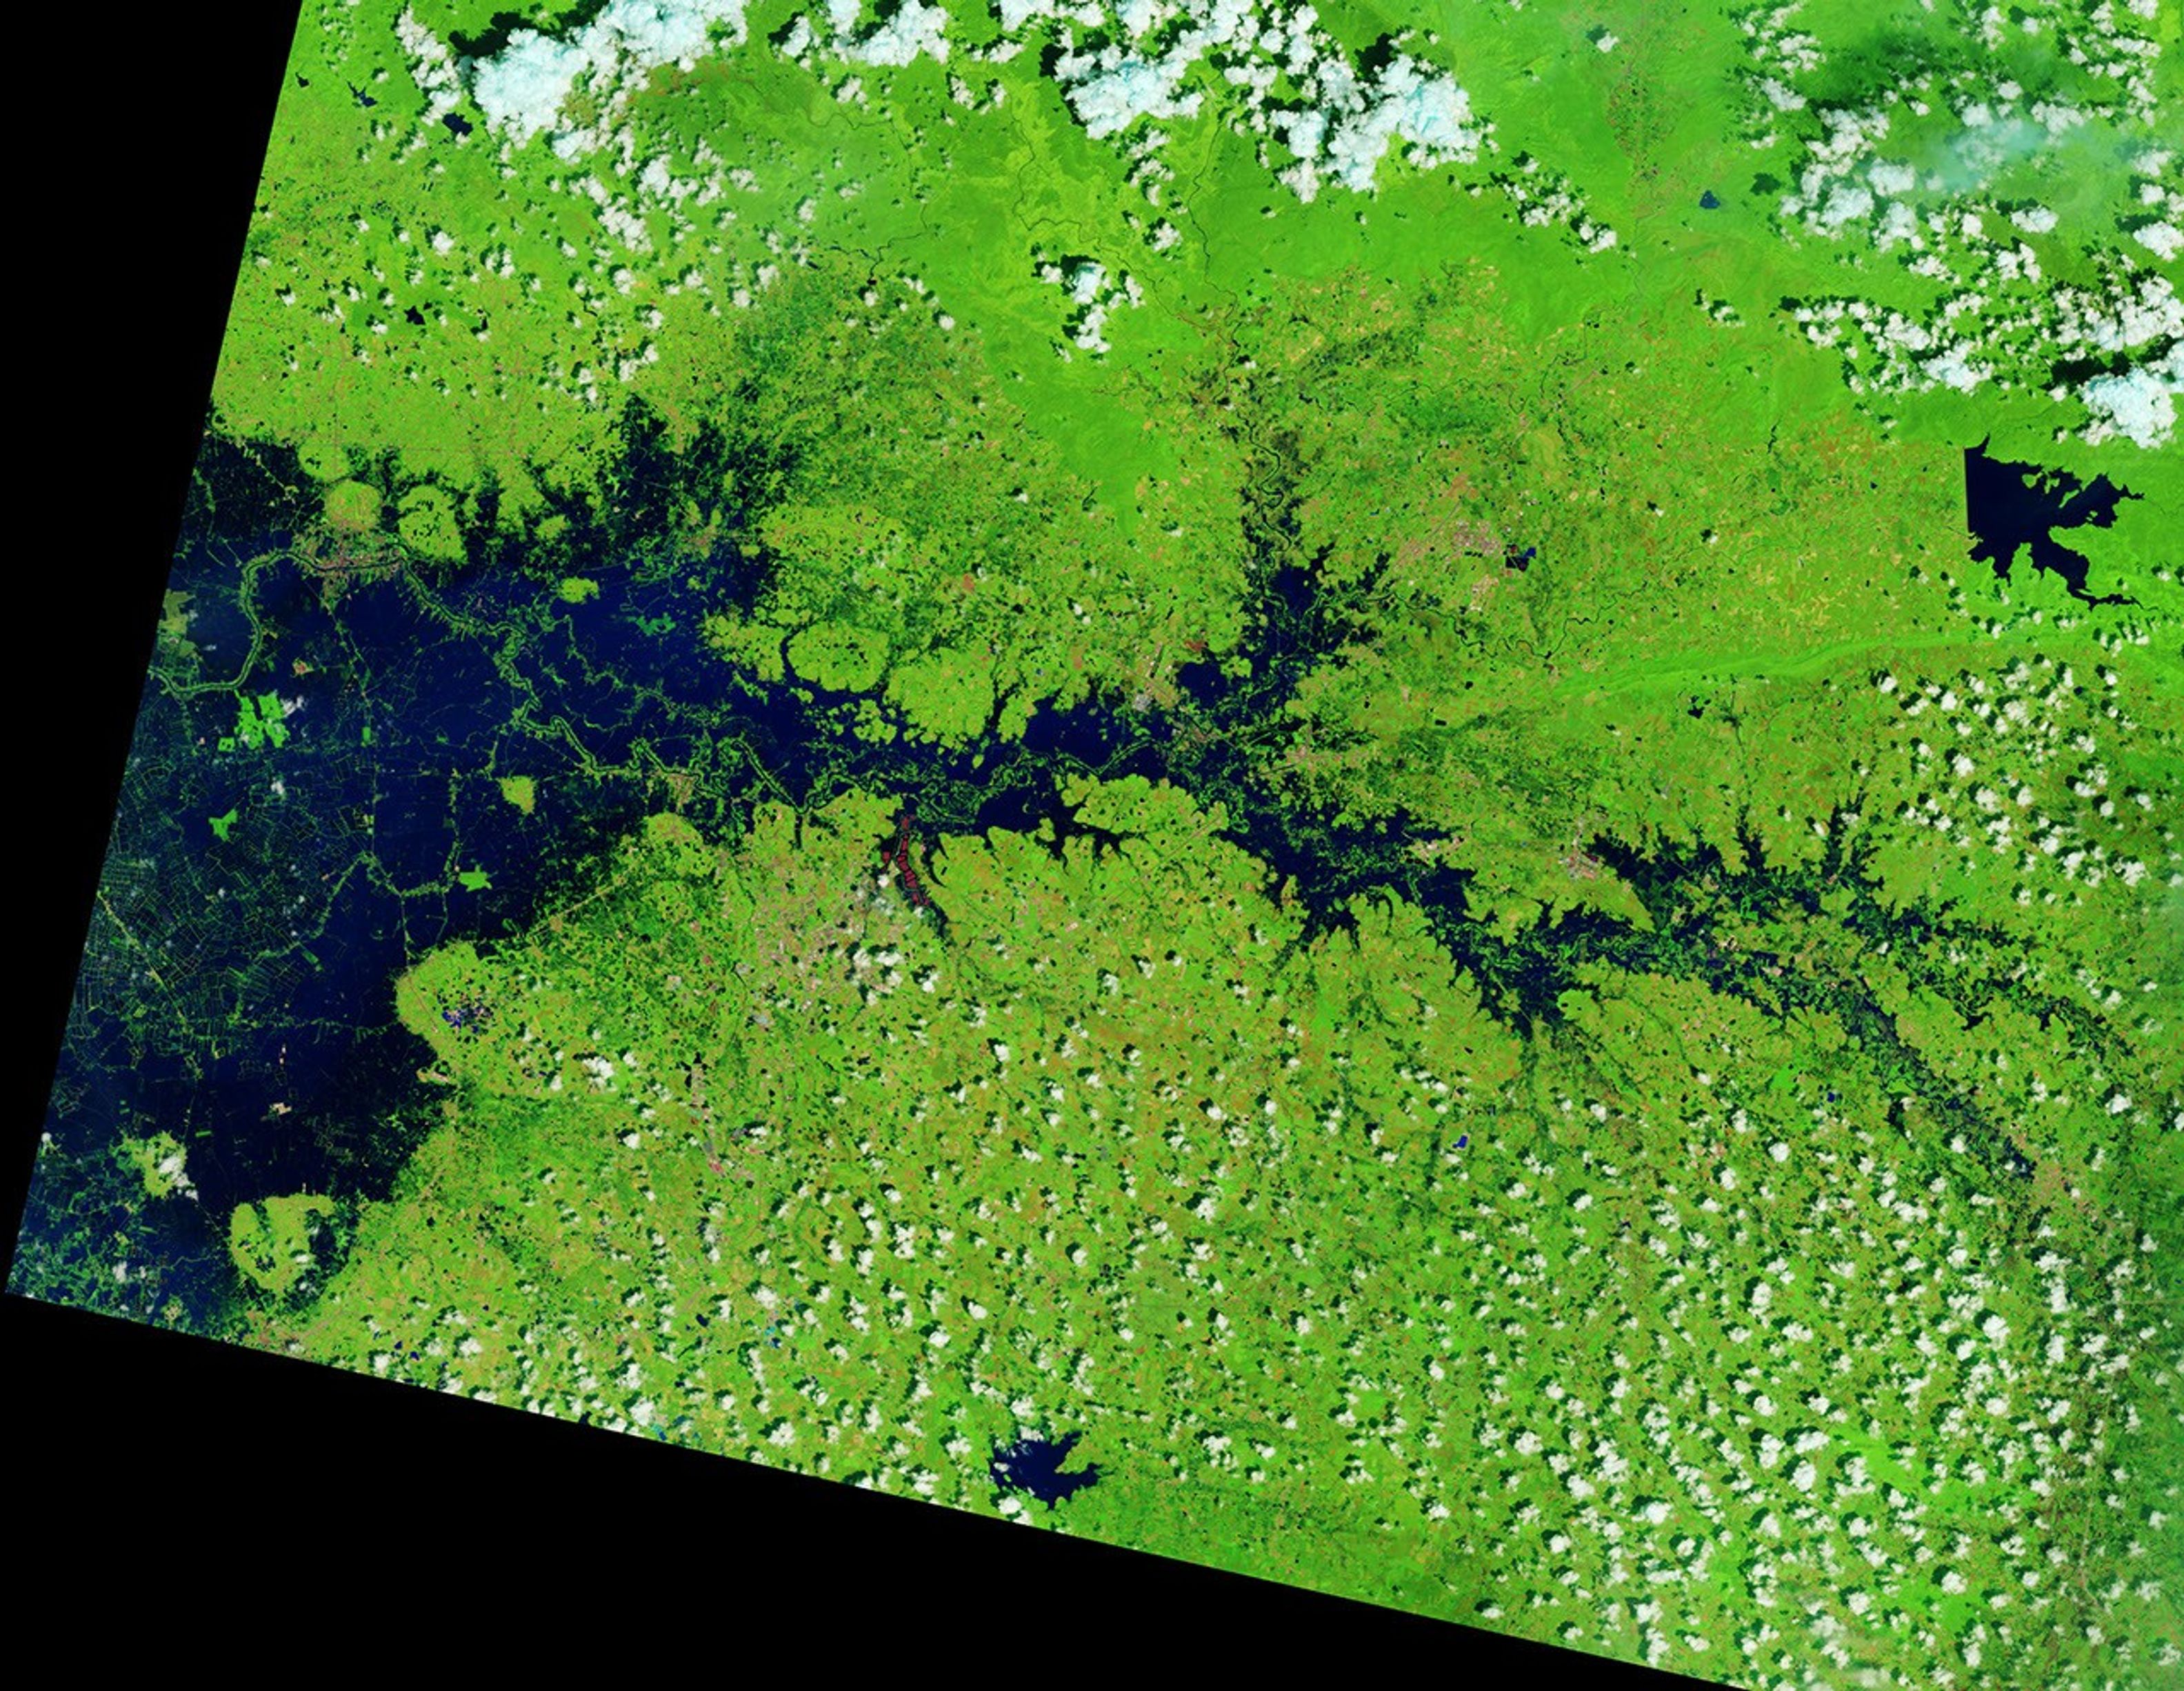
A narrow river (dark blue) meanders across vegetated land (bright green) in a false-color satellite image. Small geometric ponds or waterlogged fields appear on the left side of the scene.
NASA Earth Observatory / Lauren Dauphin

In a false-color satellite image of the same area, floodwaters (dark blue) flank a meandering river and cover a large swath of agricultural or aquacultural land primarily on the left side of the scene.
NASA Earth Observatory / Lauren Dauphin

A narrow river (dark blue) meanders across vegetated land (bright green) in a false-color satellite image. Small geometric ponds or waterlogged fields appear on the left side of the scene.
NASA Earth Observatory / Lauren Dauphin
In a false-color satellite image of the same area, floodwaters (dark blue) flank a meandering river and cover a large swath of agricultural or aquacultural land primarily on the left side of the scene.
NASA Earth Observatory / Lauren Dauphin

October 7, 2025

October 2, 2026


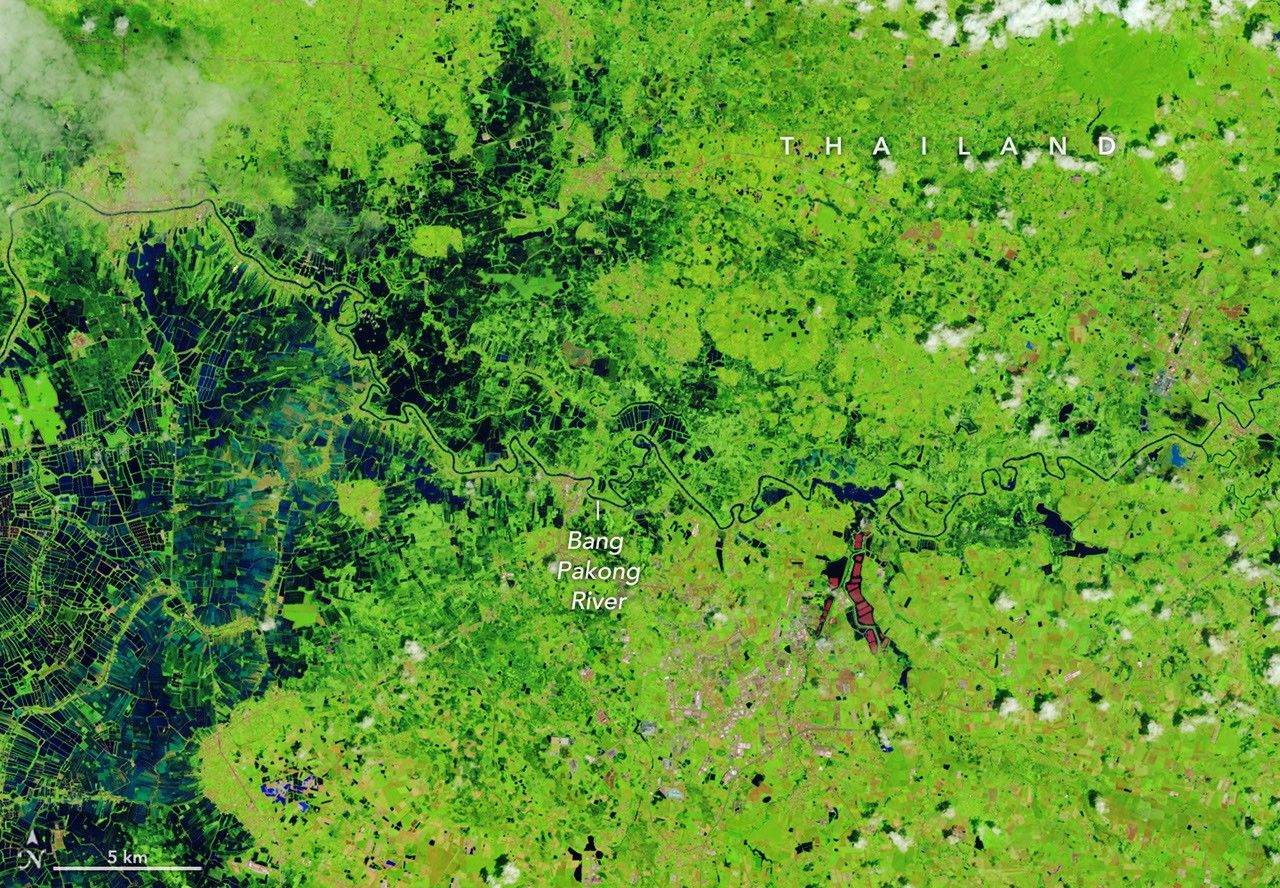
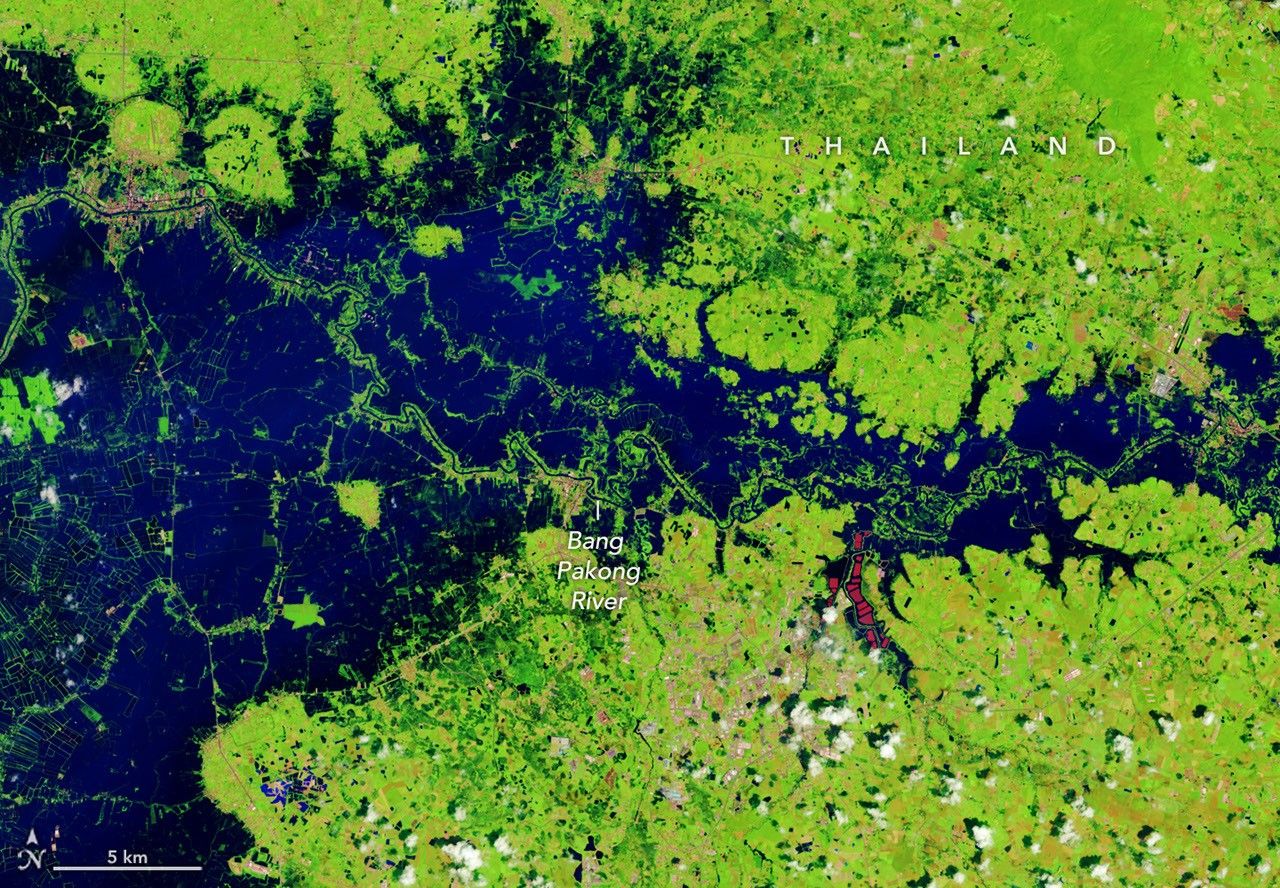
September falls in the heart of the monsoon season in Thailand, where cities and towns are accustomed to the afternoon rains and thunderstorms that frequently roll through. But throughout late September and early October 2026, persistent heavy rains punctuated by intense downpours left low-lying areas across the country in Southeast Asia under sustained flooding.

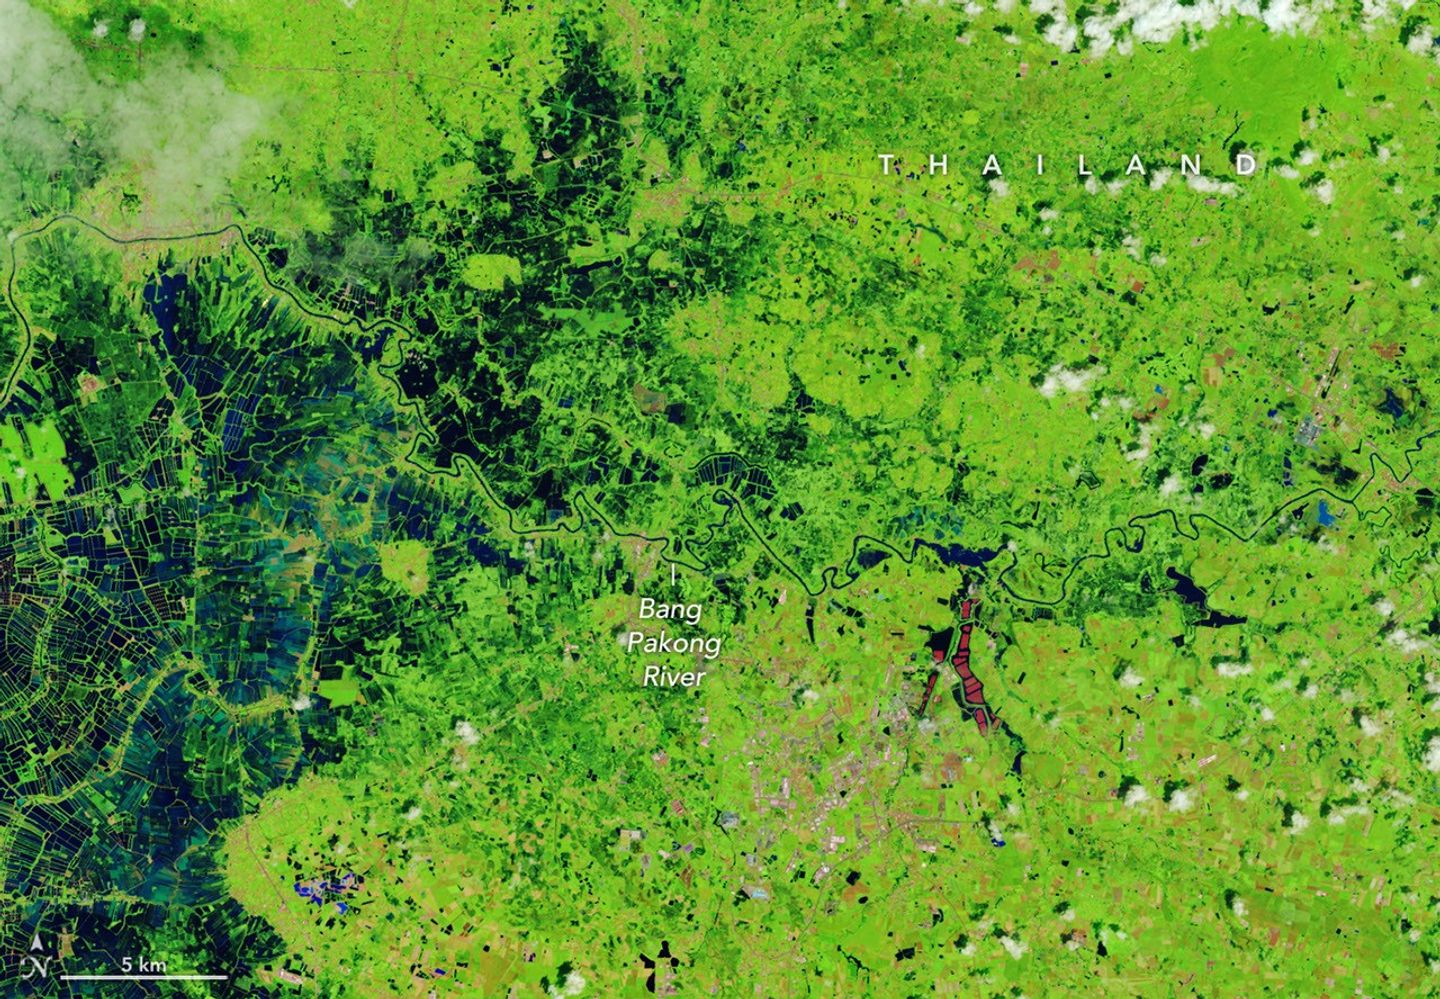
Prachin Buri province was among the areas where flooding was widespread. The right image above shows land along the Bang Pakong River and nearby agricultural areas and aquaculture facilities inundated on October 2, 2026. The left image shows the same area at the same time of year in 2025. Acquired with NASA-USGS Landsat satellites, the images are false-color to better distinguish water from vegetation, developed land, and other surfaces. The bright red shapes are floating solar arrays.

Some of the flooding likely stemmed from a low-pressure system that stalled over the area for several days in late September. Stoked by moisture and energy from the warm Gulf of Thailand nearby, the system delivered especially intense rains to the region. About 100 kilometers (60 miles) to the west, Bangkok received nearly 300 millimeters (11.8 inches) of rain over a 48-hour period, according to news reports, close to the average monthly rainfall total for September of 344 millimeters (13.5 inches).

Since mid-September, flooding has occurred in 50 provinces across the country, affecting over 4 million people and causing dozens of deaths, according to the International Federation of Red Cross and Red Crescent Societies. Government agencies estimate about 270,000 hectares (670,000 acres) of farmland, including rice fields and fruit orchards, have been damaged.

NASA Earth Observatory images by Lauren Dauphin, using Landsat data from the U.S. Geological Survey. Story by Lindsey Doermann.

Downloads

A narrow river (dark blue) meanders across vegetated land (bright green) in a false-color satellite image. Small geometric ponds or waterlogged fields appear on the left side of the scene.

October 7, 2025

JPEG (3.56 MB)

In a false-color satellite image of the same area, floodwaters (dark blue) flank a meandering river and cover a large swath of agricultural or aquacultural land primarily on the left side of the scene.

October 2, 2026

JPEG (3.79 MB)

References & Resources

You may also be interested in:

Stay up-to-date with the latest content from NASA as we explore the universe and discover more about our home planet.

Rains Swamp the Gandak River

3 min read

After days of torrential rain, the river rose to record-breaking levels in parts of Nepal and India.

Article

An Agricultural “Island” in the Saskatchewan River Delta

3 min read

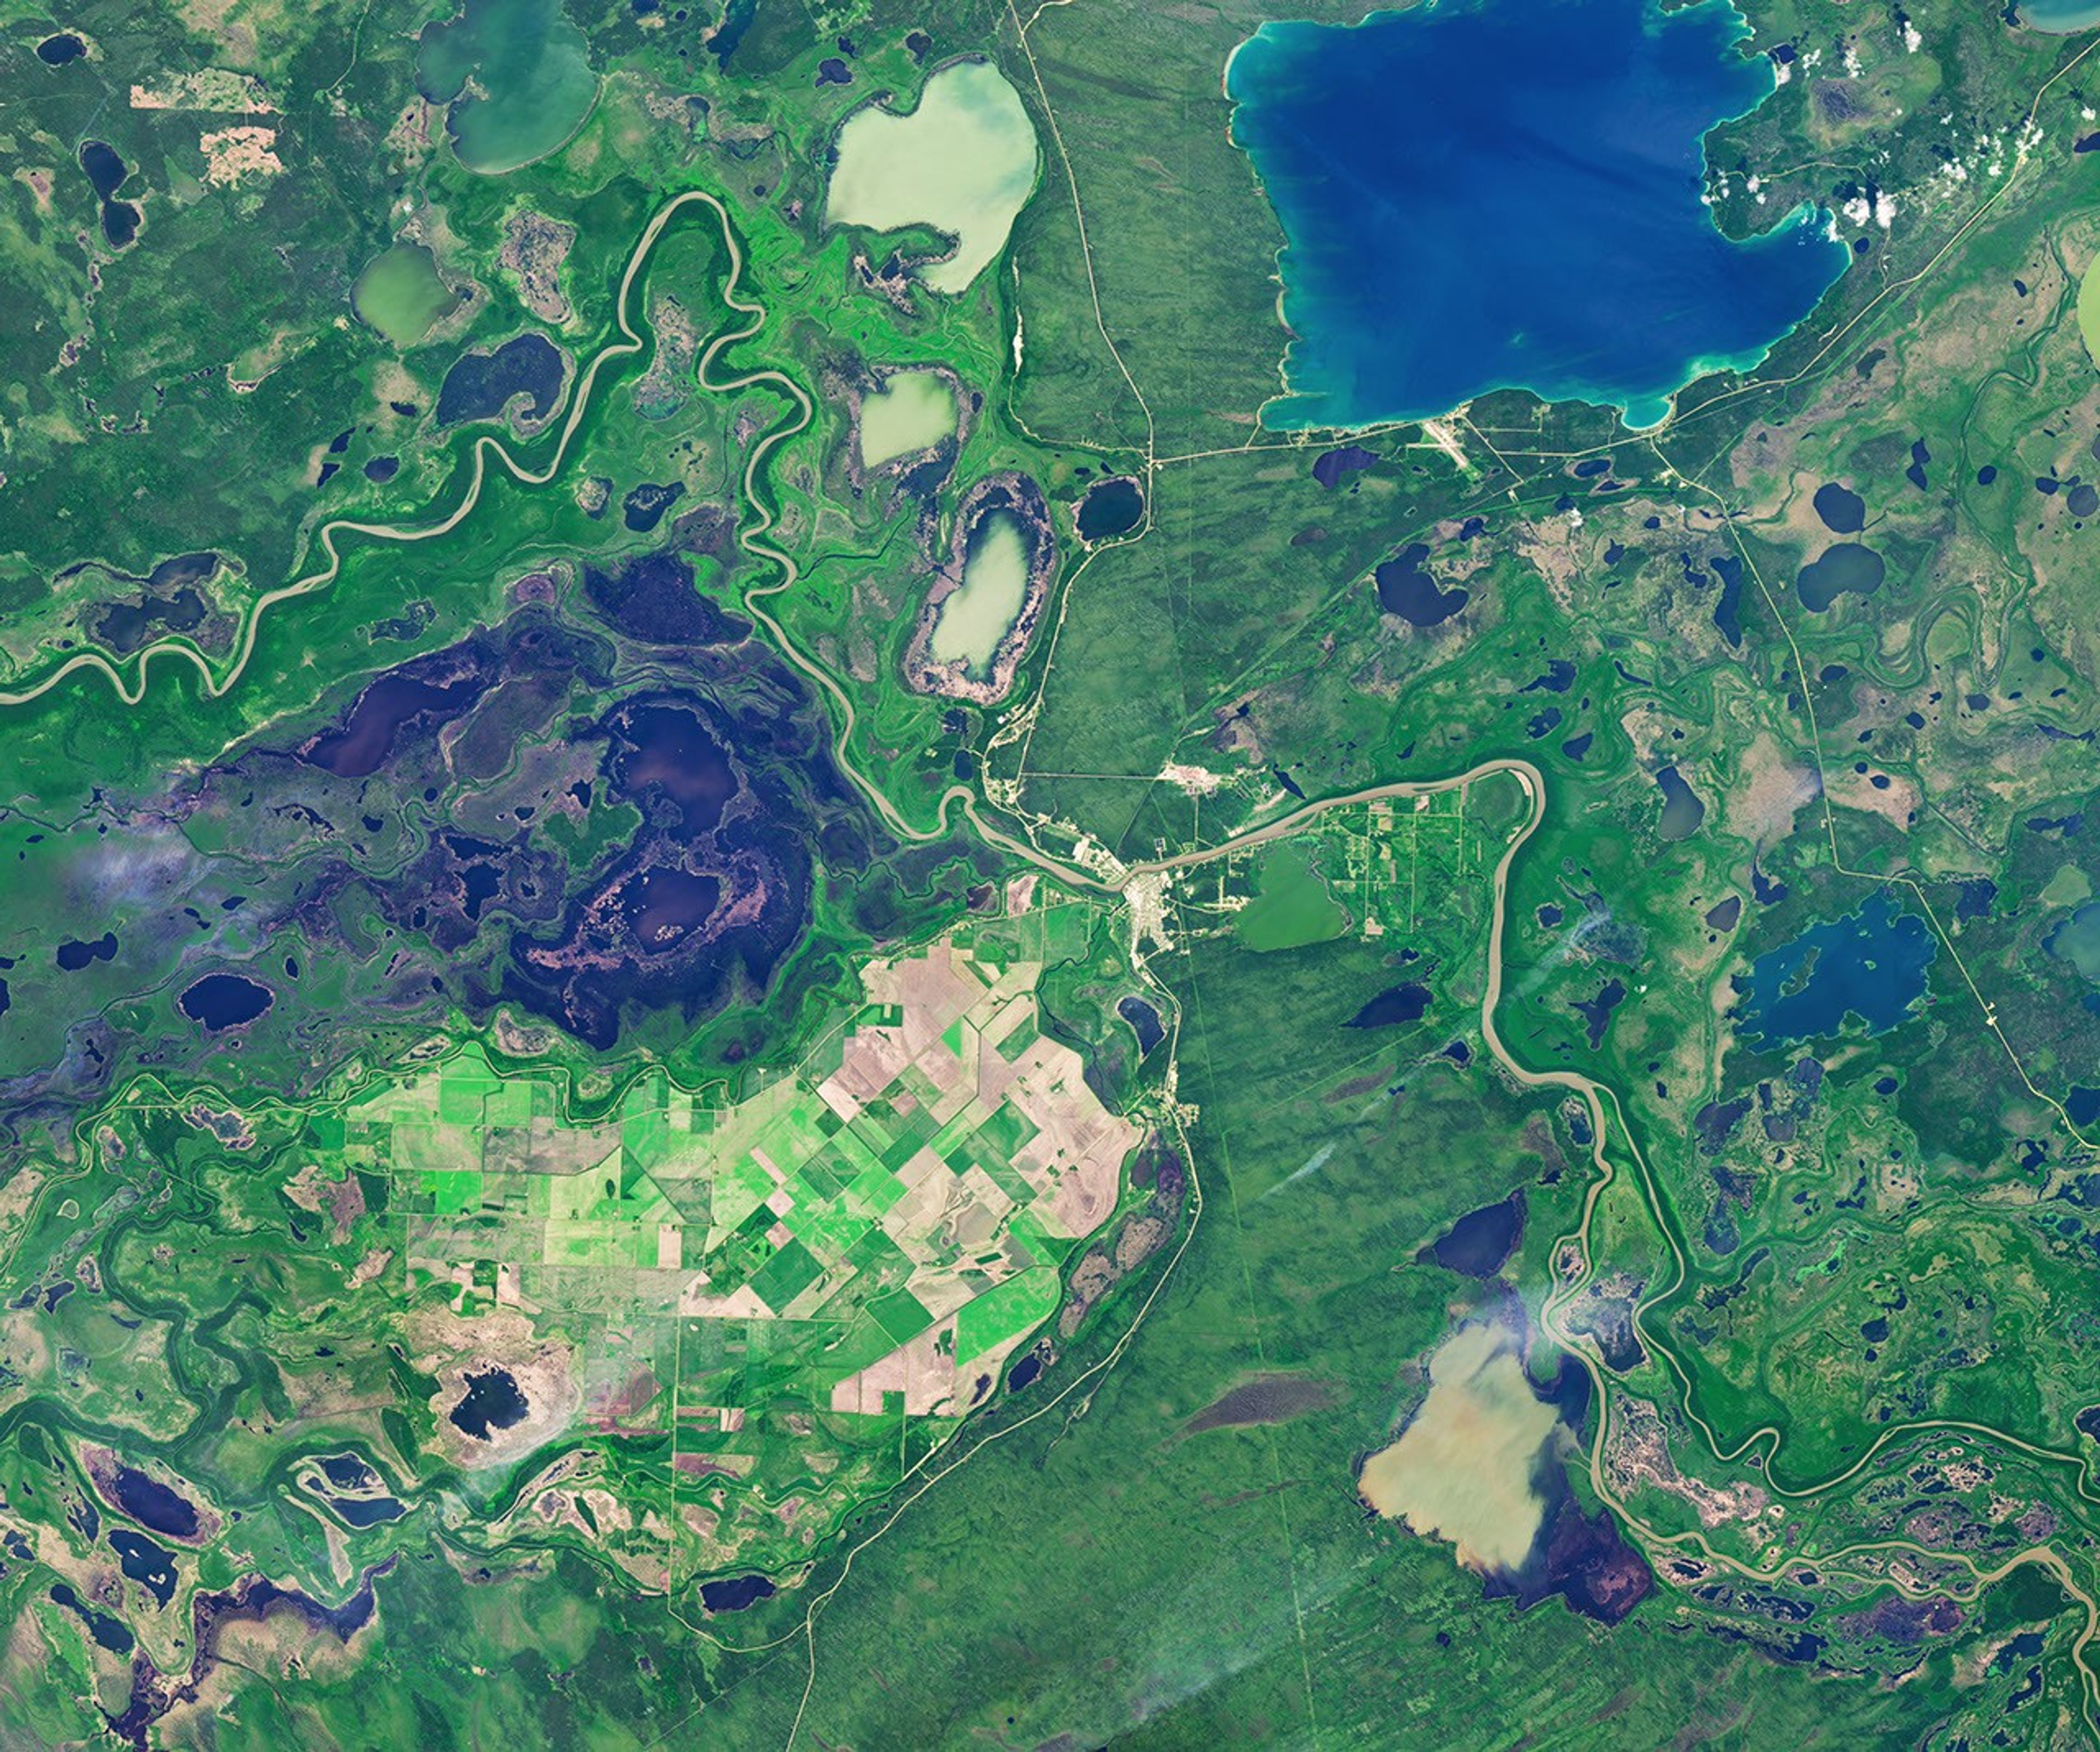
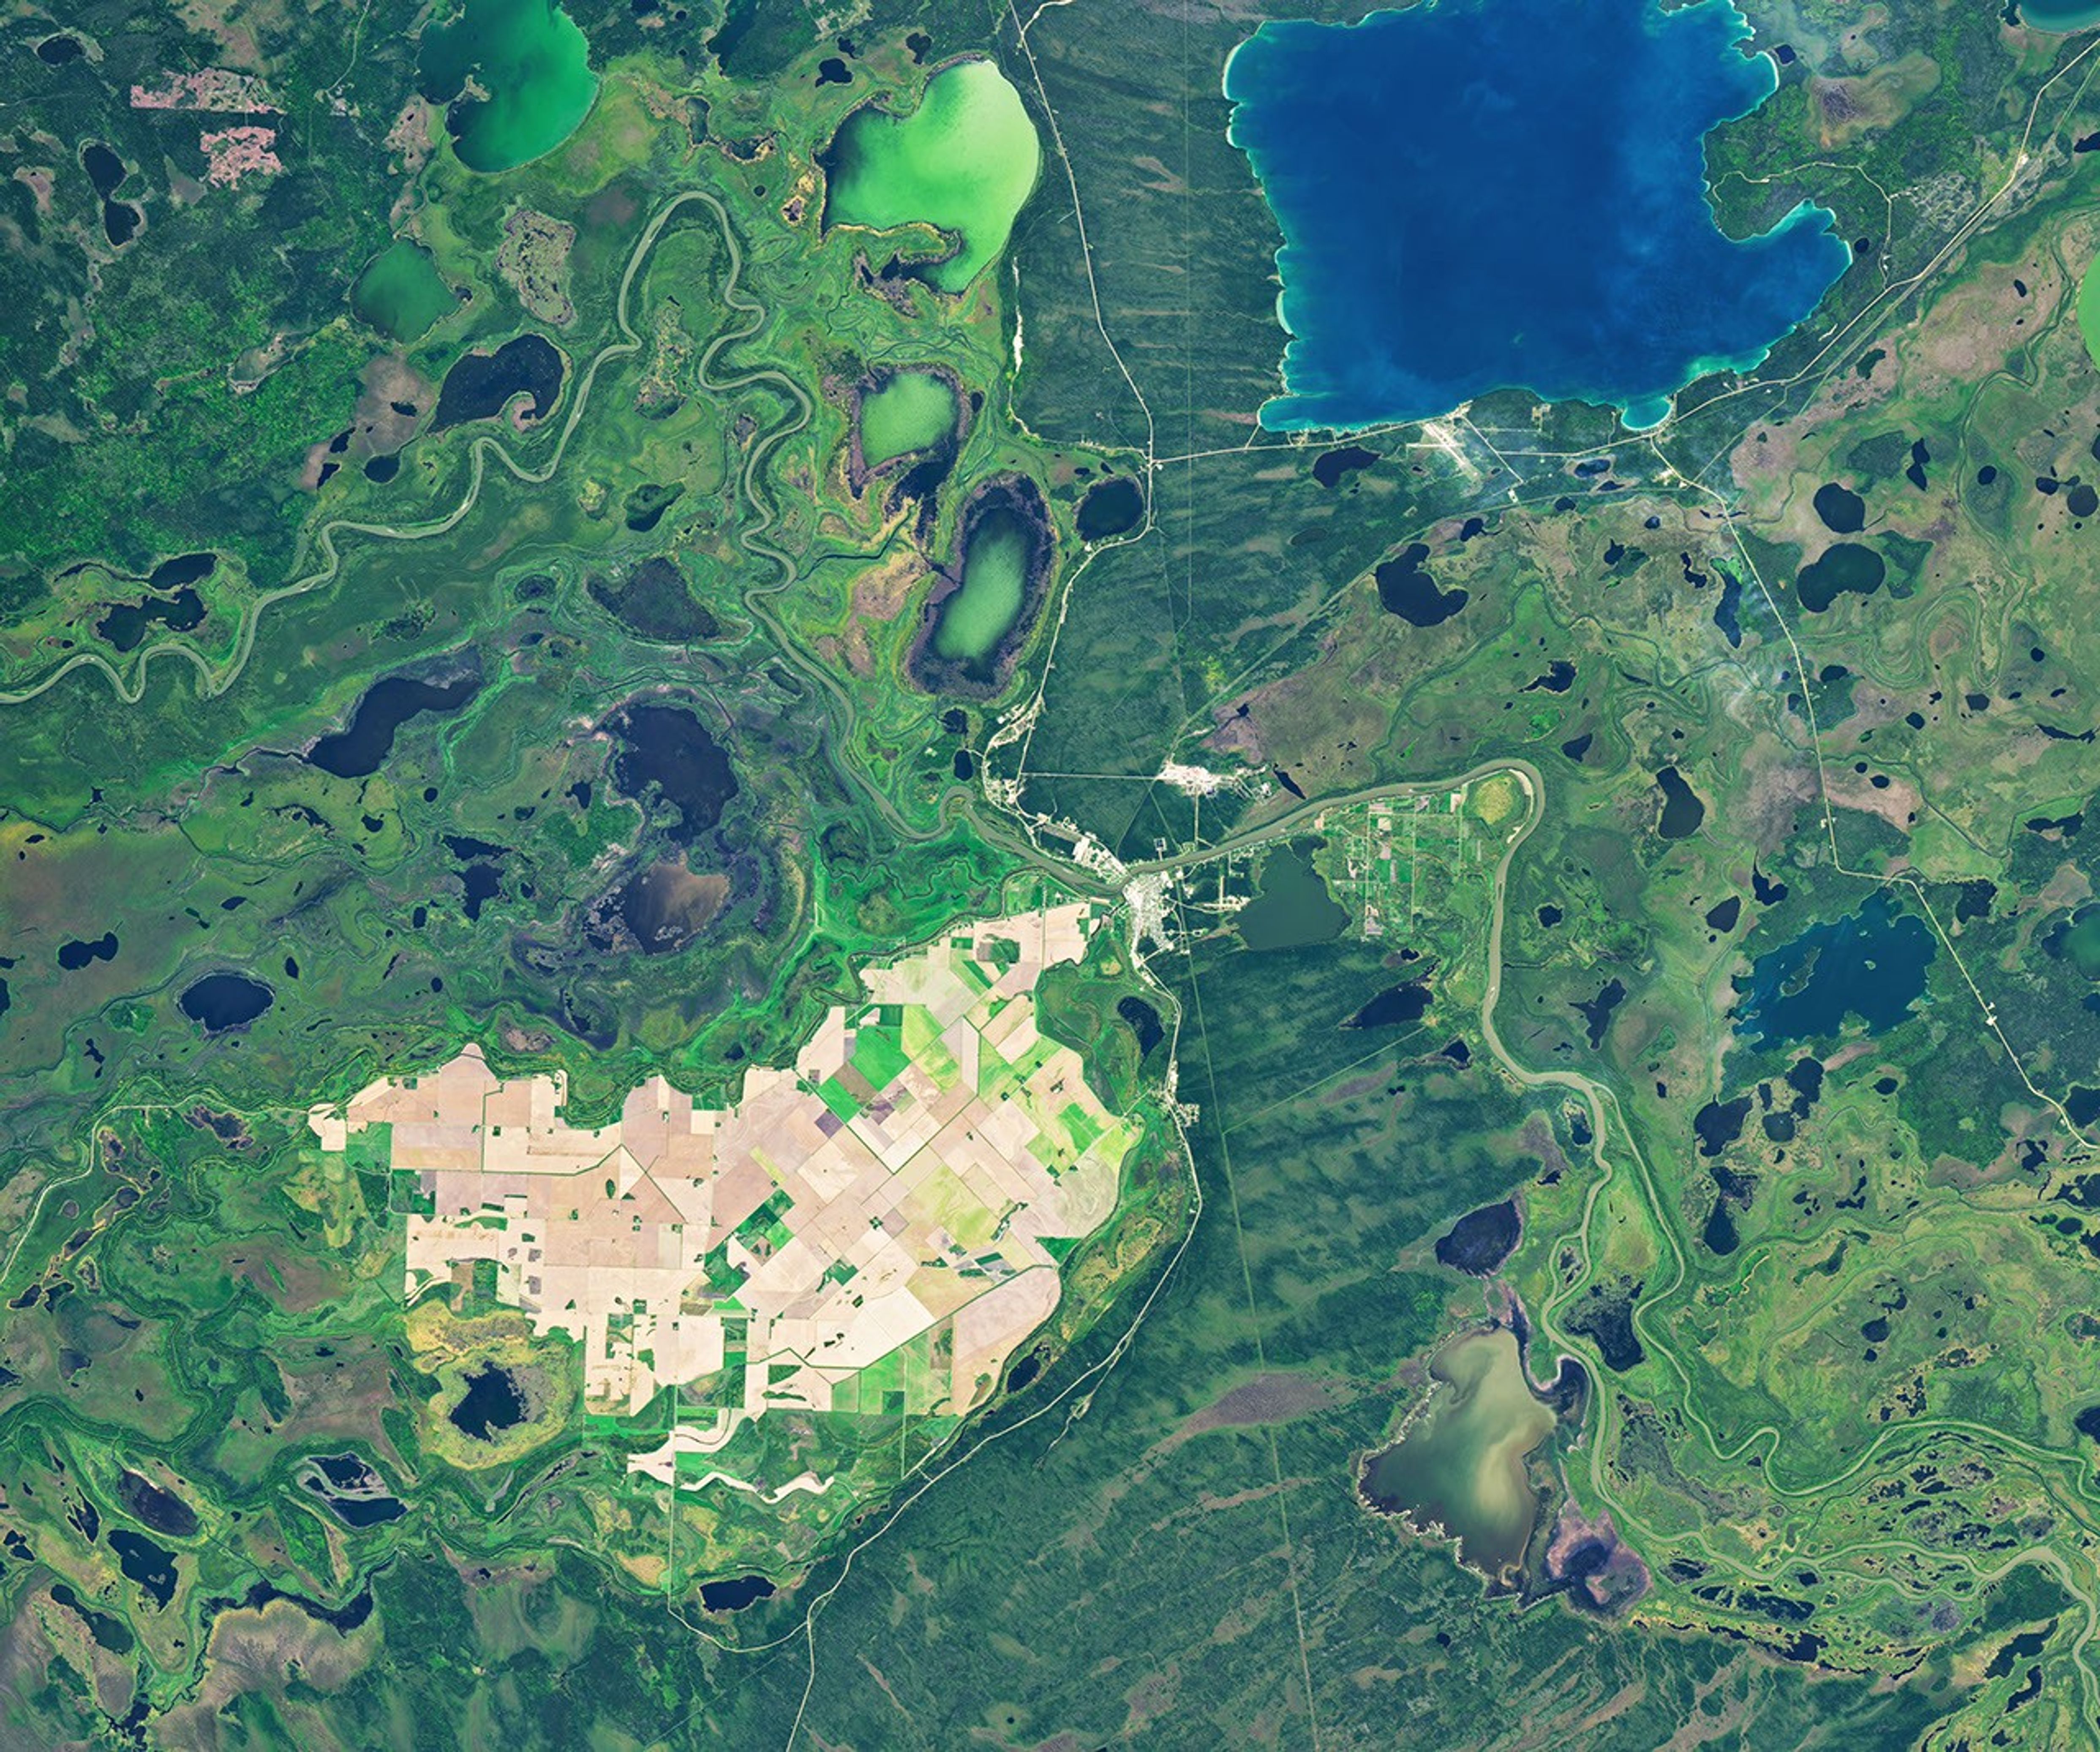
Surrounded by wetlands, Manitoba’s northernmost farmland near The Pas turns from green to brown over the 2026 growing season.

Article

The Birthplace of the United States

3 min read

It was here the founders shaped the future of American government.

Article

The Beaver Brown Waters of Rupert Bay 

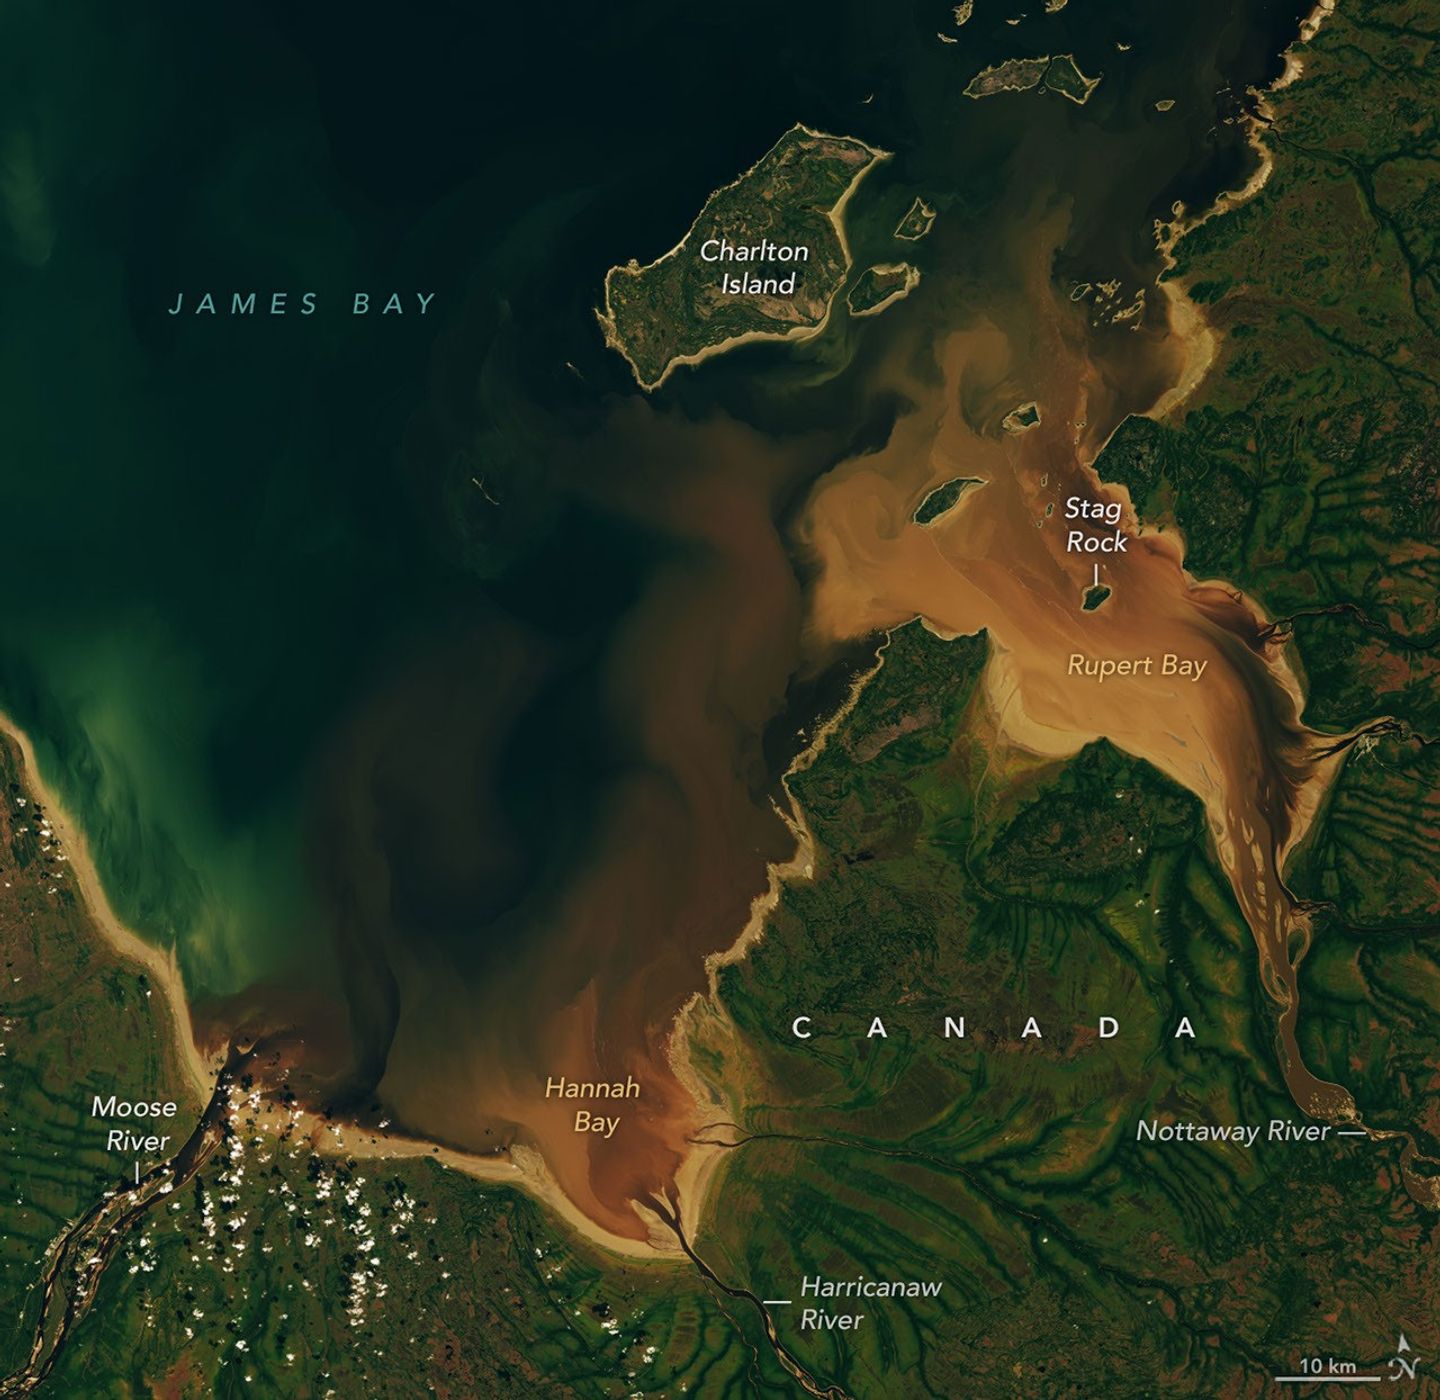
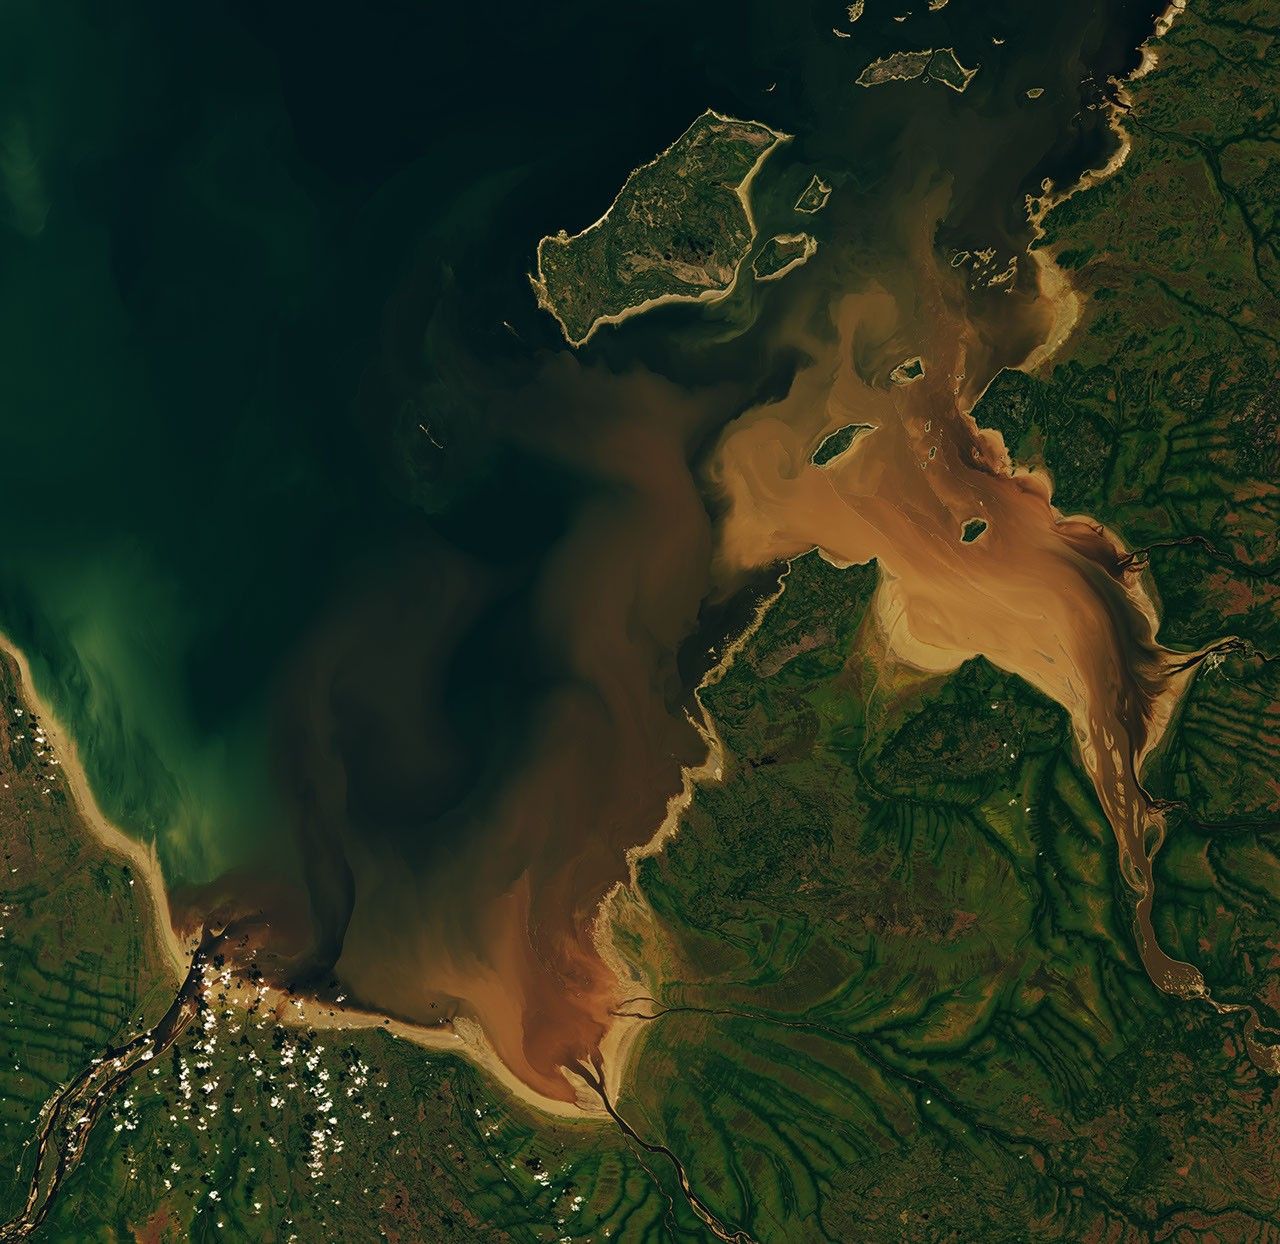
Dark brown water from the Nottaway, Harricanaw, and Moose rivers swirls into dark blue bay waters and mingles with plumes of lighter brown suspended sediment. Charlton Island and the much smaller Stag Rock are visible close to the shoreline.

The Cree word pahtaaunaakun seems particularly apt for describing the distinctive brown hues of the waters that drain into Hannah Bay and Rupert Bay in Canada. Meaning the “color of singed beaver” in Southern East Cree, the word evokes the rich brown of the humic-substance-stained waters that were flowing into the two bays in late September 2026, as well as the role that beavers have long played in the mythology and history of the region.

As the rivers and streams that flow into the two bays—the southernmost extensions of James Bay—wind through the boreal forests and boggy wetlands of northern Quebec and Ontario, they often carry water stained brown by colored dissolved organic matter (CDOM), which absorbs light in the blue and ultraviolet parts of the electromagnetic spectrum and causes water to appear brown. CDOM, including organic substances derived from tannins and lignins, leaches from decaying leaves, roots, bark, and soils into streams and rivers. Similar substances are what stain tea water brown.

When the OLI (Operational Land Imager) on Landsat 9 captured this image on September 27, 2026, the Moose, Nottaway, and Harricanaw rivers were carrying tea-colored water across the broad mudflats of Hannah and Rupert bays and mingling with the darker blue waters of James Bay.

The mudflats, the light brown areas along the shore, are a product of the shallow, sloping bathymetry in the southernmost part of James Bay. Postglacial rebound is slowly lifting the entire landscape, and rivers continually deposit fine mud particles and other sediments that build up the flats. The comings and goings of tides and river currents often stir up the mud, producing the lighter brown plumes of suspended sediment that mix with the incoming river water.

Differences in moisture levels and vegetation patterns likely contribute to the green dendritic, veinlike patterns visible onshore. Denser, more forested growth along stream channels appears dark green, while the poorly drained landscapes in the surrounding peat bogs have less extensive tree cover and appear lighter green.

Beavers have long played a role in the history and mythology of the lake-dotted landscapes in this part of Canada. The Cree people, who have lived in the region for thousands of years, have traditionally hunted beaver for both meat and pelts. European traders arrived in Rupert Bay as early as the 1660s to pursue the animals as well, leading to the establishment of several trading posts along the bay’s shores and the founding of the Hudson’s Bay Company to cultivate the fur trade, especially in beaver pelts.

Beavers also feature prominently in the area’s Cree mythology and environmental history in other ways. For instance, one Cree myth about this area, recorded by the anthropologist Alanson Skinner, tells of a giant pursuing an enormous mythical beaver down the Nottaway River until the beaver escaped into Rupert Bay. According to the myth, the giant then picked up a huge rock and hurled it at the fleeing animal, missing the beaver but creating Stag Rock, the distinctive island found in the river’s mouth today.

In an early example of a managed beaver preserve in Canada, the Hudson’s Bay Company worked with local Cree people in the 1830s and again a century later to set up Charlton Island as a place to raise beavers for later trapping. After predators had been removed and several breeding pairs delivered to the island, its beaver population ballooned, according to historical accounts.

NASA Earth Observatory images by Lauren Dauphin, using Landsat data from the U.S. Geological Survey. Story by Adam Voiland.

Downloads

Dark brown water from the Nottaway, Harricanaw, and Moose rivers swirls into dark blue bay waters and mingles with plumes of lighter brown suspended sediment. Charlton Island and the much smaller Stag Rock are visible close to the shoreline.

September 27, 2026

JPEG (6.37 MB)

References & Resources

You may also be interested in:

Stay up-to-date with the latest content from NASA as we explore the universe and discover more about our home planet.

Bountiful Roebuck Bay 
4 min read

Tidal and seasonal shifts leave their mark on this crescent-shaped, productive bay in Western Australia’s Kimberley region.

Article
Why Maine’s Sandy Shorelines Turn Jagged
4 min read

Differences in the underlying bedrock and how rivers distribute sediment make the coastlines west of Portland look unlike those northeast…

Article
San Francisco’s Metropolitan Mosaic
3 min read

Urban development, green spaces, and maritime activity converge in this Northern California city.

Article

An Agricultural “Island” in the Saskatchewan River Delta


Summer
autumn

A satellite image captured in summer shows farm fields in a patchwork of green and brown, surrounded by green wetlands dotted with dark patches of open water.
NASA Earth Observatory/Michala Garrison

The same area in autumn shows many of the farm fields are now brown, and the surrounding wetlands hold less water.
NASA Earth Observatory/Michala Garrison

A satellite image captured in summer shows farm fields in a patchwork of green and brown, surrounded by green wetlands dotted with dark patches of open water.
NASA Earth Observatory/Michala Garrison
The same area in autumn shows many of the farm fields are now brown, and the surrounding wetlands hold less water.
NASA Earth Observatory/Michala Garrison

Summer

autumn


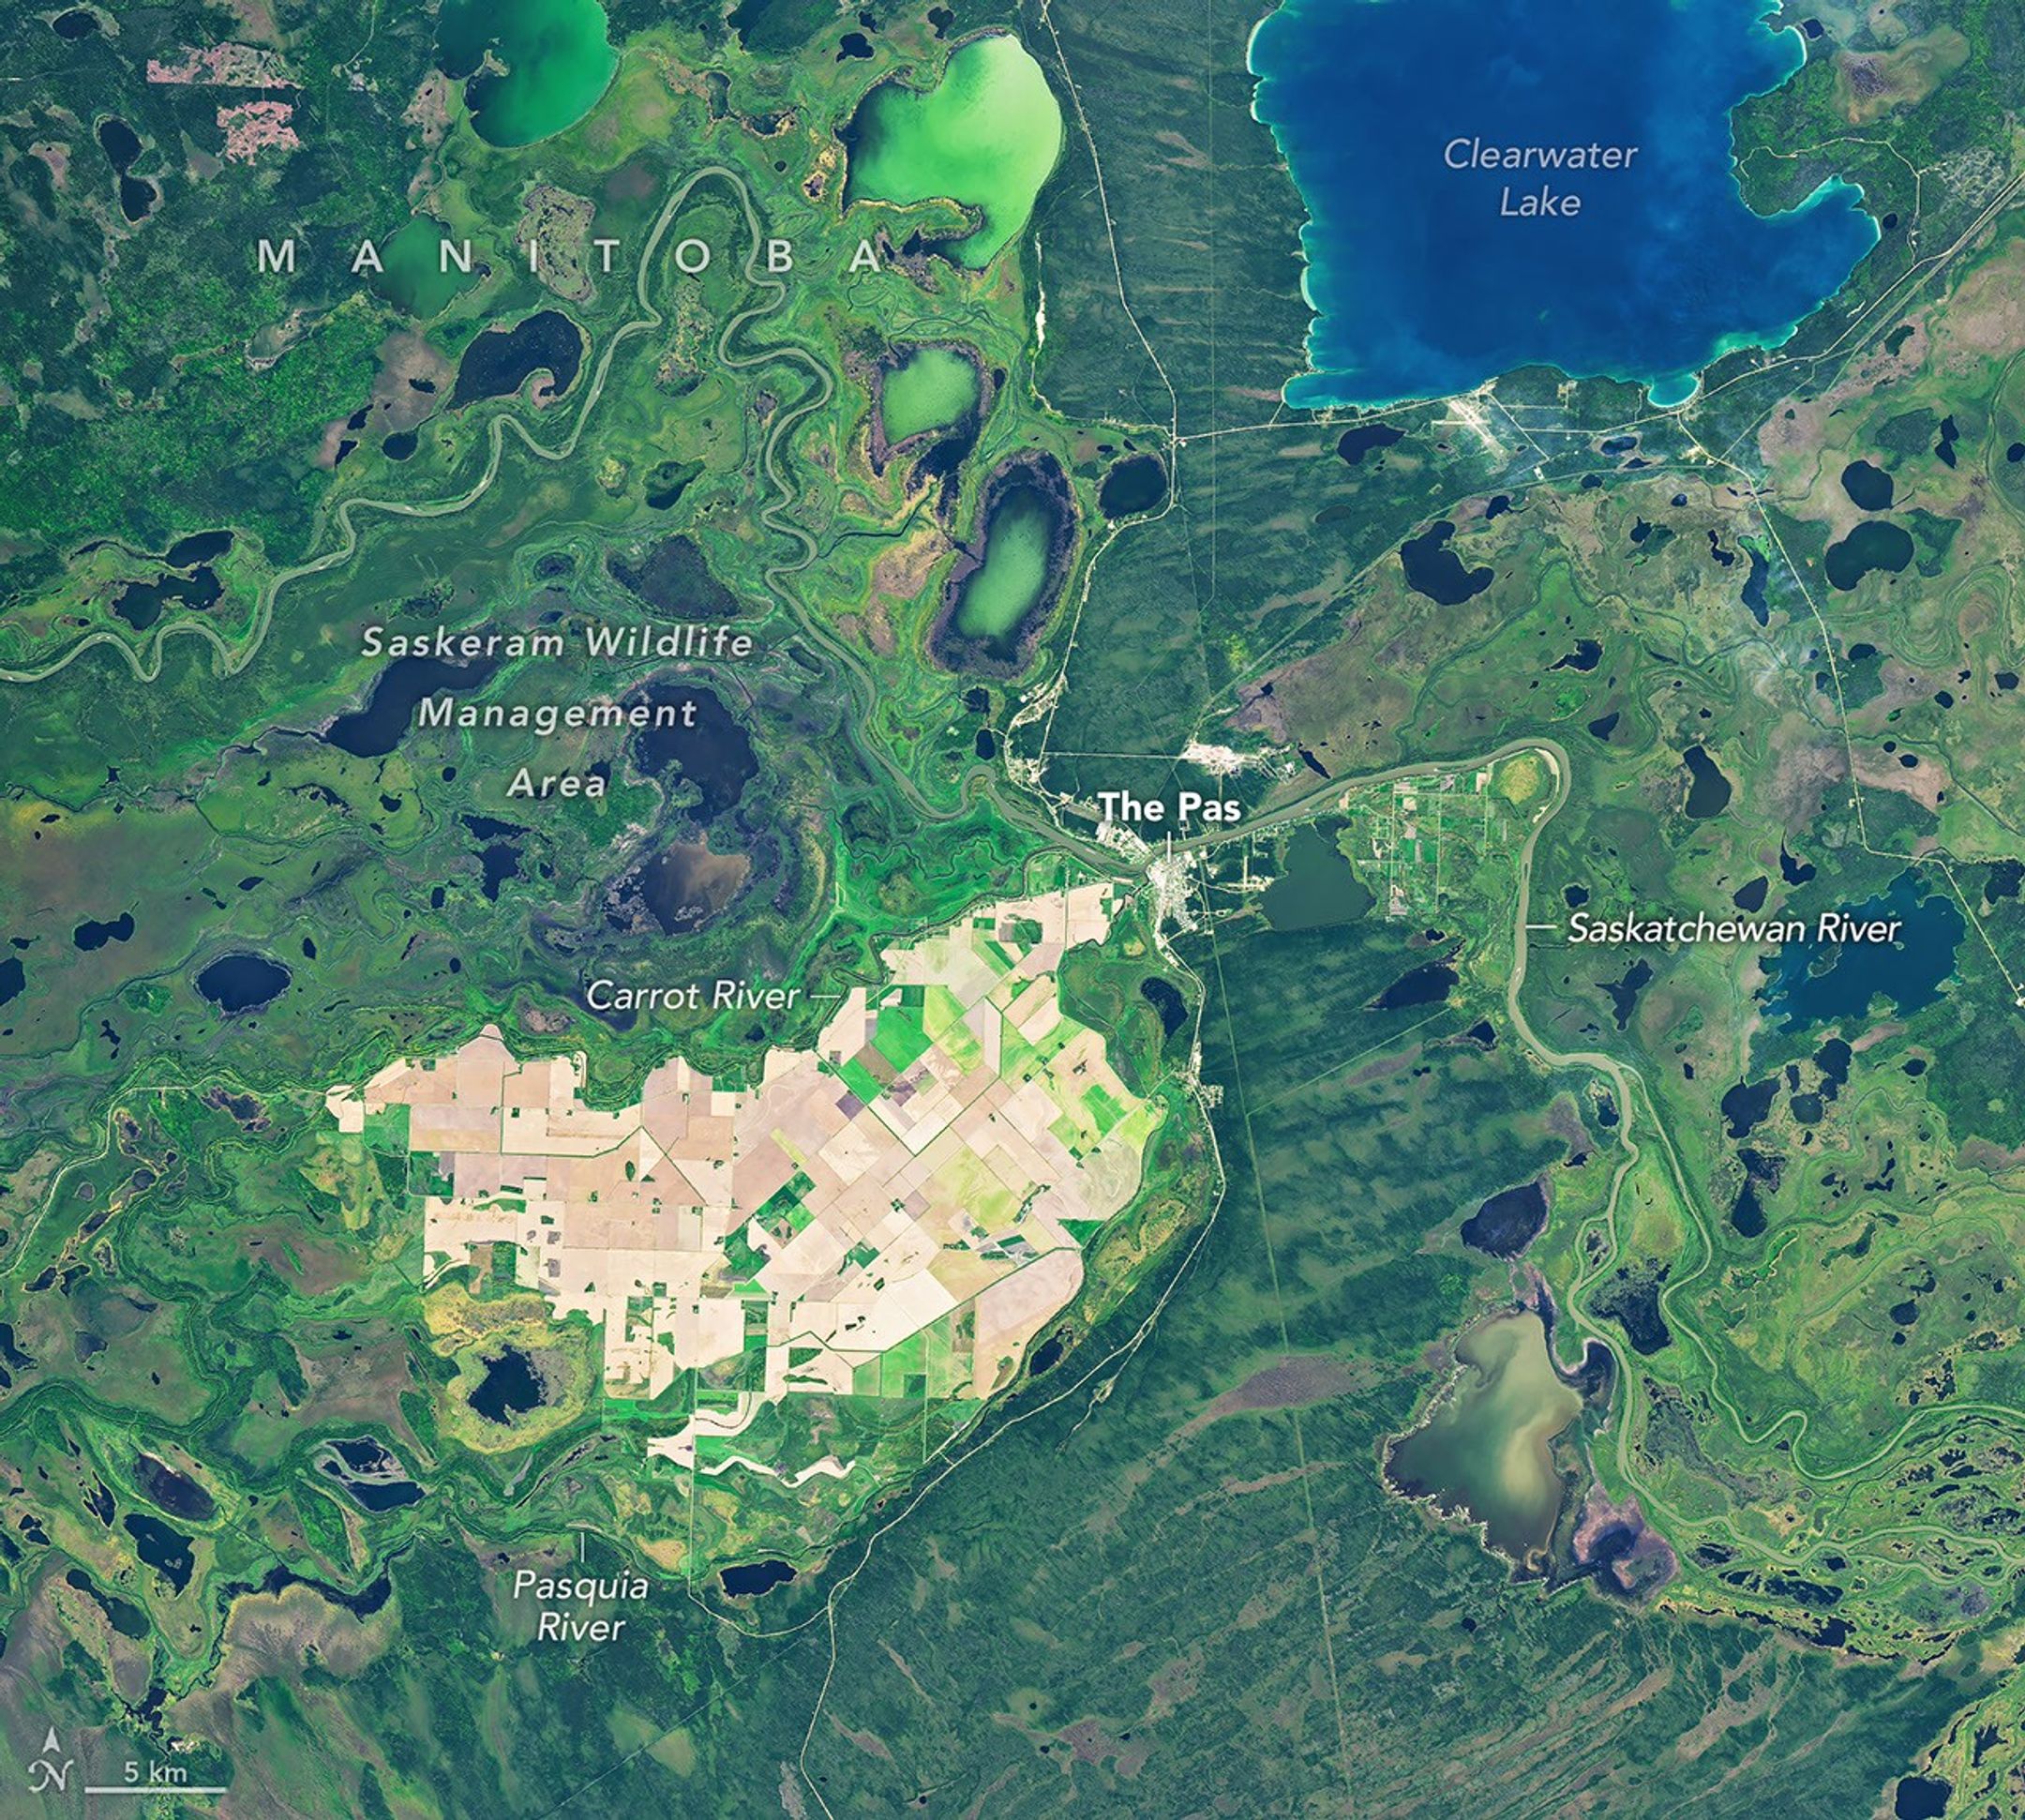
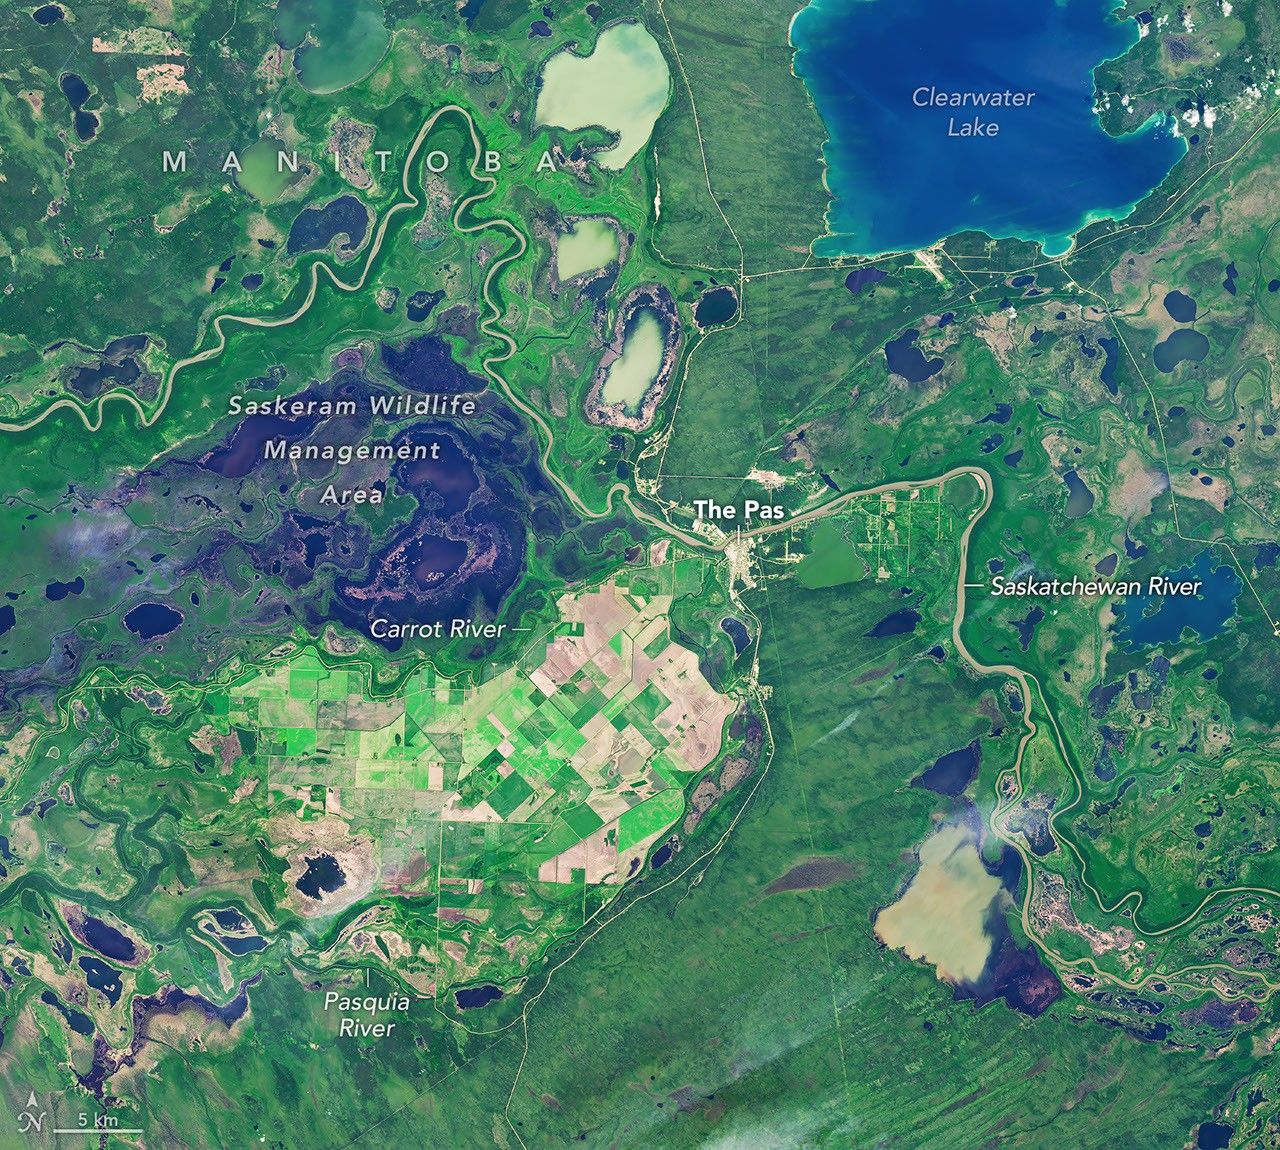
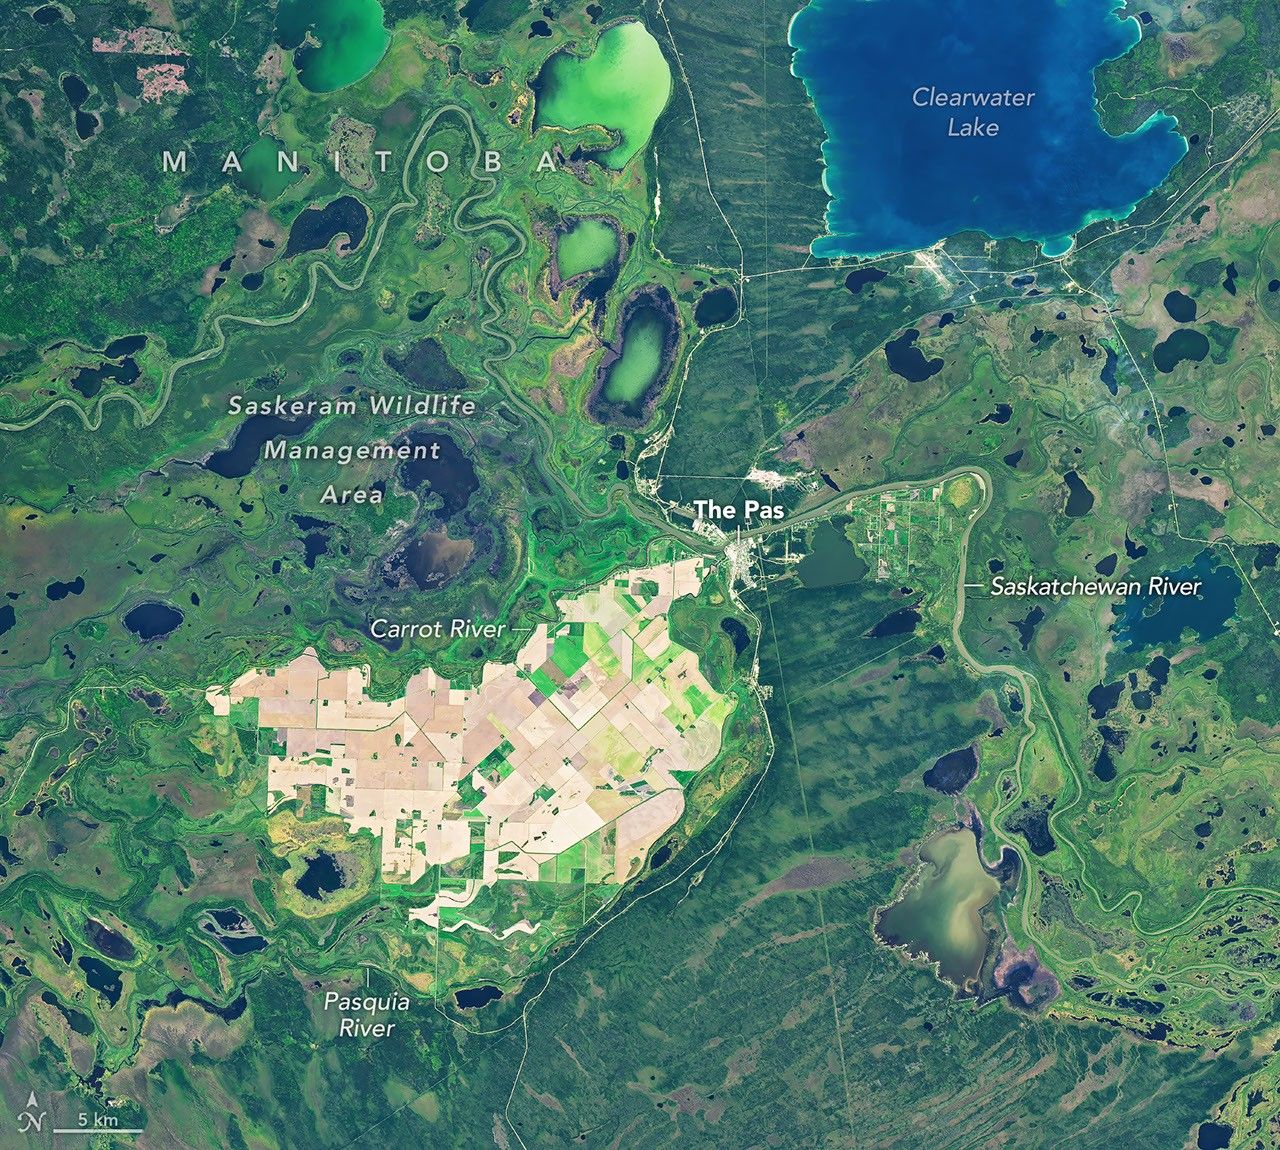
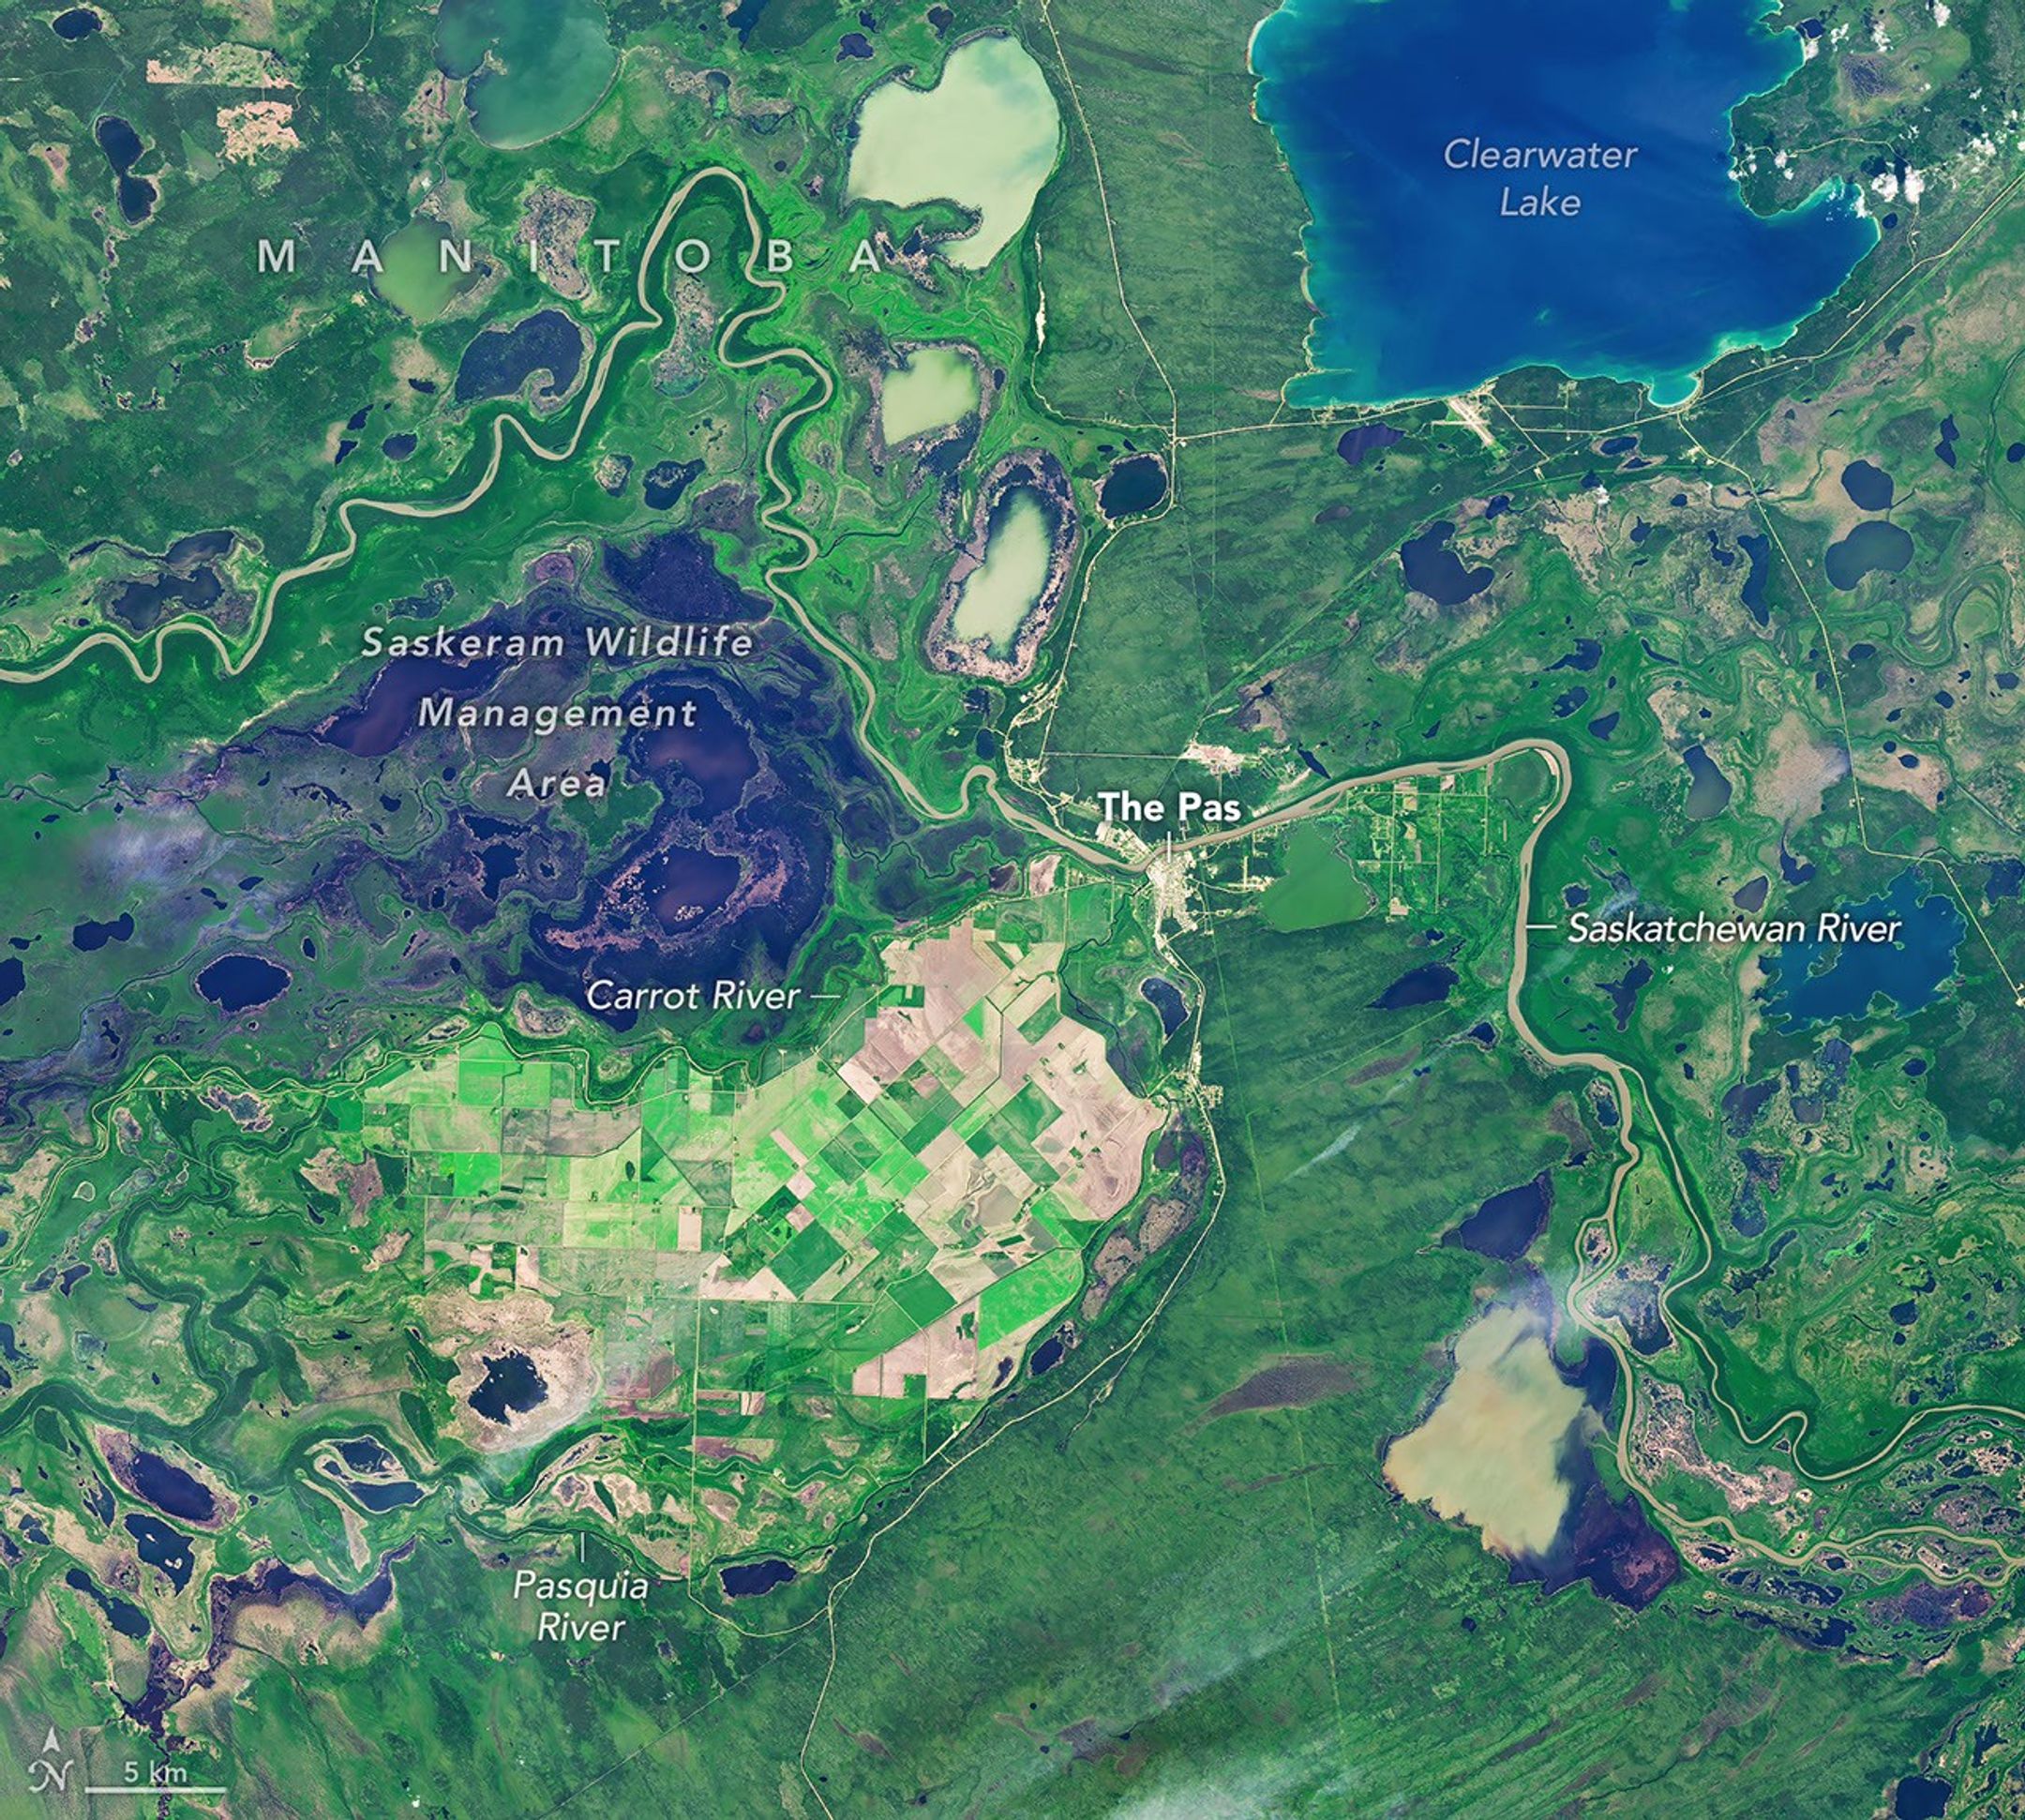
Farmland across the Carrot River Valley, Manitoba’s northernmost agricultural area, moves from summer growth into harvest season in images captured on July 2, 2026 (left), and September 21, 2026 (right), with the OLI (Operational Land Imager) on the NASA-USGS Landsat 9 and Landsat 8 satellites, respectively. NASA Earth Observatory images by Michala Garrison.

Much of the Saskatchewan River Delta, a large inland delta that straddles the Canadian provinces of Saskatchewan and Manitoba, is too wet for extensive farming. But amid the delta’s winding channels, lakes, and marshes, an “island” of straight-edged fields breaks up the curvy contours. These fields, west of the town of The Pas, make up Manitoba’s northernmost agricultural area.

Known as the Carrot River Valley (Pasquia Area Settlement), the area lies within the Rural Municipality of Kelsey. Its actively farmed land spans more than 40,000 hectares (100,000 acres) between the Carrot and Pasquia rivers—tributaries of the Saskatchewan River—and is surrounded by wetlands, including the marshes of the Saskeram Wildlife Management Area to the north.

These images show the valley at two points during the 2026 growing season: on July 2 (left) and September 21 (right). They were acquired with the OLI (Operational Land Imager) on the NASA-USGS Landsat 9 and Landsat 8 satellites, respectively.

Landsat data feed into the Agriculture and Agri-Food Canada annual crop inventory. The 2026 inventory was not released as of late September, but the 2025 map shows that farmers in the Carrot River Valley grew mostly canola and spring wheat that year, along with small patches of Canary seed.

The July 2026 image shows green crops across many of the valley’s fields. Planting in the area, part of Manitoba Agriculture’s Northwest crop reporting region, began later than in parts of the region to the south because of wet conditions. Still, fertile soils and long summer days at this northern latitude can help crops grow quickly.

By the time of the September image, the pattern had flipped. The Pas recorded little rainfall in the preceding week (1.6 millimeters, or 0.06 inches), while wetter weather elsewhere in the Northwest region (up to 43.9 millimeters, or 1.7 inches) held up the harvest. By then, farmers across the region had harvested about 10 percent of the canola and 50 percent of the spring wheat.

Managing water has long been a challenge in the valley. In the 1950s, a major flood control and drainage project got underway, and farming in the area today still depends on diking and pumping for agricultural flood protection.

NASA Earth Observatory images by Michala Garrison, using Landsat data from the U.S. Geological Survey. Story by Kathryn Hansen.

Downloads

A satellite image captured in summer shows farm fields in a patchwork of green and brown, surrounded by green wetlands dotted with dark patches of open water.

July 2, 2026

JPEG (17.36 MB)

The same area in autumn shows many of the farm fields are now brown, and the surrounding wetlands hold less water.

September 21, 2026

JPEG (18.10 MB)

References & Resources

You may also be interested in:

Stay up-to-date with the latest content from NASA as we explore the universe and discover more about our home planet.

Fans of the Arctic

3 min read

Sediment eroded from ice-capped mountains splays out across a broad river valley on Russia’s Severny Island.

Article

Olympic Mountain Glory

4 min read

Snow-capped mountains carved by deep river valleys preside over northwestern Washington state.

Article

Wild, Scenic, and Increasingly Rusty

5 min read

Orange streams are now being spotted in hundreds of watersheds in permafrost areas throughout Alaska’s Brooks Range.

Article
❌