Reading view

There are new articles available, click to refresh the page.

How 2 US, European Satellites Are Studying Hurricanes During El Niño

5 min read

Preparations for Next Moonwalk Simulations Underway (and Underwater)
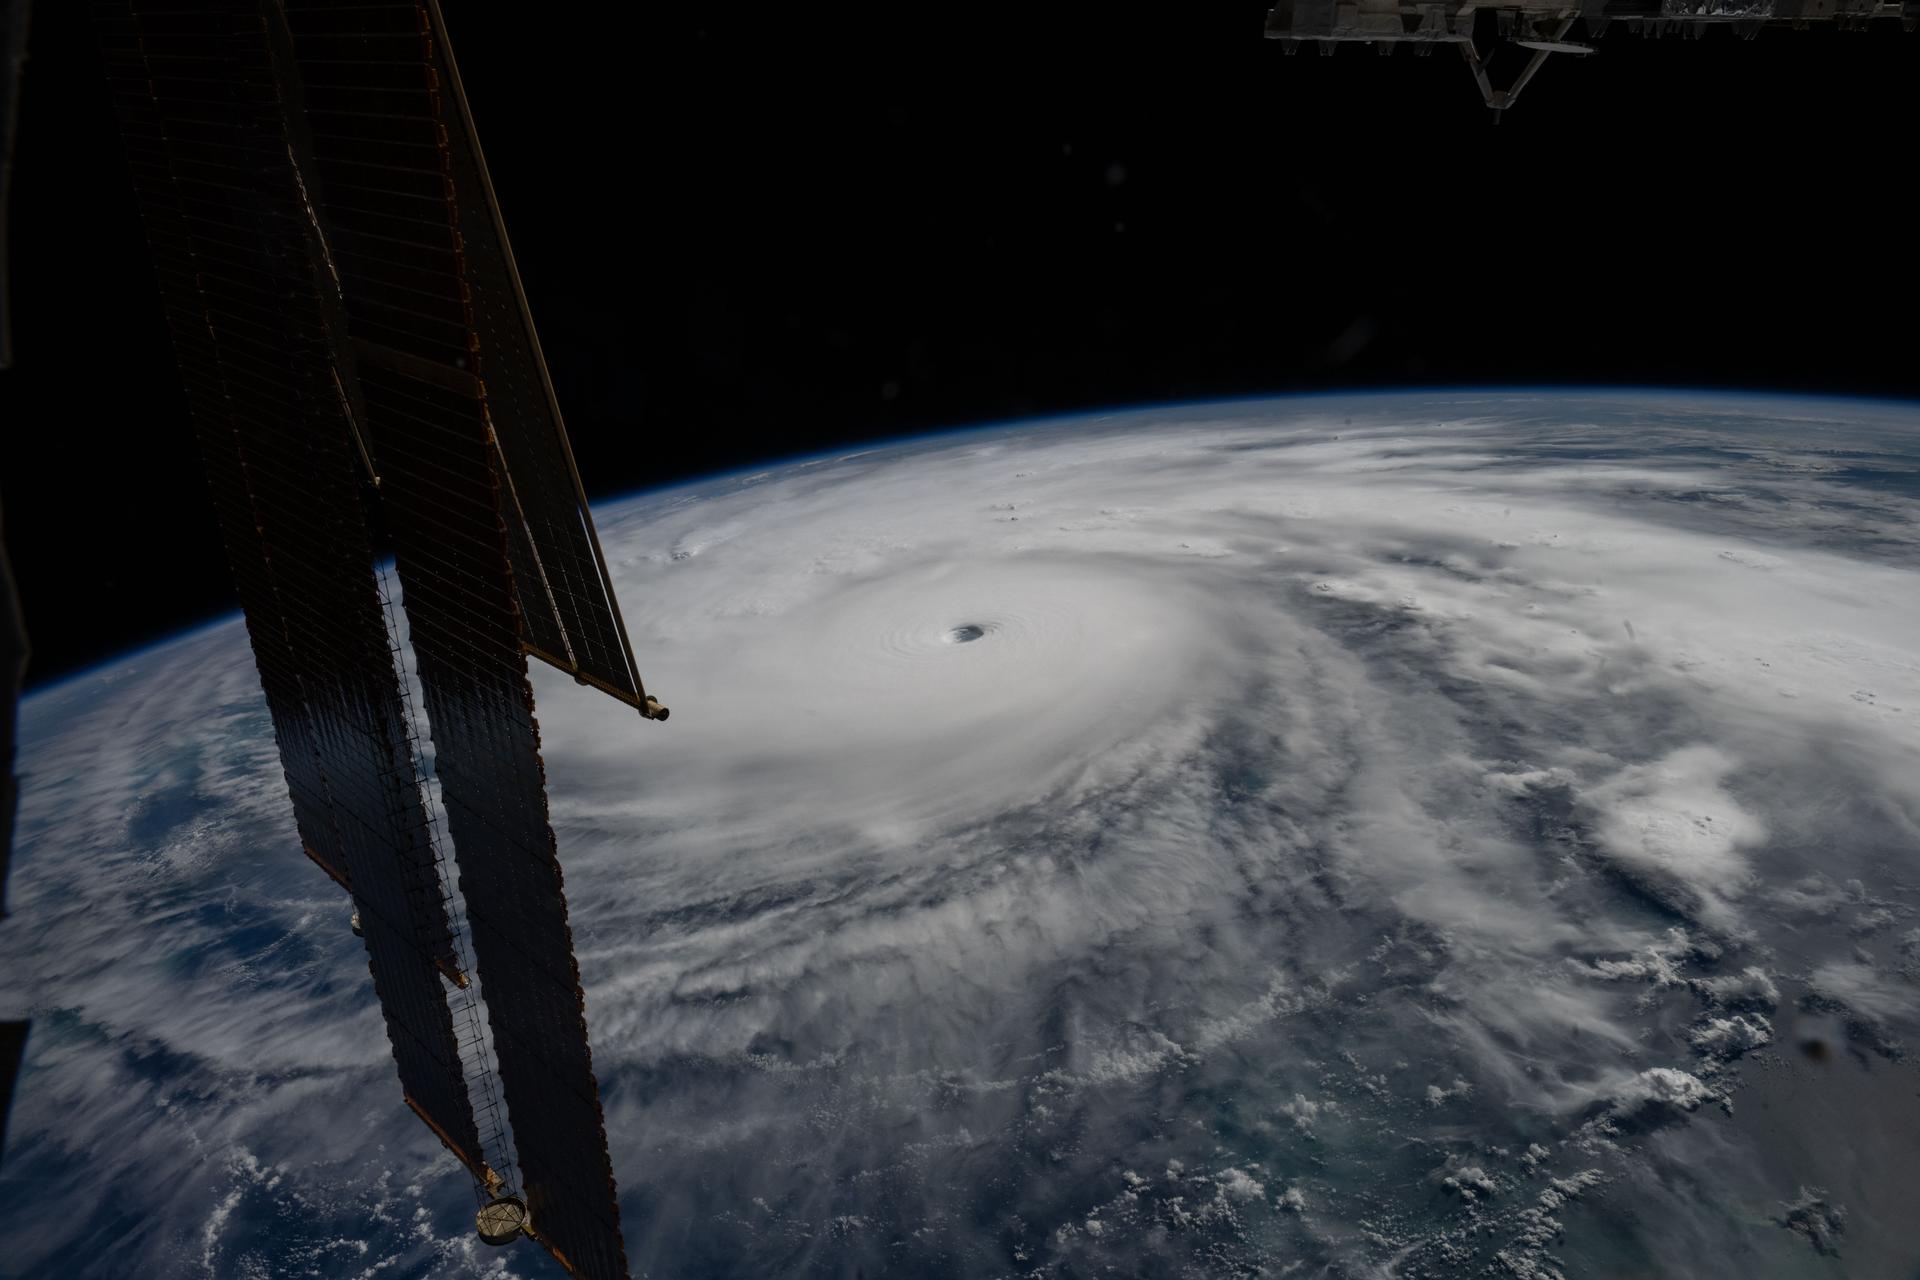
Category 5 Hurricane Melissa, one of the most powerful storms to strike the Caribbean in recent history, is pictured about 50 miles south of Jamaica in this photograph from the International Space Station as it orbited 262 miles above the Yucatan Peninsula.
Hurricane Melissa is seen 50 miles south of Jamaica in this photograph taken from the International Space Station on Oct. 28, 2025.
NASA

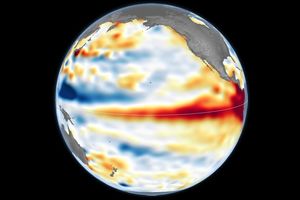
Last November, NASA and its European partners launched the Sentinel-6B satellite to improve hurricane forecasts, help protect infrastructure, and benefit commercial industries, including shipping. The satellite now is flying 30 seconds behind its predecessor, Sentinel-6 Michael Freilich. Both satellites are providing precise sea level height measurements during what oceanographers expect to be a historic El Niño, a naturally occurring oceanic phenomenon in which warmer-than-usual Pacific waters shift global weather patterns.

The two satellites make up the Copernicus Sentinel-6/Jason-CS (Continuity of Service) mission, the latest in a series of ocean-observing radar altimetry missions that have been monitoring Earth’s changing seas continuously since the early 1990s.

The data each satellite is collecting will not only allow scientists to better understand this year’s El Niño but will also help them create more accurate hurricane predictions.

“This El Niño was a late-bloomer,” said Josh Willis, Sentinel-6B’s project scientist at NASA’s Jet Propulsion Laboratory in Southern California. “It didn’t kick off until the middle of the year and is just now reaching a strength similar to what we’ve seen in the satellite record during significant El Niños in 1997 and 2015. We expect it to be big, and it’s already having big impacts.”

El Niños generally scramble weather patterns tied to rainfall and storms, including hurricanes. They also redistribute heat in the ocean, which affects sea level. Normally, Earth’s warmest ocean waters sit along the equator in the western Pacific. During El Niño, weakened winds, which usually blow westward along the equator, result in heat spreading east toward South America. The change in ocean heat shifts hurricane activity from the Atlantic to the Pacific Ocean.

Predicting hurricane strength

On July 15, Sentinel-6B began delivering low-latency data to scientists that could be used for weather predictions. That data will take some time to work its way into the research models on which meteorologists and climate scientists rely, but when it does, those improved models could save lives.

Data from Sentinel-6 satellite missions feeds into hurricane tracking algorithms used by federal and state agencies. Those predictions can activate disaster response efforts, mobilizing resources ranging from sandbag placement to National Guard activation. They also can lead to evacuation orders that require quick but well-informed decisions about logistics at a local level. More severe events may require engaging larger organizations, such as the Federal Emergency Management Agency.

A tropical storm can take a week or more to become a hurricane and make its way to a coastline, but a hurricane can rapidly intensify in the 48 hours prior to landfall, leaving planners little time to prepare.

“Hurricanes have been known to speed up quickly at the last moment, so the window in which to decide what to do is short,” said Deirdre Byrne, an oceanographer and altimetry expert with the National Oceanic and Atmospheric Administration (NOAA). “The goal is to forecast how much and how rapidly intensification will happen so that officials can make the right calls.”

Byrne oversees one of the country’s most crucial hurricane forecasting algorithms, NOAA’s Satellite Ocean Heat Content Suite, which has been operating since 2012.

Each Sentinel-6 satellite measures ocean height, as well as the size of waves and marine wind speed, using a radar altimeter, which bounces thousands of radar pulses a second off the crests and troughs of waves. Ocean height varies from place to place and provides insight into the ocean’s heat content, since warm water expands. That, in turn, helps forecast how fast hurricanes will grow.

The satellites each carry a second instrument, called the Global Navigation Satellite System – Radio Occultation (GNSS-RO), which measures atmospheric properties, such as humidity, pressure, and temperature.

Among the measurements Sentinel-6 is gathering, Byrne is most anticipating the ocean height data, which she plans to begin incorporating into the current Satellite Ocean Heat Content Suite algorithm by the end of the year.

“In terms of data quality, the Sentinel-6 missions are unparalleled,” Byrne said.

Together, the missions are also extending a precise dataset deep into its fourth decade. This record of sea level observations traces back to the TOPEX/Poseidon mission, which launched in 1992, and continues through to the present day with Sentinel-6 Michael Freilich. Sentinel-6B will take over for its predecessor as the reference satellite for global sea level measurements later this year.

“The key is consistency, measuring the same way, every time,” said Severine Fournier, Sentinel-6B deputy project scientist, JPL. “That’s what lets us predict hurricanes, and, in turn, protect coastal communities and infrastructure.”

More about Sentinel-6B

Sentinel-6 Michael Freilich, named after a former director of NASA’s Earth Science Division, is one of two satellites that compose the Copernicus Sentinel-6/Jason-CS mission.

Sentinel-6/Jason-CS, a part of the European Union’s Earth observation program called Copernicus, was jointly developed by ESA (European Space Agency), EUMETSAT (European Organisation for the Exploitation of Meteorological Satellites), NASA, and NOAA, with funding support from the European Commission and technical support on performance from the French space agency CNES (Centre National d’Études Spatiales). Spacecraft monitoring and control, as well as the processing of all the altimeter science data, is carried out by EUMETSAT on behalf of the European Union’s Copernicus Programme, with the support of all partner agencies.

NASA JPL, a division of Caltech in Pasadena, contributed three science instruments for each Sentinel-6 satellite: the Advanced Microwave Radiometer, the GNSS-RO, and the Laser Retroreflector Array. NASA also contributed launch services, ground systems supporting operation of the agency’s science instruments, the science data processors for two of these instruments, and support for the United States members of the international Ocean Surface Topography Science Team.

For more about Sentinel-6B, visit:

https://science.nasa.gov/mission/sentinel-6B

-end-

Media Contacts

Andrew Good / Andrew Wang
Jet Propulsion Laboratory, Pasadena, Calif.
818-393-2433 / 626-379-6874
andrew.c.good@jpl.nasa.gov / andrew.wang@jpl.nasa.gov

2026-060

A Trio of Tropical Cyclones in the Pacific

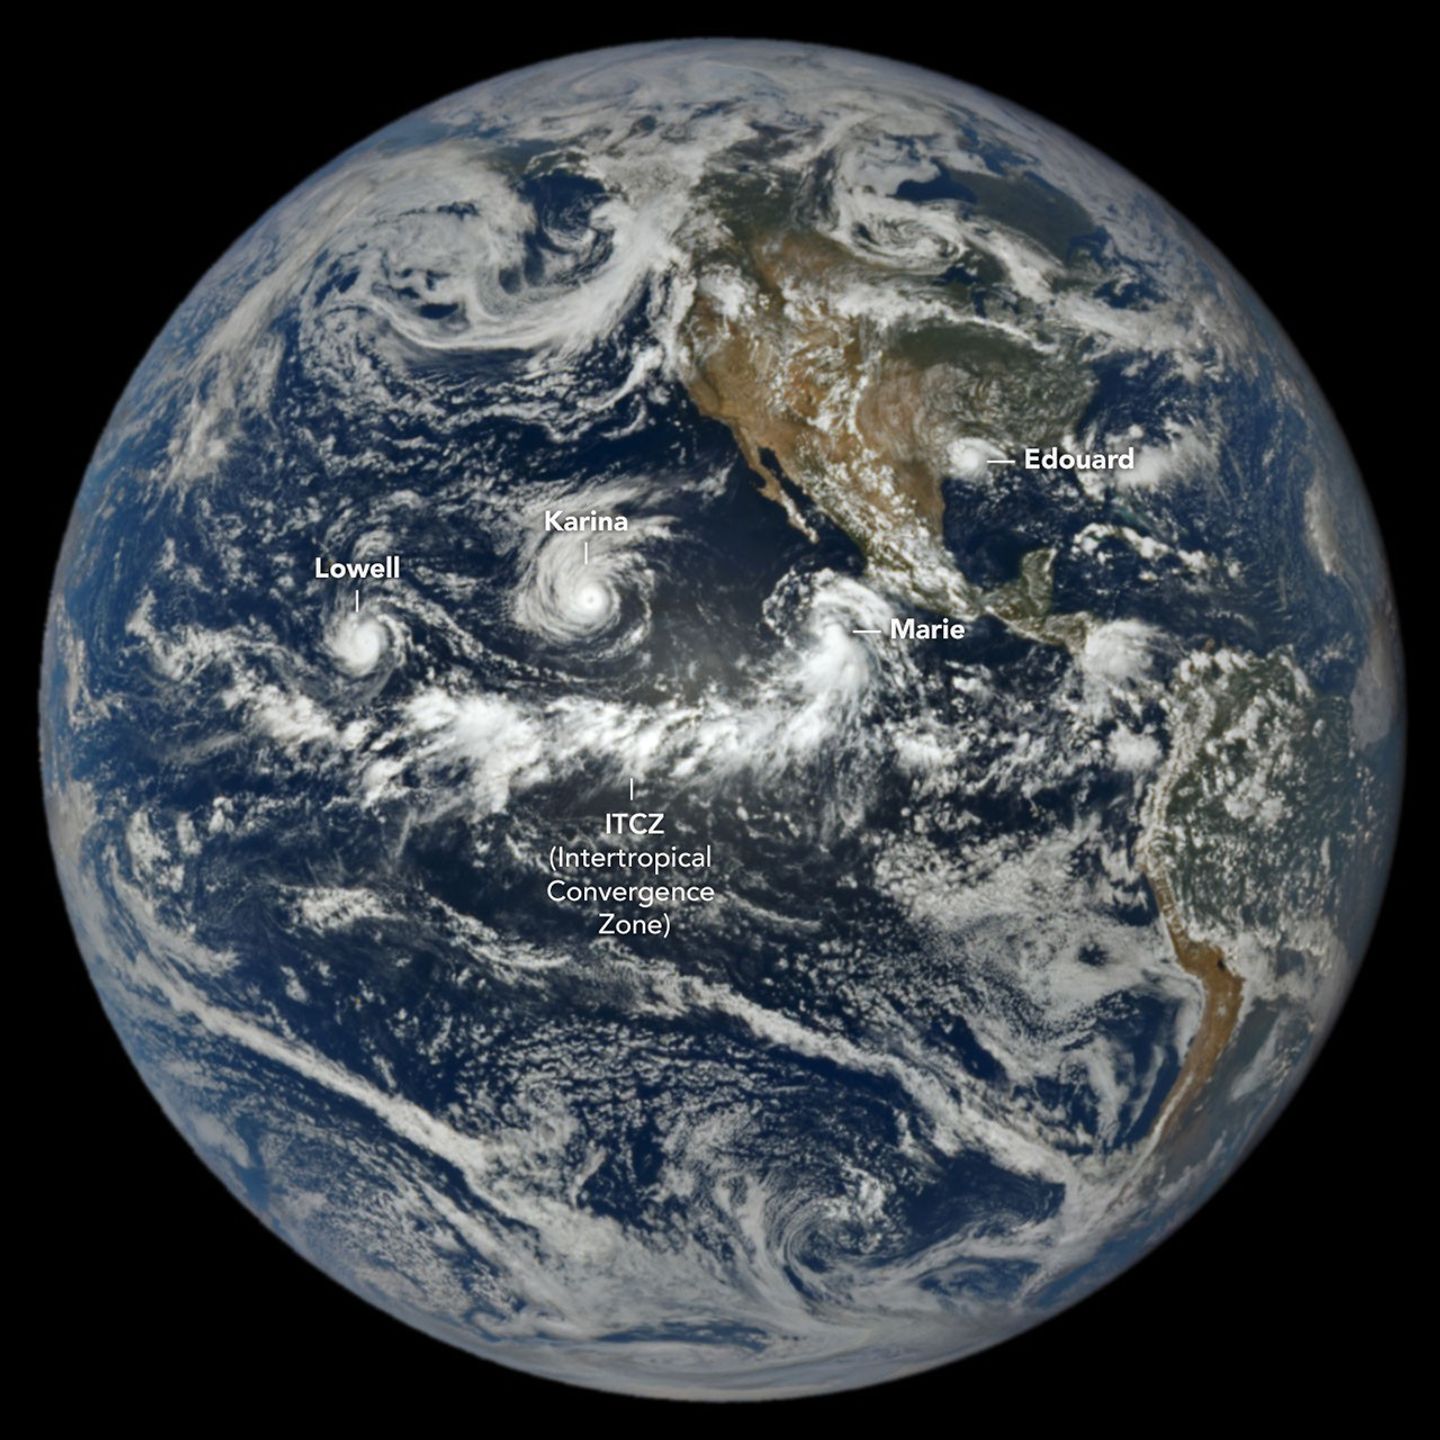
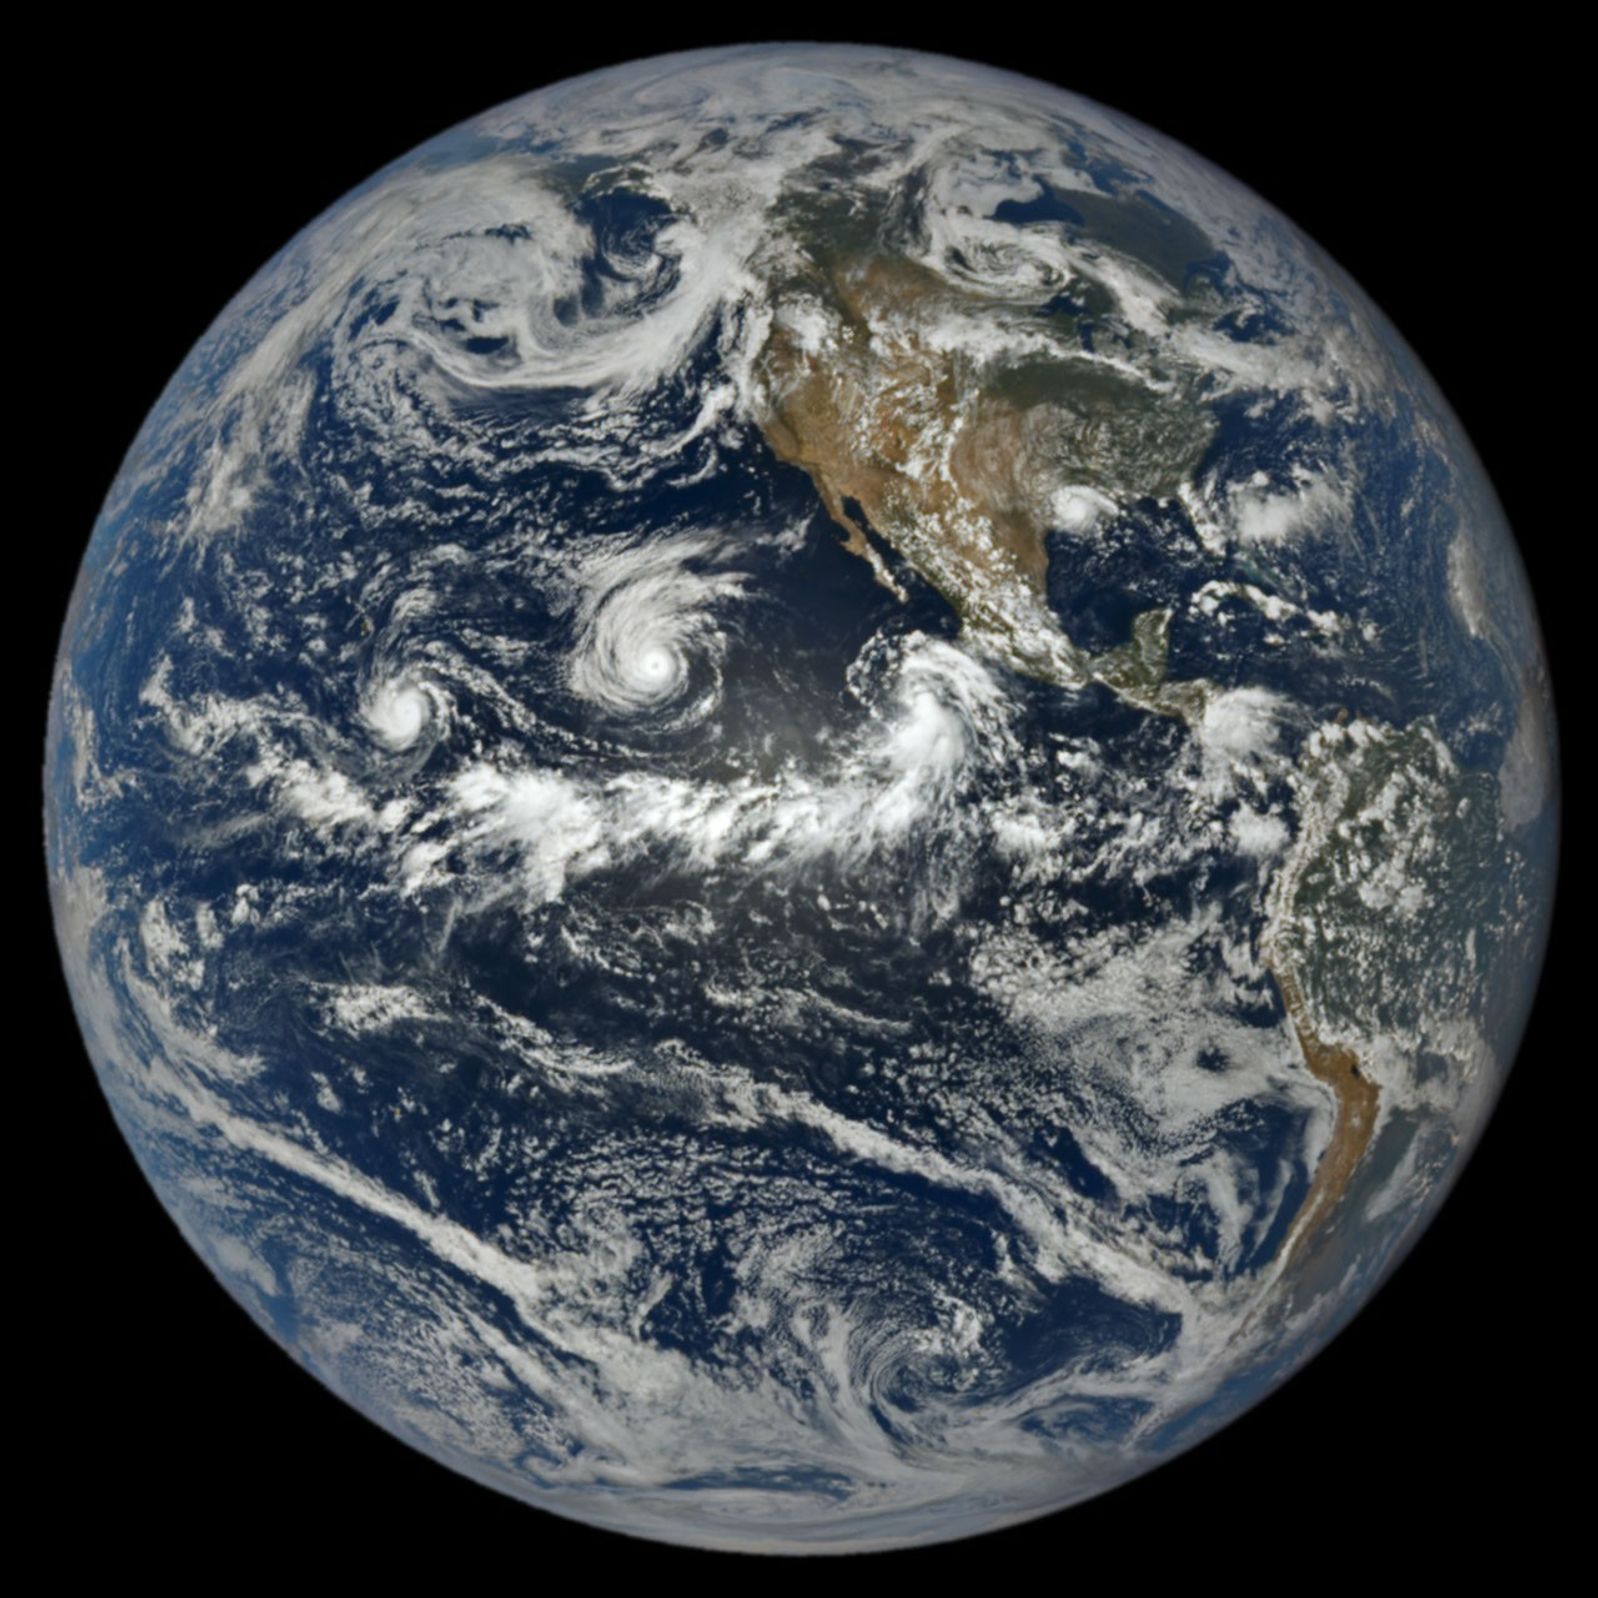
In a full-disk satellite view of Earth, three tropical cyclones—named Lowell, Karina, and Marie—swirl above the blue waters of the Pacific Ocean and to the west of Central America.

When hurricane forecasters released their seasonal outlooks in spring 2026, the El Niño brewing in the Pacific contributed to predictions of below-normal activity in the Atlantic basin but above-normal activity in the northeastern and central Pacific basins. In early September, near the climatological peak of hurricane season, those spring outlooks were on target, with the eastern Pacific buzzing with activity and the Atlantic notably quiet.

As of September 3, the Northeast Pacific had produced 15 named storms and six hurricanes, well above the norm for that point in the season. The Atlantic basin, meanwhile, laboring under unfavorable wind shear conditions, had produced just five named storms and no hurricanes. El Niño typically enhances hurricane activity in the eastern and central Pacific basins because of the unusually warm water temperatures it brings to those parts of the ocean. It tends to suppress hurricane activity in the Atlantic basin by shifting large-scale circulation patterns in a way that makes it harder to sustain storms there.

At 1:14 p.m. Pacific Daylight Time (20:14 Universal Time) on September 1, NASA’s EPIC (Earth Polychromatic Imaging Camera) on the DSCOVR (Deep Space Climate Observatory) satellite captured an image of three tropical cyclones churning simultaneously in the Pacific, along with one in the Atlantic. A band of clouds and thunderstorms associated with the Intertropical Convergence Zone (ITCZ) is visible to the south of the storms. The spacecraft was nearly 1 million miles from Earth and just shy of 93 million miles from the Sun when the image was acquired.

The trio of storms in the Pacific were Lowell, Karina, and Marie. Of the three, Lowell became the strongest, with winds reaching category 5 strength for several hours on September 2. Around the same time, Karina, spinning a few thousand kilometers to the east, achieved category 4 strength, a rare case of category 4 and 5 hurricanes occurring simultaneously in the area. Marie, spinning southwest of Baja California, was still a tropical storm when the image was acquired but was strengthening as it moved northwest.

In the Atlantic, Tropical Storm Edouard was visible to EPIC over Louisiana and Texas, shortly after the short-lived storm made landfall. It brought torrential rains and strong winds that downed trees and power lines. Some areas received 15 to 24 inches (38 to 61 centimeters) of rain, according to National Weather Service meteorologists.

As of September 3, the Atlantic basin’s total accumulated cyclone energy (ACE) index was 4.4, about 9 percent of normal for that date, according to statistics compiled by Colorado State University meteorologists. Meanwhile, the Northeast Pacific basin’s ACE was 130, about 50 percent above normal. The ACE index incorporates both the intensity and longevity of storms, making it easier to compare individual storms and seasons.

Several NASA Earth-observing platforms provide data that can aid in emergency preparedness before landfall and damage assessment and response afterward. Use the “Events” tab on NASA’s Worldview browser to track current hurricanes and explore related NASA data products.

NASA Earth Observatory image by Lauren Dauphin, using data from DSCOVR EPIC. Story by Adam Voiland.

Downloads

In a full-disk satellite view of Earth, three tropical cyclones—named Lowell, Karina, and Marie—swirl above the blue waters of the Pacific Ocean and to the west of Central America.

September 1, 2026

JPEG (1.49 MB)

References & Resources

You may also be interested in:

Stay up-to-date with the latest content from NASA as we explore the universe and discover more about our home planet.

Lala Batters Hawaii

3 min read

The powerful storm delivered extreme rainfall and damaging winds to the state, passing the Island of Hawaiʻi as a category…

Article

Tropical Storm Arthur

2 min read

The first named storm of the 2026 Atlantic hurricane season brought intense rainfall and the threat of flash flooding to…

Article

El Niño Is Underway

4 min read

Satellite observations of sea surface height indicated that the 2026 event continued to strengthen in early June.

Article

Lala Batters Hawaii

August 16, 2026
August 15, 2026
The spiraling clouds of a tropical storm are centered near the Hawaiian island of Kauaʻi.
NASA Earth Observatory / Lauren Dauphin
The spiraling clouds of a hurricane appear near the Hawaiian Islands. Its eye is just south of the Island of Hawaiʻi.
NASA Earth Observatory / Lauren Dauphin
The spiraling clouds of a tropical storm are centered near the Hawaiian island of Kauaʻi.
NASA Earth Observatory / Lauren Dauphin
The spiraling clouds of a hurricane appear near the Hawaiian Islands. Its eye is just south of the Island of Hawaiʻi.
NASA Earth Observatory / Lauren Dauphin
August 16, 2026
August 15, 2026
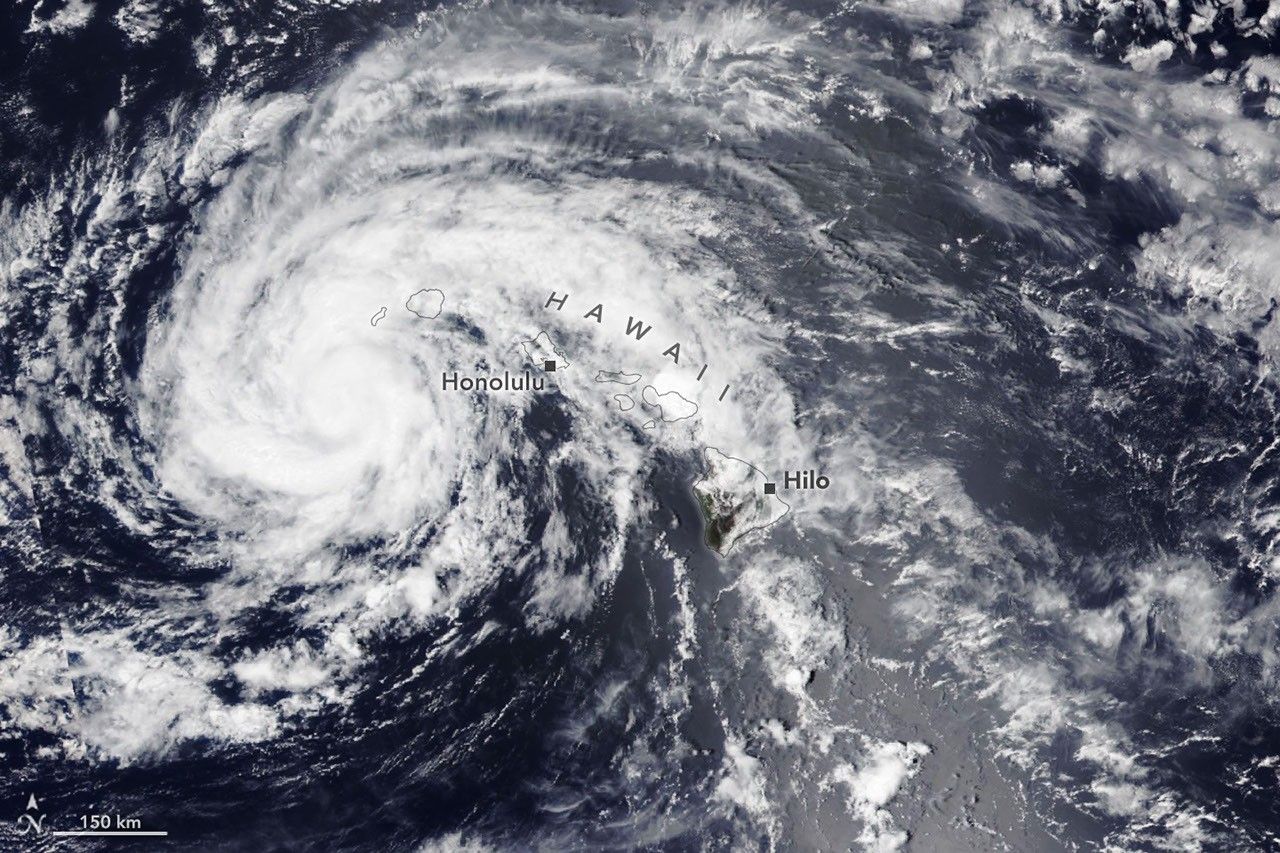
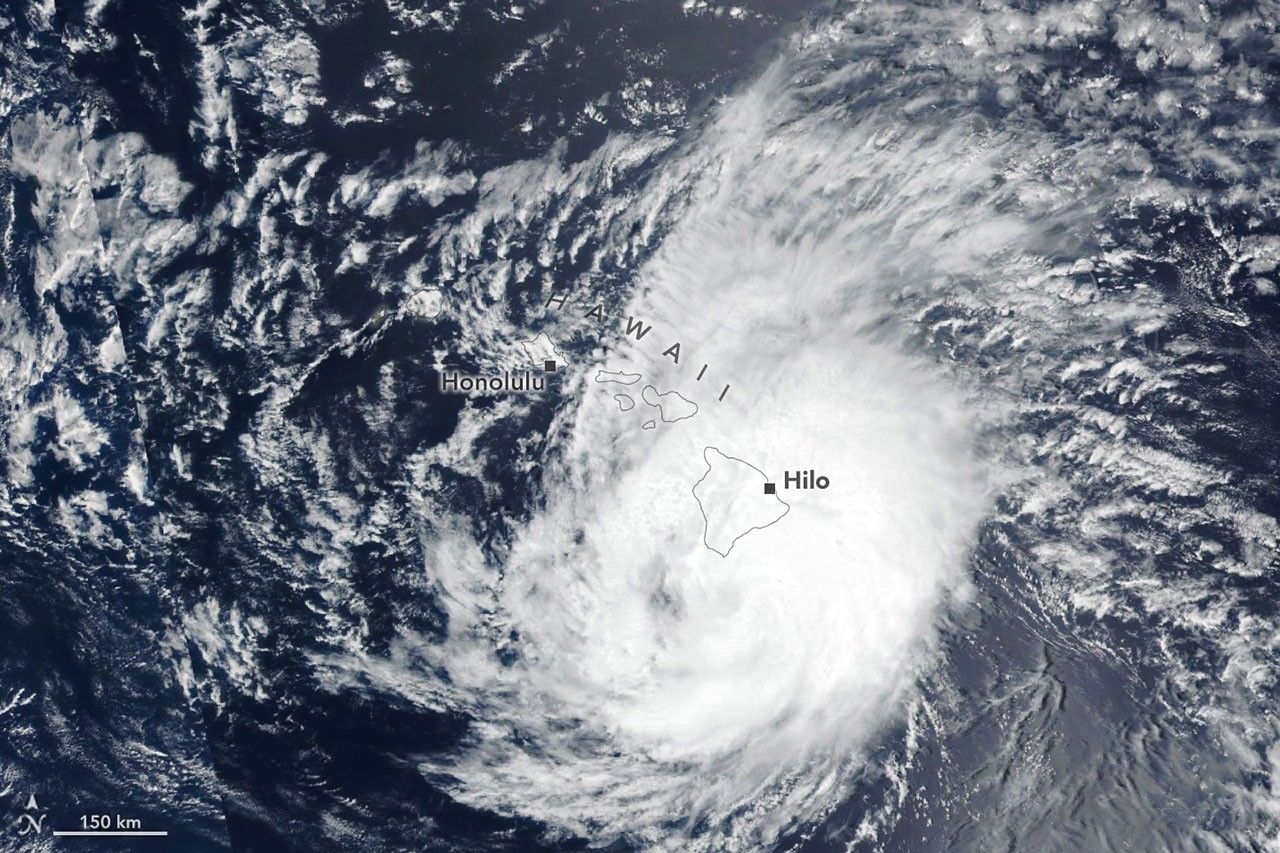
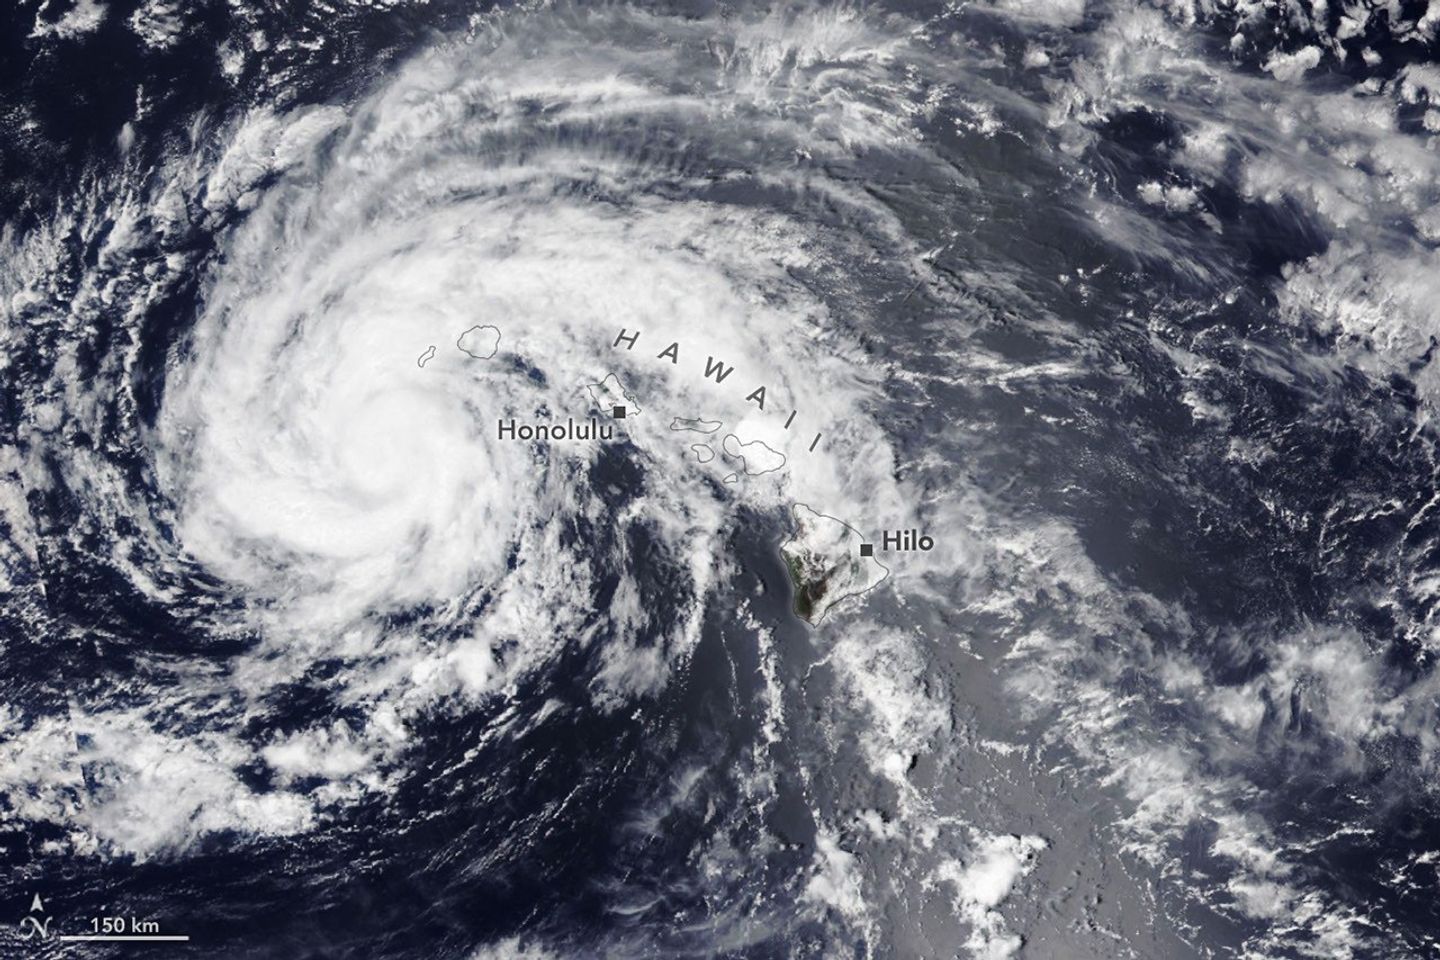
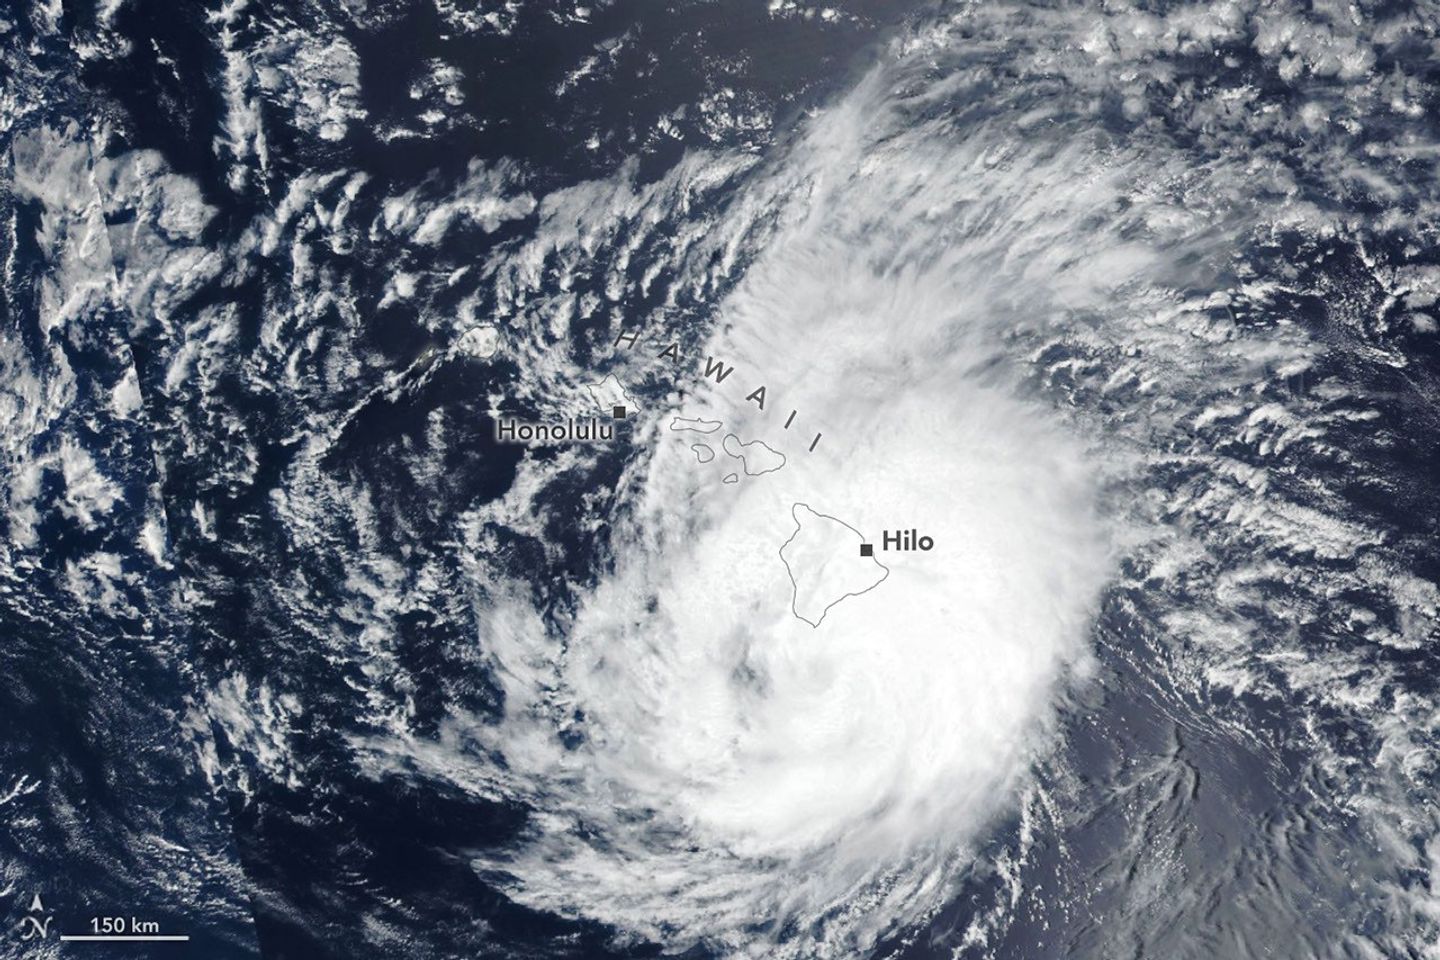
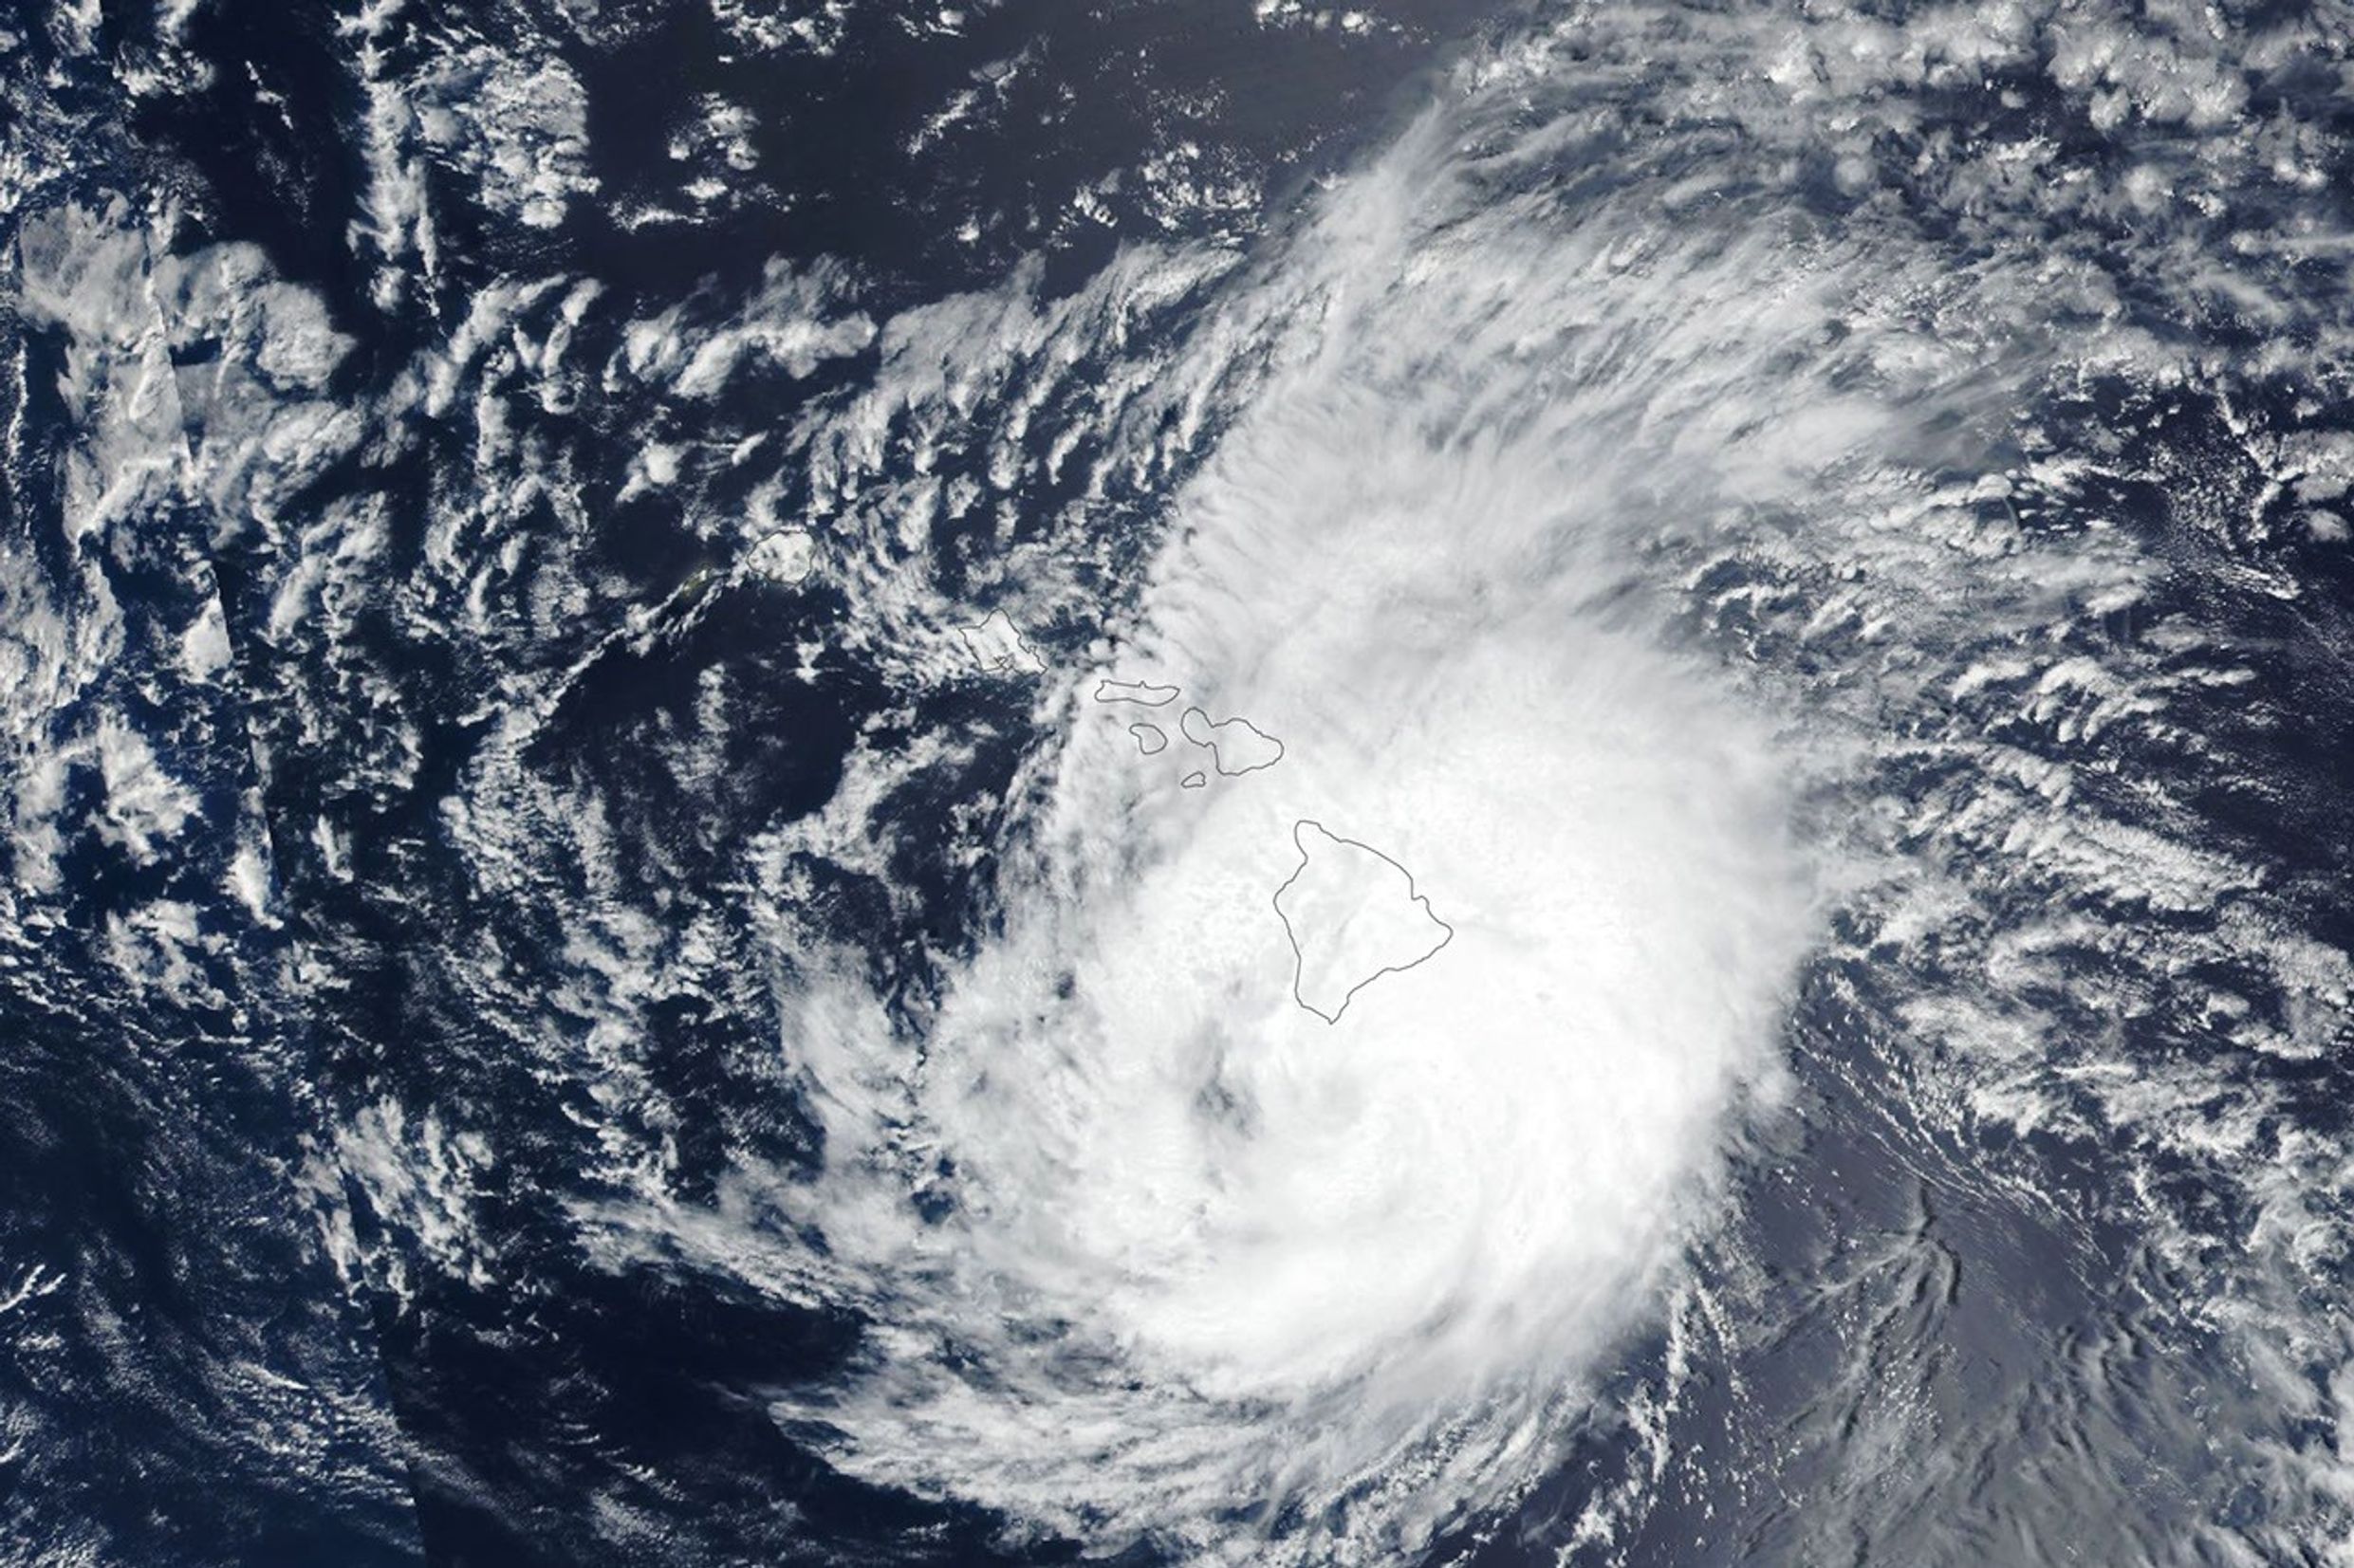
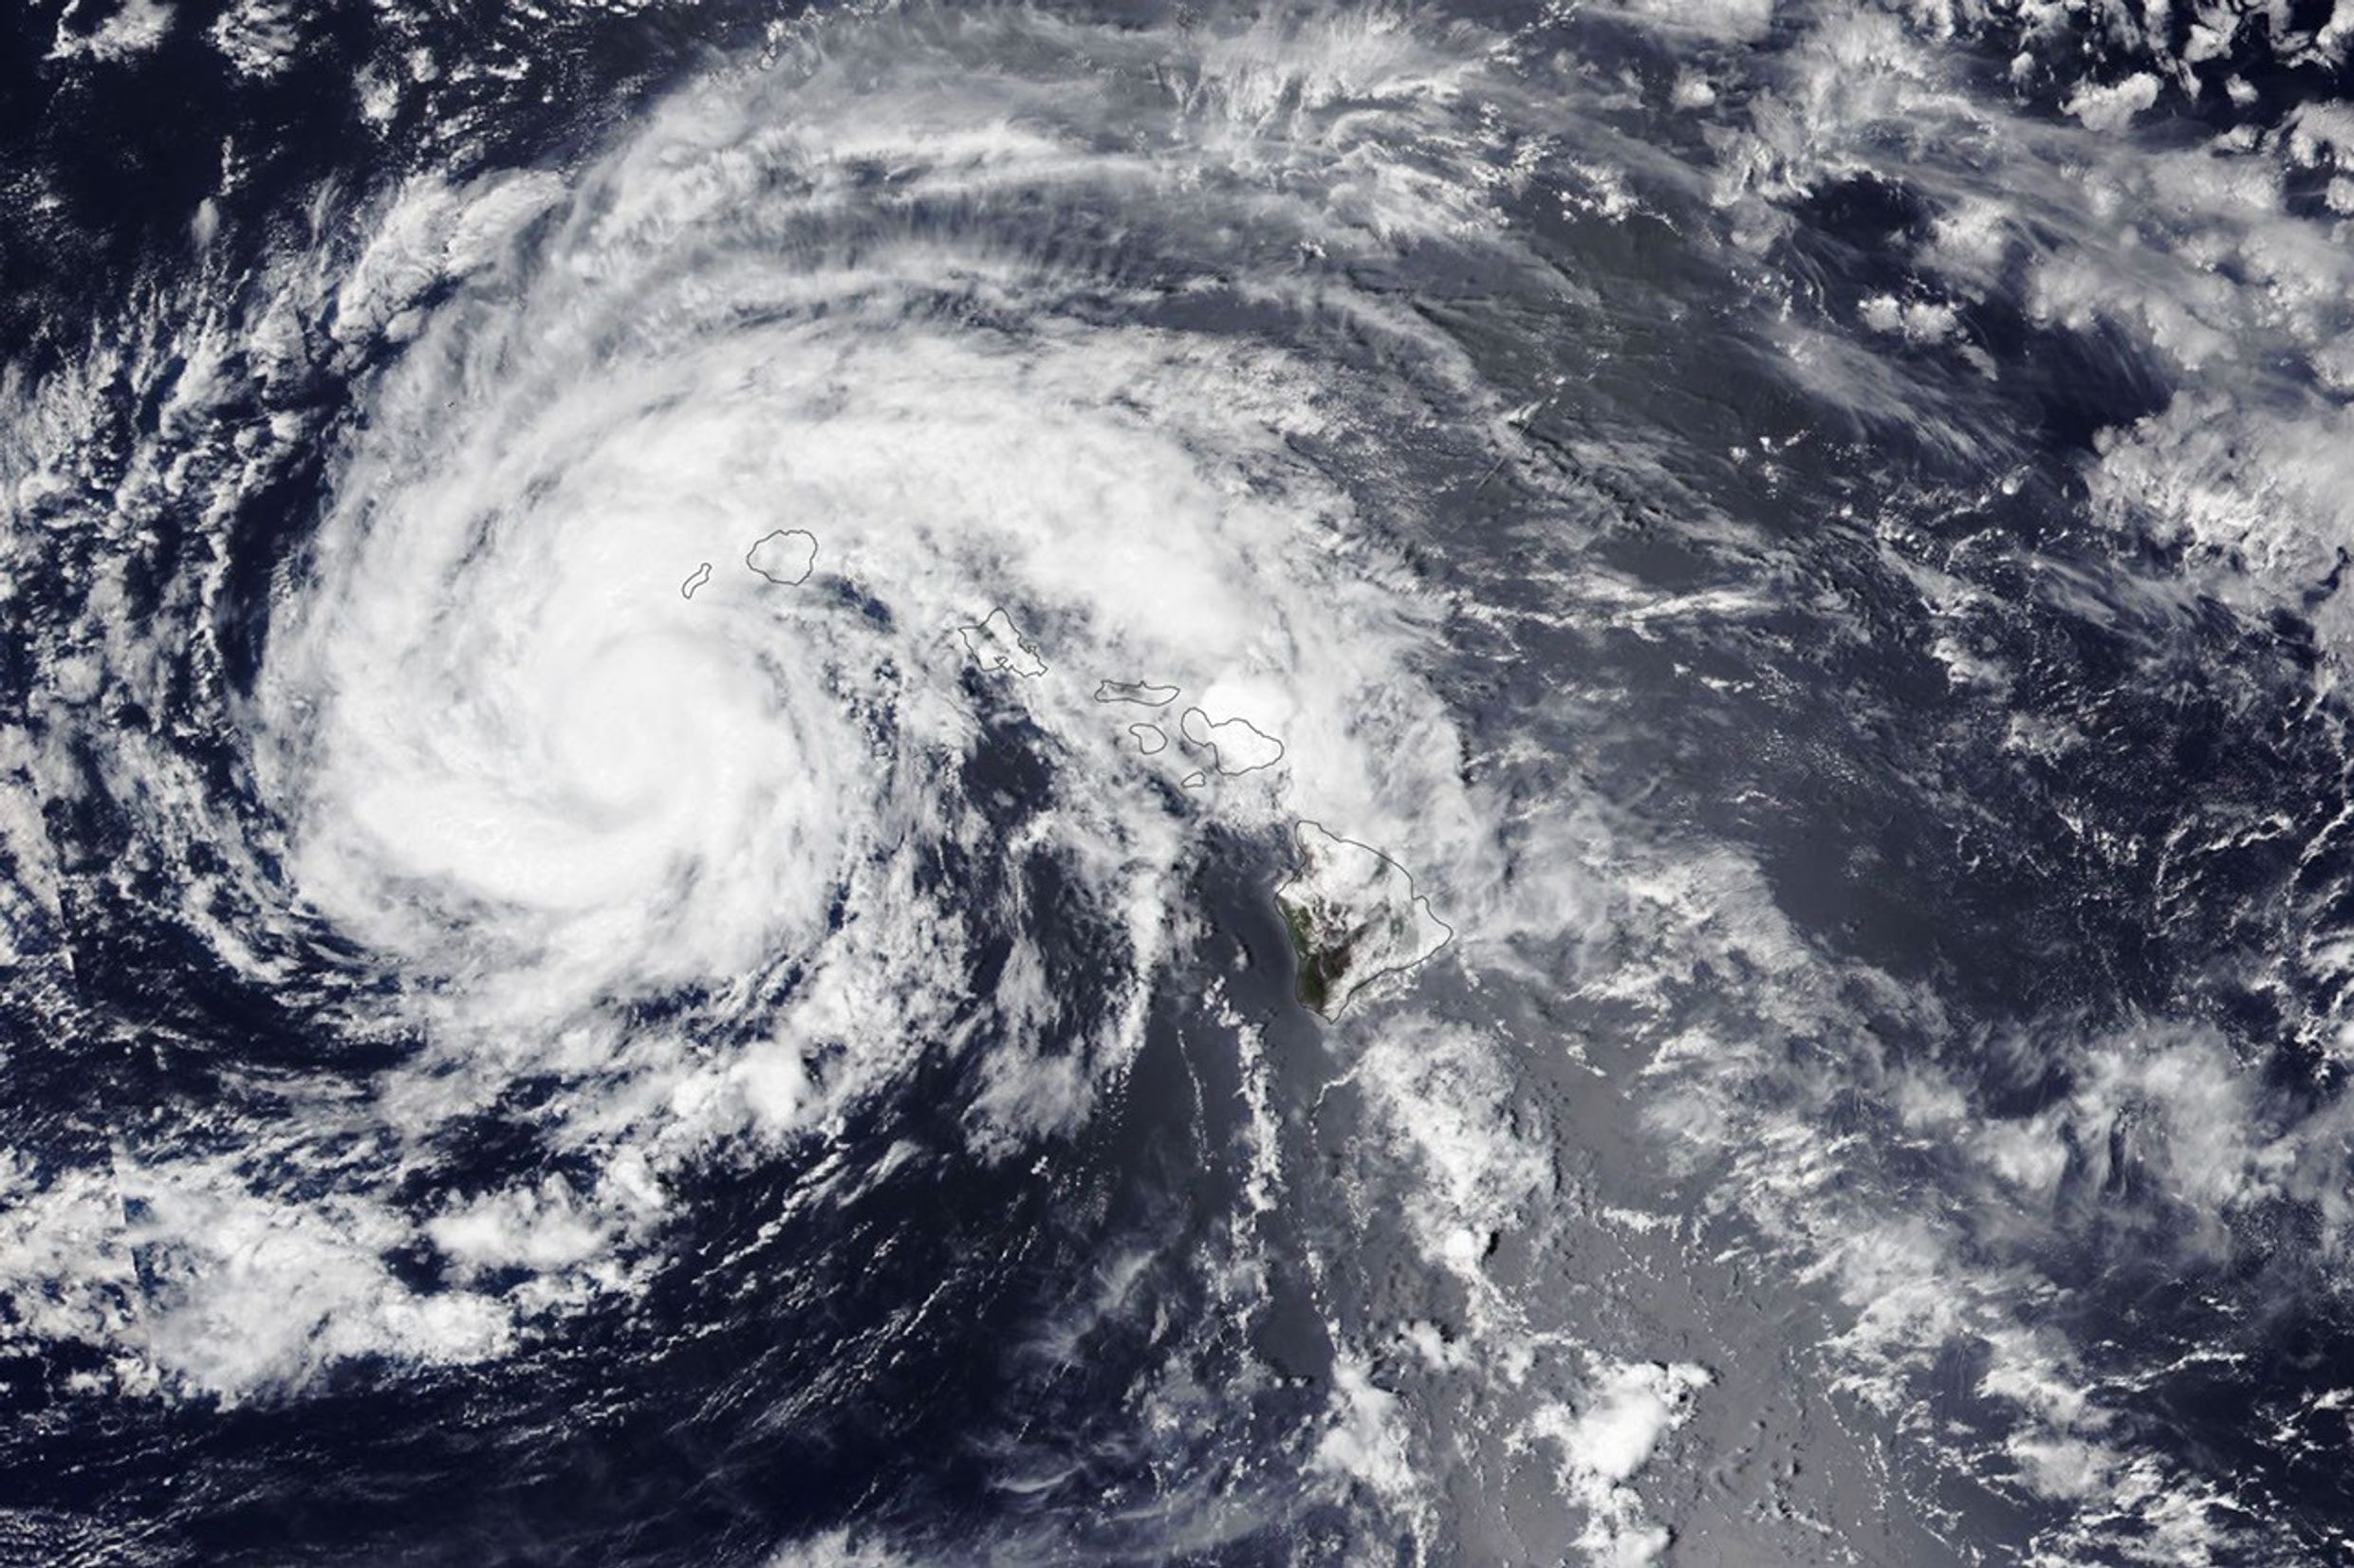
Lala skirts south of the Island of Hawaiʻi as a category 1 hurricane in the right image, acquired by the VIIRS (Visible Infrared Imaging Radiometer Suite) on the Suomi NPP satellite on August 15, 2026, at about 1:45 p.m. Hawaii Standard Time (23:45 Universal Time). The storm decreased in intensity while tracking northwest and was a tropical storm when the VIIRS on the NOAA-20 satellite captured the left image about 24 hours later. NASA Earth Observatory images by Lauren Dauphin.

The Island of Hawaiʻi narrowly avoided a direct landfall by Hurricane Lala in mid-August 2026. The storm nonetheless delivered serious damage as it passed just south of the island on August 15 (above, right) as a category 1 storm on the Saffir-Simpson wind scale.

Lala brought rainfall totals exceeding 20 inches (50 centimeters) to parts of the island, causing flash flooding and ongoing mudflow risks. The highest rainfall total for the storm—43.55 inches (110.6 centimeters) as of the morning of August 17—was recorded at Laupāhoehoe, on the coast northwest of Hilo. Lala downed trees, damaged bridges, and knocked homes off their foundations. Coastal areas were pummeled by large waves, while the summit of Mauna Kea, over 13,000 feet (4,000 meters) above sea level, experienced blizzard conditions.

By early afternoon on August 16, when the other image (left) was acquired, the storm had tracked northwest, roughly parallel to the island chain, and was southwest of Kauaʻi. Lala had decreased in intensity to a tropical storm, with sustained winds of 65 miles (105 kilometers) per hour, according to the National Hurricane Center.

While the Island of Hawaiʻi took the brunt of the storm, other islands also saw destructive effects. Strong winds caused widespread power outages, with more than 220,000 customers statewide without power as of the afternoon of August 16, according to news reports. Across the islands, wind and rain damaged infrastructure, and floodwaters and debris rendered roads impassable.

It has been an active tropical cyclone season in the Eastern Pacific so far in 2026, meteorologists note, consistent with what scientists expect during an El Niño, which has been underway as of mid-June. Warm water in the equatorial Pacific—the hallmark of El Niño—and the moisture and energy it transfers to the atmosphere help fuel nascent tropical storms. Lack of wind shear, another typical El Niño pattern in this region, also encourages tropical storms to develop and strengthen. The Atlantic hurricane season, in contrast, has been relatively calm, as greater wind shear over the Atlantic Ocean and Caribbean Sea during an El Niño inhibits hurricane formation by dissipating the upward motion of heat.

NASA Earth Observatory images by Lauren Dauphin, using VIIRS data from NASA EOSDIS LANCEGIBS/Worldview, and the Joint Polar Satellite System (JPSS). Story by Lindsey Doermann.

Downloads

The spiraling clouds of a hurricane appear near the Hawaiian Islands. Its eye is just south of the Island of Hawaiʻi.

August 15, 2026

JPEG (2.54 MB)

The spiraling clouds of a tropical storm are centered near the Hawaiian island of Kauaʻi.

August 16, 2026

JPEG (2.39 MB)

References & Resources

You may also be interested in:

Stay up-to-date with the latest content from NASA as we explore the universe and discover more about our home planet.

Tropical Storm Arthur
2 min read

The first named storm of the 2026 Atlantic hurricane season brought intense rainfall and the threat of flash flooding to…

Article
Typhoon Jangmi
2 min read

The sprawling storm promised to deliver torrential rain across a wide swath of southern Japan.

Article
Super Typhoon Sinlaku
3 min read

The violent storm aimed at the U.S. Northern Mariana Islands and Guam in mid-April 2026.

Article
❌