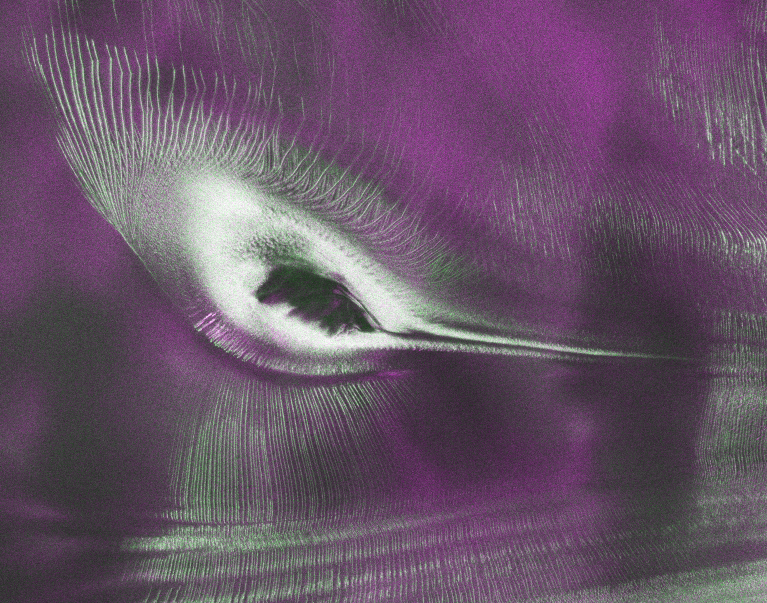
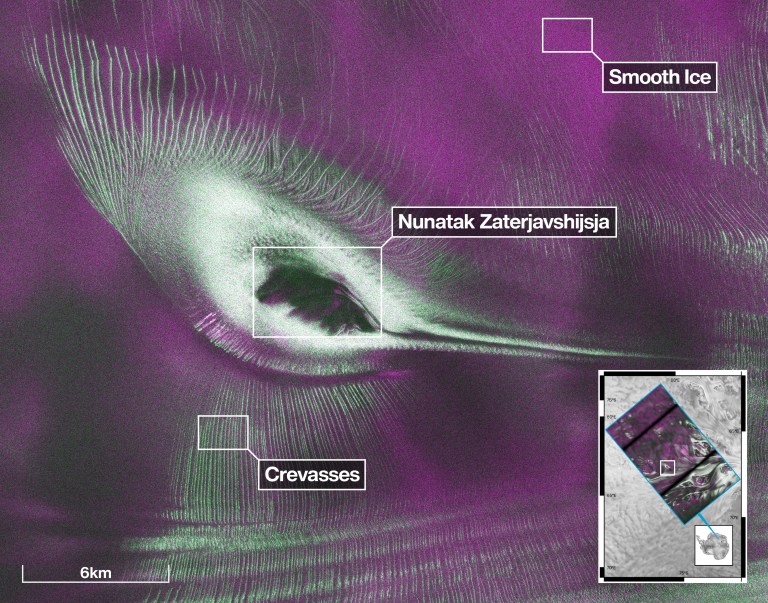
Scientists used data from the L-band radar aboard the U.S.-India Earth-orbiting NISAR satellite to produce this image of Nunatak Zaterjavshijsja, a mountaintop in East Antarctica, poking out amid a stream of ice flowing northeast to the ocean.
NASA/JPL-Caltech
The image shows Nunatak Zaterjavshijsja at center-left, surrounded by ice fractured with crevasses, which are shown as sharp, green lines. The magenta portions of the image represent more regular surfaces, such as smooth ice.
NASA/JPL-Caltech
Scientists used data from the L-band radar aboard the U.S.-India Earth-orbiting NISAR satellite to produce this image of Nunatak Zaterjavshijsja, a mountaintop in East Antarctica, poking out amid a stream of ice flowing northeast to the ocean.
NASA/JPL-Caltech
The image shows Nunatak Zaterjavshijsja at center-left, surrounded by ice fractured with crevasses, which are shown as sharp, green lines. The magenta portions of the image represent more regular surfaces, such as smooth ice.
NASA/JPL-Caltech
Main
Figure A
NISAR’s L-Band Radar Reveals ‘Hummingbird’ in Antarctica
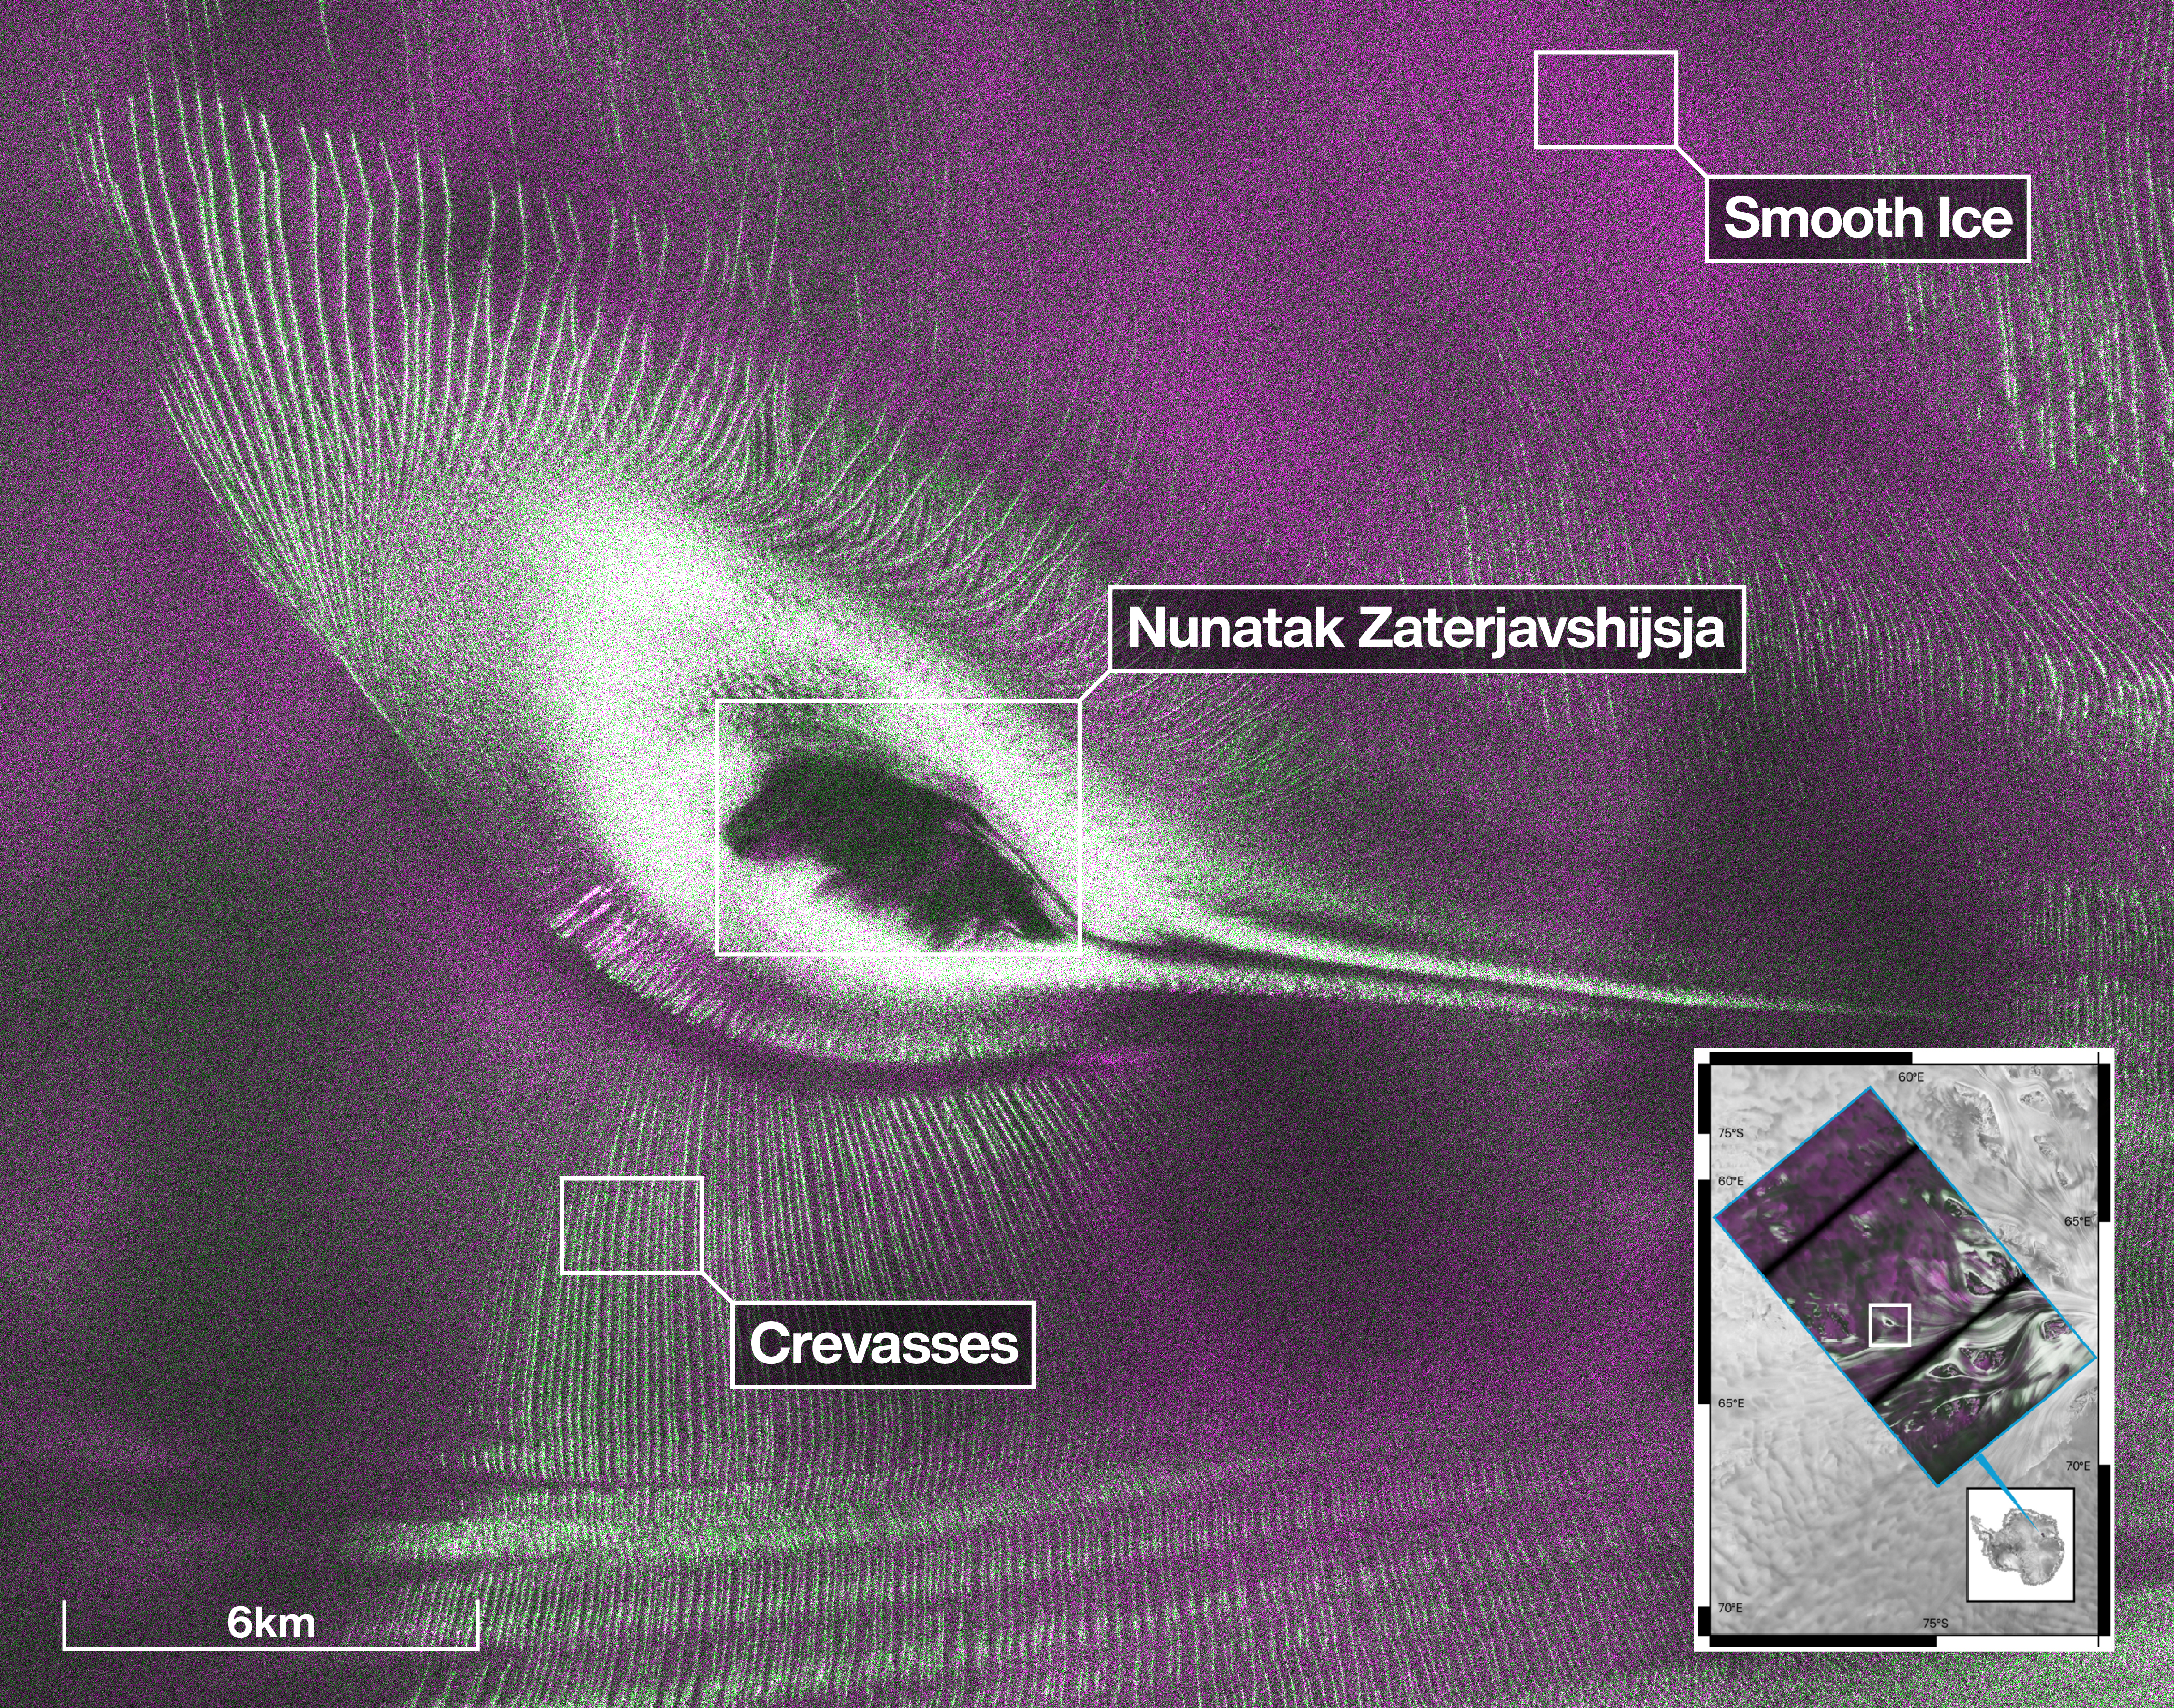
Scientists used data from the L-band radar aboard the U.S.-India Earth-orbiting NISAR satellite to produce this image of Nunatak Zaterjavshijsja, a mountaintop in East Antarctica, poking out amid a stream of ice flowing northeast to the ocean. The annotations point out the sharp green lines that indicate ice fractured with crevasses. Magenta represents more regular surfaces, such as smooth ice. Credit: NASA/JPL-Caltech
As of July 20, the public can access data from the two powerful radar instruments aboard the NISAR (NASA-ISRO Synthetic Aperture Radar) satellite. Teams in the United States and India will release files processed from the satellite’s L-band and S-band radars on an ongoing basis, helping researchers and other users track the movement of Earth’s land and ice masses, monitor changes in ecosystems like forests and wetlands, and respond to natural hazards such as landslides and earthquakes.
The release comes as NASA and ISRO (Indian Space Research Organisation) prepare to celebrate the first anniversary of NISAR’s July 30, 2025, launch from India’s Satish Dhawan Space Centre. Since that time, the mission engineering and science teams have been busy calibrating instrumentation, refining algorithms, and monitoring nearly all the planet’s land- and ice-covered surfaces twice every 12 days. Along the way, the team has captured scenes from around the globe — urban street grids, agricultural fields, landslides, earthquakes, and sinking land in Mexico City.
An early image released Tuesday revealed the fractured, barren surface of an Antarctic landscape in stark detail. In a merging of science and serendipity, it also resembles something else entirely: a hummingbird.
Despite its otherworldly quality, the Antarctic image shows a very real geographical feature called Nunatak Zaterjavshijsja, a mountaintop in East Antarctica, poking out amid a stream of ice flowing northeast to the ocean. As the moving glacier passes the obstruction, the mountain’s topography causes stresses in the ice, heavily fracturing the surrounding surfaces with deep cracks, called crevasses, which show as sharp green lines in the image.
“First, it’s a beautiful image, with rich details of features that provide insights to how the glacier is moving. Then, because radar can often see through snow and deep into the ice, NISAR can observe fundamentally different properties of Antarctic ice than can be seen in optical imagery,” said Seongsu Jeong, the signal analysis engineer who produced the image at NASA’s Jet Propulsion Laboratory in Southern California. “With NISAR we’re seeing what’s hidden beneath the surface.”
Story in magenta, green
Generated with measurements that NISAR’s L-band instrument gathered in August 2025, as U.S. and Indian mission teams tested the satellite’s systems, the “hummingbird” exemplifies one of the young mission’s hallmarks: intricately detailed imagery that is both informative and eye-catching.
The colors show differences in the way polarized microwave signals, which vibrate in different directions, interact with and reflect from the ice. Over Antarctica, NISAR transmits radar waves toward Earth with a horizontal polarization. The orientation of the signals that return — either horizontal, vertical, or both — provide clues about the object or surface that reflected them.
Signals that come back with a horizontal polarization likely bounced off a more regular surface, such as smooth ice. Those signals appear magenta in the image. Signals that return with vertical polarization may have refracted as they partially penetrated the snow and ice or scattered at different angles as they reflected off irregular surfaces, such as the faces of crevasses. Called volume scattering, these observations are displayed in green.
The white represents areas in which magenta and green signals scatter back strongly, a possible indication that there is an equal blend of surface and volume scattering.
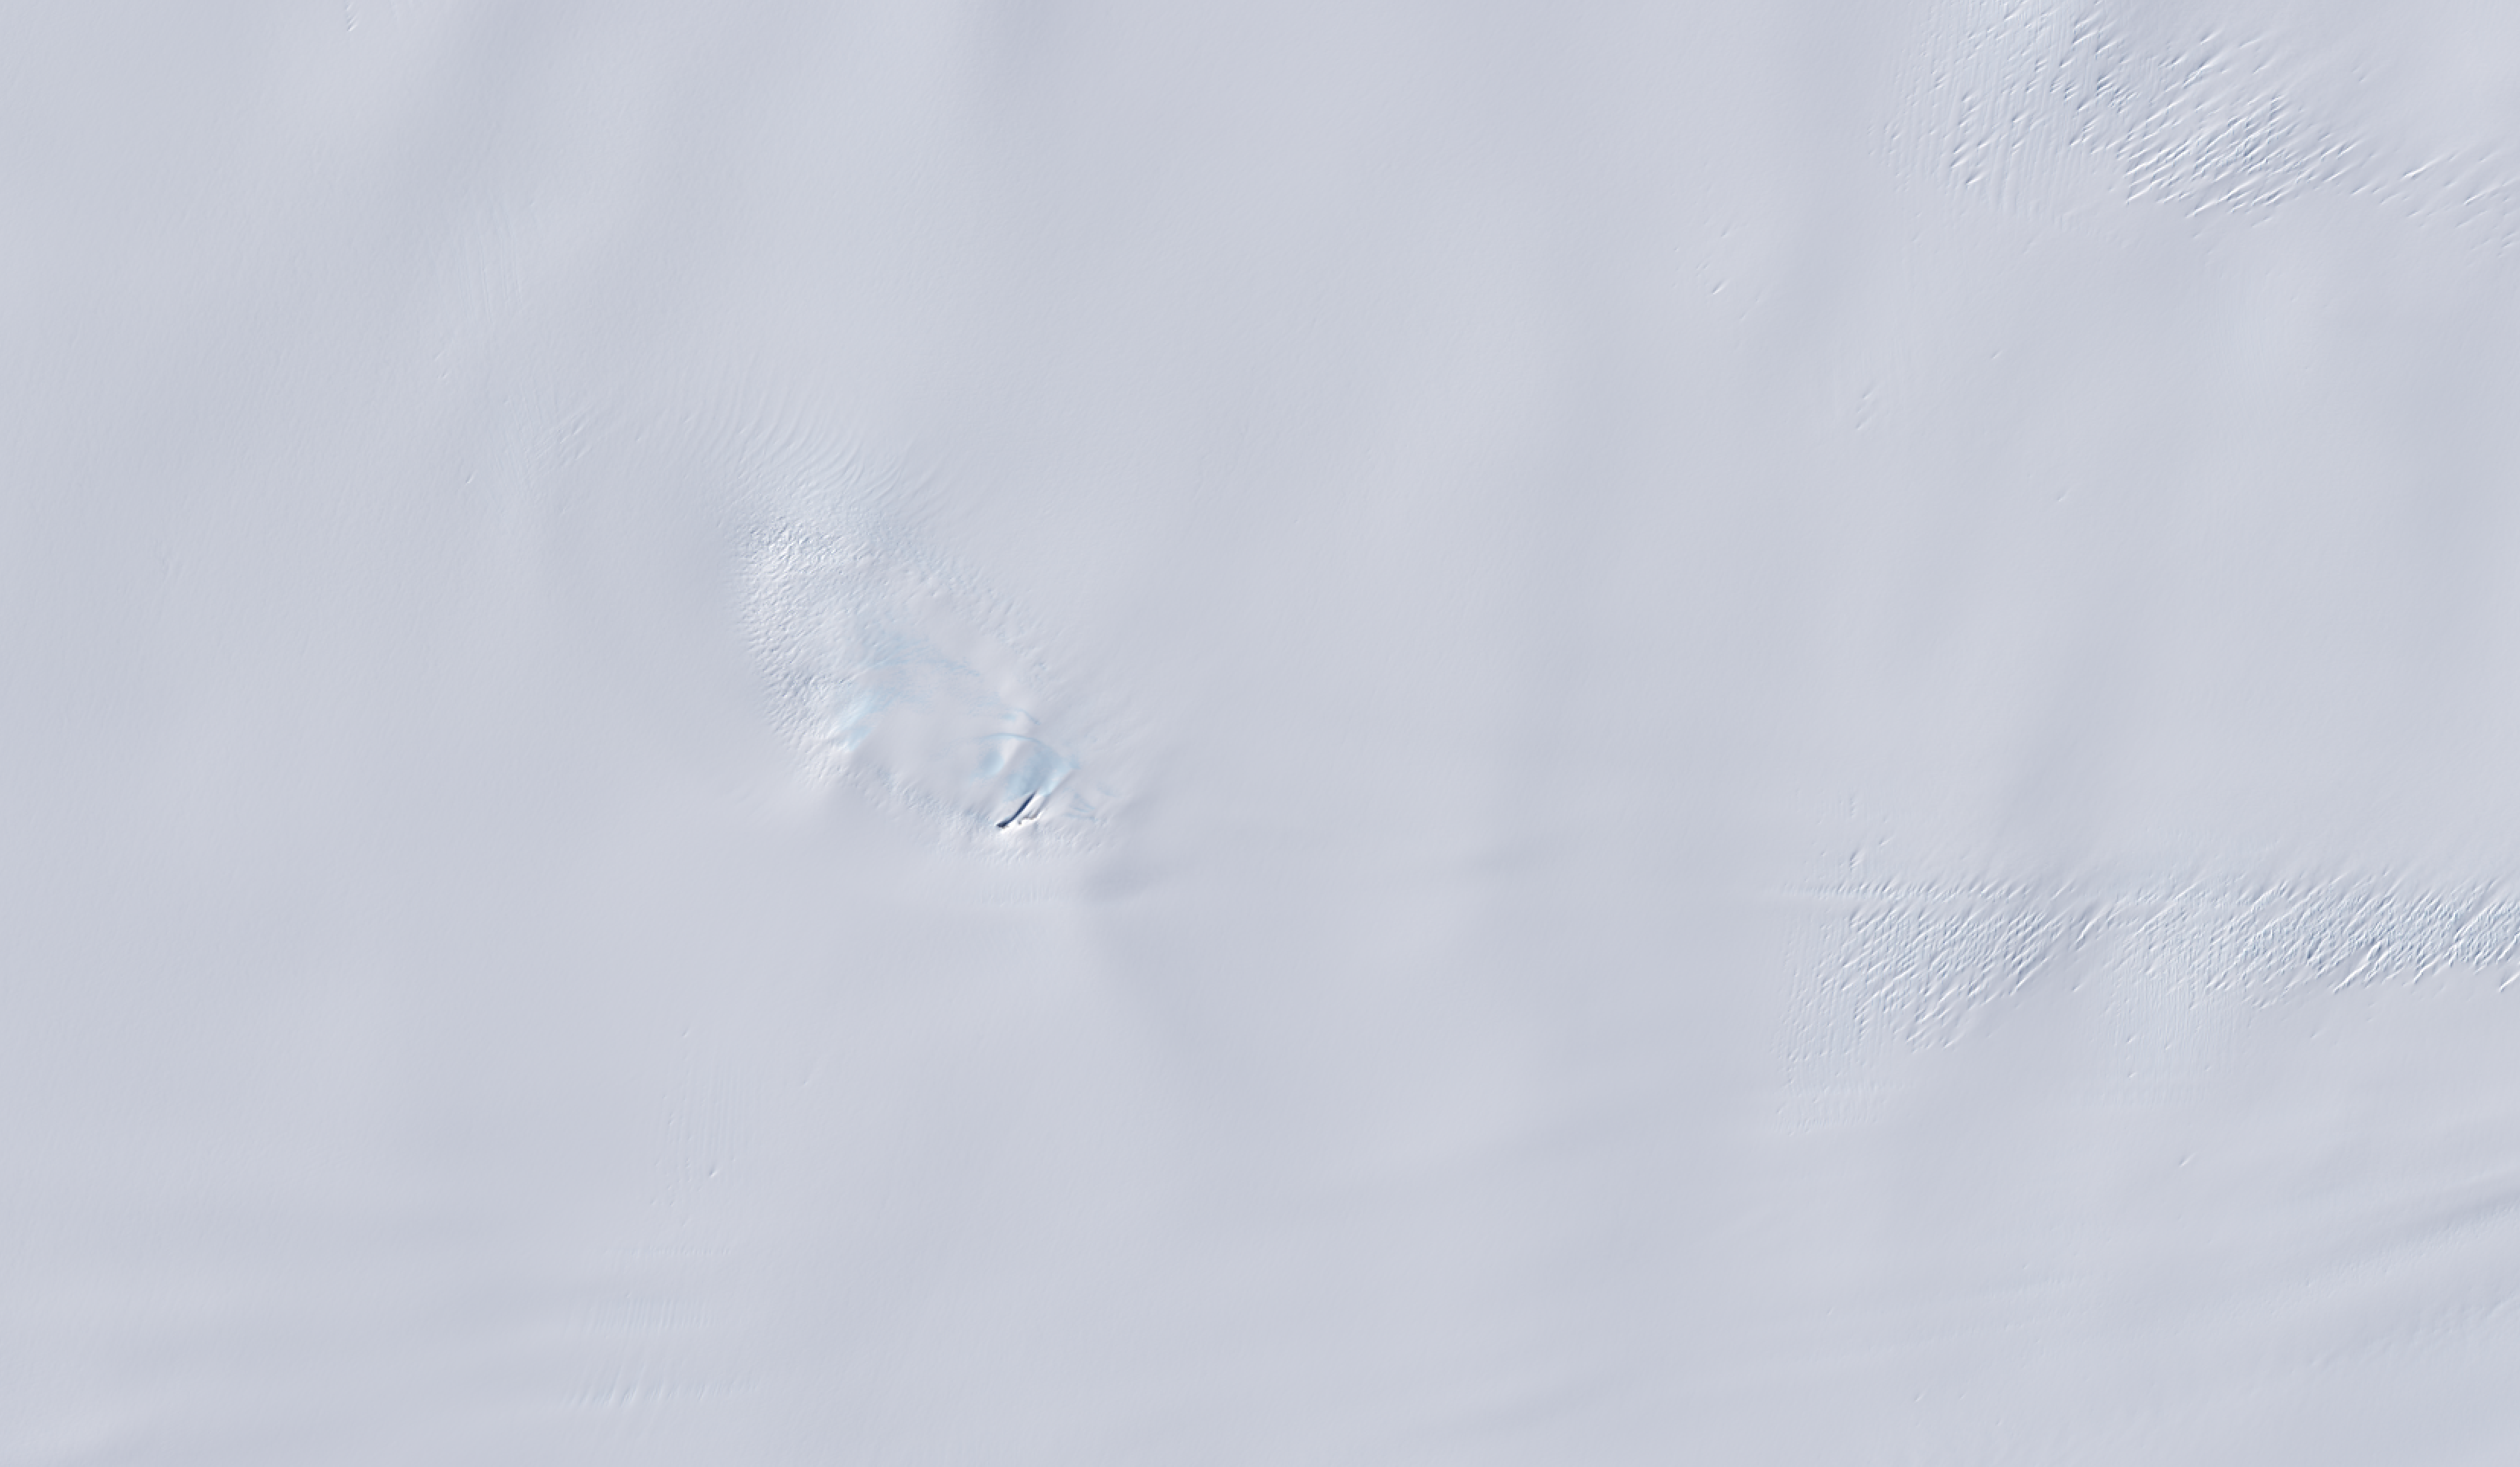
The same scene viewed in optical light is almost entirely white with ice and snow. Slight shadows and rippling indicate the presence of the mountaintop, and textures in the surrounding area suggest the ice is not completely smooth.
An image from the Landsat 9 satellite shows Nunatak Zaterjavshijsja on Nov. 2, 2025. Because microwaves can penetrate frozen surfaces, signals from NISAR’s L-band radar captured more detail of the structure of the surrounding icescape than is visible in this optical image.
USGS
Access to data
The NISAR satellite is the first free-flying space mission to feature two radar instruments: an L-band system and an S-band system. The systems are complementary due to their differing wavelengths. For example, the longer-wave L-band can pass through tree canopies, imaging the ground beneath. Meanwhile, depending on leaf sizes, S-band can collect observations of those canopies.
The Indian science team, based at ISRO’s Space Applications Centre in Ahmedabad, recently started releasing S-band data via the Bhoonidhi portal.
On July 20, the U.S. side of the mission started releasing calibrated products continuously for all L-band measurements collected since June 17. By the end of the year, the team expects to have released all data acquired earlier during science operations. The NISAR project science team previously had two limited releases of L-band data, the first in January of about 25 sample products and a release in February of thousands of pre-calibrated products.
The NISAR mission’s science data output is vast, on the order of dozens of terabytes a day, due to the satellite’s frequent coverage of nearly all the land and ice surfaces on Earth. It scans from within a few degrees of the South Pole in Antarctica to 77.5 degrees north latitude, above the Arctic Circle.
More about NISAR
Managed by Caltech, JPL leads the U.S. component of the project and provided the satellite’s L-band SAR and antenna reflector. The spacecraft bus and its S-band SAR were provided by ISRO.
The NISAR satellite is the first to carry two SAR instruments at different wavelengths, collecting data using the spacecraft’s giant drum-shaped reflector, which measures 39 feet (12 meters) wide — the largest radar antenna reflector NASA has sent into space.
Climate change is being driven largely by the greenhouse gases we've pumped into the atmosphere, which trap more of the Sun's energy there. That added energy increases the odds of extreme events: longer, more intense heat waves and droughts, interspersed with excessive precipitation. But these sorts of events have happened in the past—how can we tell if any given weather disaster has been made more likely by the climate?
It's a question with implications for everything from building codes to disaster preparedness. And there's some good news: According to a report released by the US National Academies of Science on Thursday, the field of climate attribution is growing increasingly mature and can answer some questions for us with far greater confidence than it could just a decade ago. The report also notes that there are still important limits and suggests steps to address them.
Overall, this makes it clear that climate attribution is normal, mainstream science. And the fossil fuel industry views that as a problem, as it could make it easier to hold companies liable for damages. This has triggered a backlash that has Republicans in Congress and state governments threatening the National Academies' funding.
Two new reports from NASA’s Commercial Satellite Data Acquisition (CSDA) program evaluate data from the Umbra X-band Synthetic Aperture Radar (SAR) satellite constellation for the NASA Earth science research and applications community. The results of these evaluations help to inform NASA program management and the user community about the quality of these commercial data for use in NASA science.
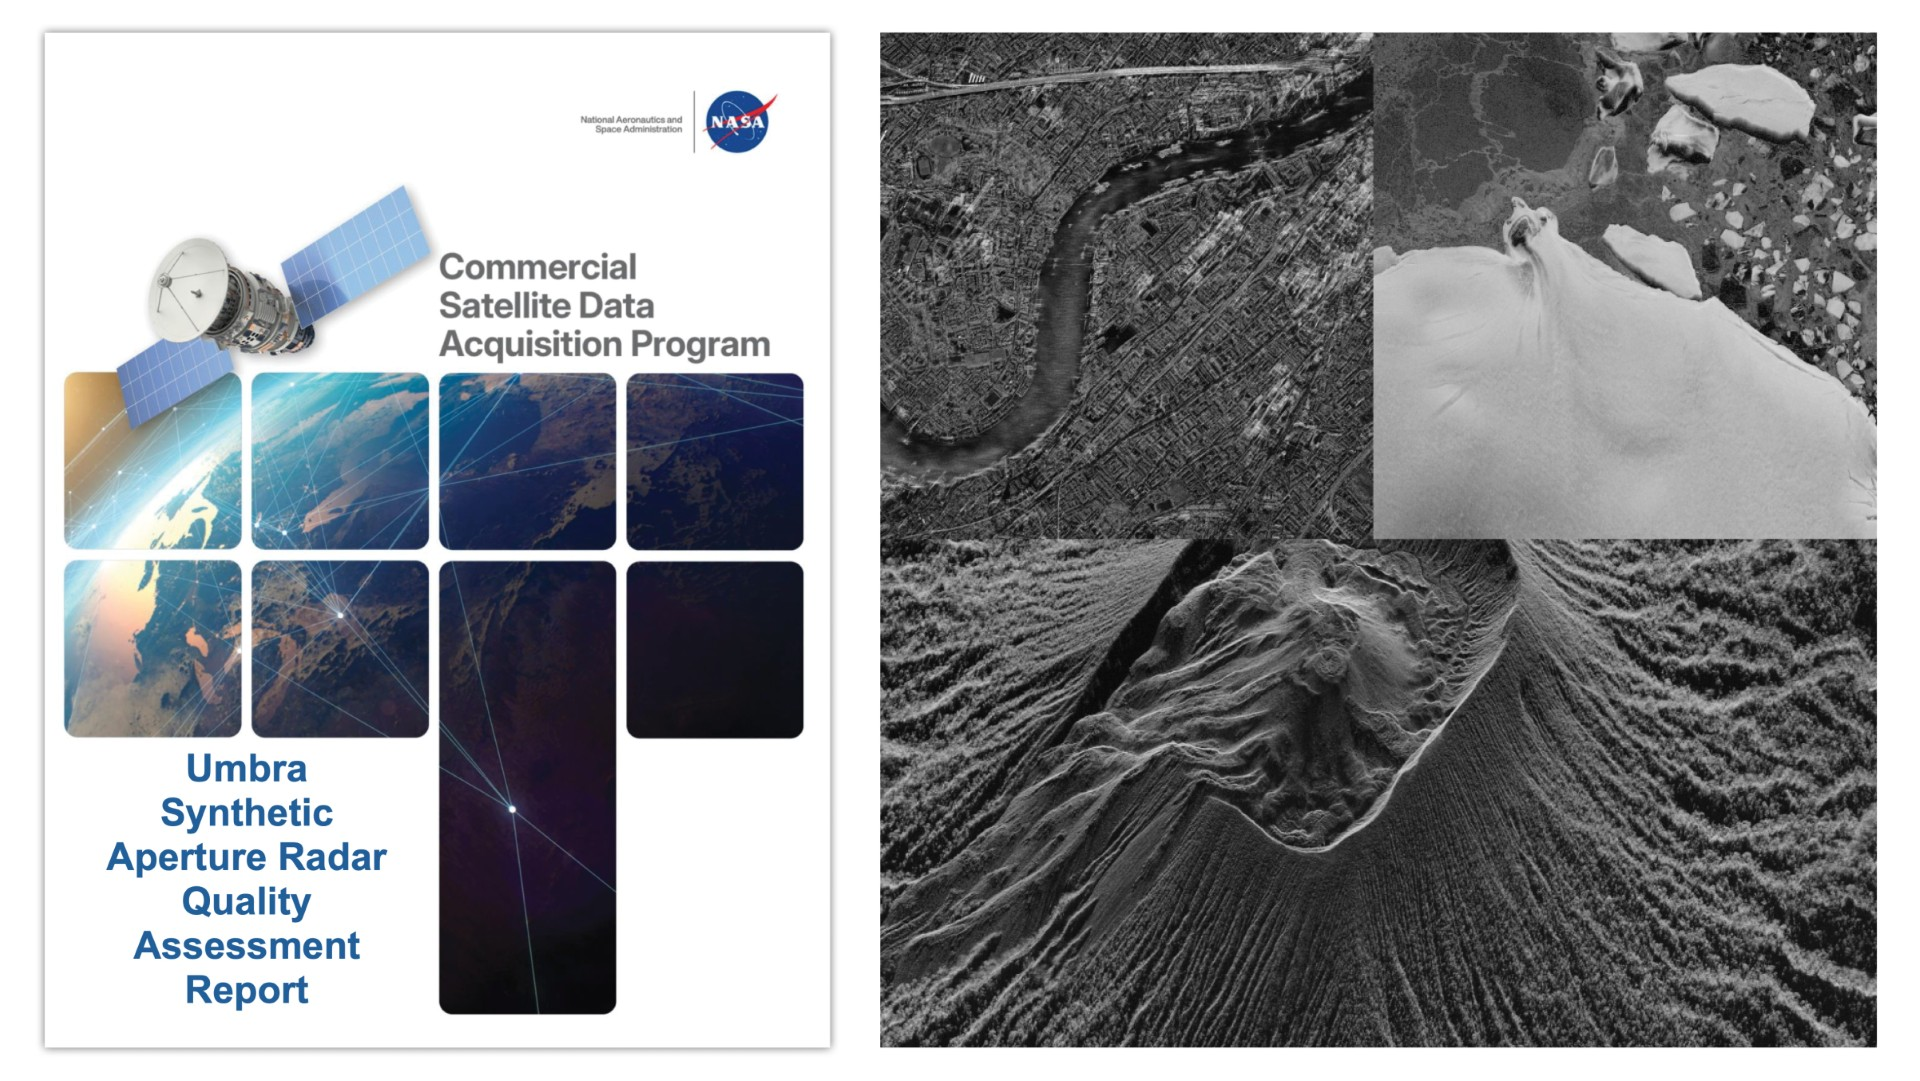
NASA’s CSDA program released the Umbra SAR Principal Investigator Evaluation Summary and Umbra SAR Quality Assessment Reports in May 2026. (The cover of the Quality Assessment Report is shown at left.) The results of these evaluations help inform NASA program management about the quality of this commercial data for use in NASA science. At right, a collage of synthetic aperture radar images from Umbra.
TheCSDA Umbra Synthetic Aperture Radar SAR Principal Investigator Evaluation Summary documents the findings of evaluation teams. The teams were given access to the Umbra archive as well as the ability to task the Umbra constellation for new acquisitions. The tasking capability allowed evaluation teams to test the utility of Umbra data in time-sensitive workflows and to monitor areas experiencing rapid change and/or emergent environmental conditions, such as harmful algal blooms.
Although the Principal Investigator Evaluation Summary supports the use of Umbra SAR data for NASA Earth science research and applications overall, it noted several strengths and weaknesses of the Umbra X-band data. Strengths included access to a very high spatial resolution X-band SAR satellite constellation; taskable access to high temporal repeat opportunities with quick turnaround; imaging flexibility with a range of azimuth and incidence angles; and the company’s Open Data Program. Conversely, the PI teams reported weaknesses, including issues with Umbra geolocation (noting large and small geolocation errors), limited software compatibility, metadata, and some missing technical documentation.
Additionally, theCSDA Umbra Synthetic Aperture Radar SAR Quality Assessment Report documents the results of radiometric and geometric analyses performed by NASA subject matter experts (SMEs) enlisted to evaluate the fundamental quality of the Umbra data following the Joint NASA/European Space Agency (ESA) assessment guidelines (ESA-NASA, 2024).
Performed mainly on the single-look complex (SLC) Level 1 data products in Sensor Independent Complex Data (SICD) format, along with some additional Level 2 products used in science usability assessments by the evaluation team, the CSDA SMEs found the spatial resolution of the data agreed with Umbra’s specifications. However, the quality analysis results for geolocation accuracy did not universally align with the company’s specifications. Given these results, the SME’s concluded that “the overall positioning performance of the Umbra data did not meet the expected accuracy.
Regarding the radiometric performance of the data, which was assessed in terms of absolute accuracy, stability, and sensitivity, the SMEs found the data “underperform[ed] relative to that of well-calibrated reference SAR systems.”
About the CSDA Program
The CSDA program was established to identify, evaluate, and acquire data from commercial sources that support the NASA Earth science research and application goals. NASA’s Earth Science Division recognizes the potential impact commercial satellite constellations may have in encouraging/enabling efficient approaches to advancing Earth System Science and applications development for societal benefit. Commercially acquired data may also provide a cost-effective means to augment and/or complement the suite of Earth observations acquired by NASA, other U.S. government agencies, and international partners.
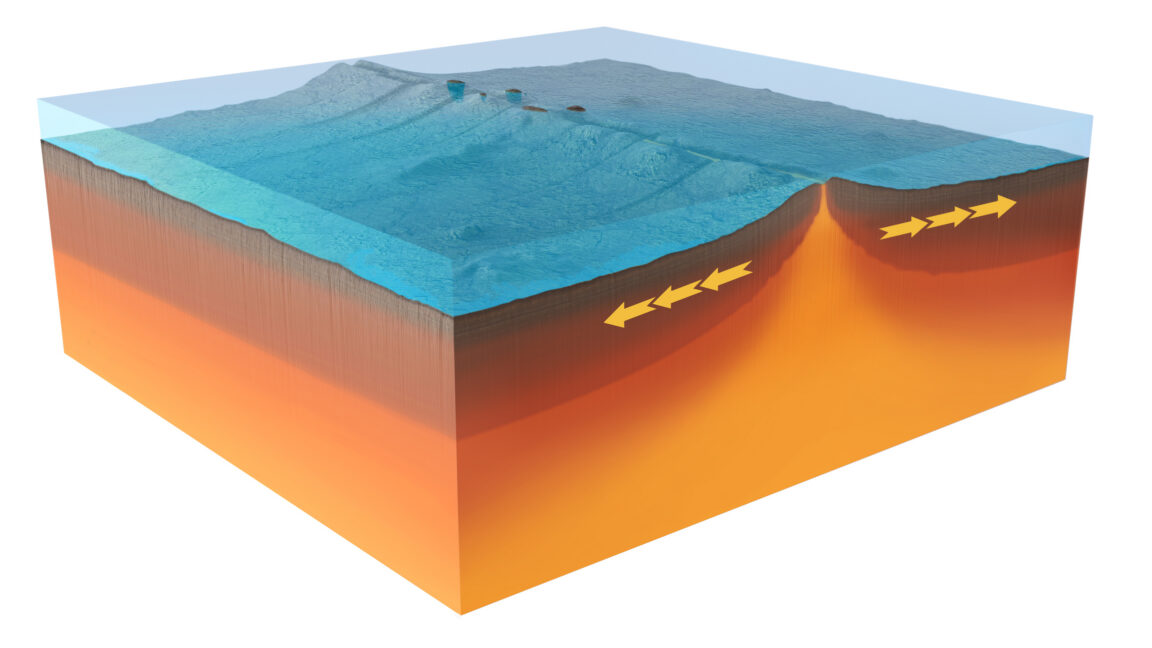
One of the central features of plate tectonics is the formation of new crust at mid-ocean ridges. Part of the spreading process that drives continents apart, it was arguably the discovery of these ridges that drove widespread acceptance of plate tectonics as a theory. Thanks to decades of exploration, we now have a good picture of what the crust that forms at the site of spreading looks like. But we still have an incomplete idea of how its features are actually produced.
In other words, we have a good idea of the outcome of the process, but not a detailed picture of the process itself.
That is starting to change. In 2024, a team of French scientists was able to remotely monitor a major event on the border between the Australian and Antarctic plates, only two months after they installed equipment on the ocean floor. Their data shows that most of the spreading occurred in a relatively short time window, and some key events happened without any obvious seismic activity.
Earth is the only planet we know of with buoyant, silica-rich continents. But, despite decades of research, geologists still don't agree on how they formed. "The continents started appearing around about four billion years ago—that's the oldest continental rock we know about,” said Tim Johnson, a geologist at Curtin University in Perth, Australia. “The Earth is four and a half billion years old, so why they started appearing then is unknown, as is the mechanism to make that continental crust."
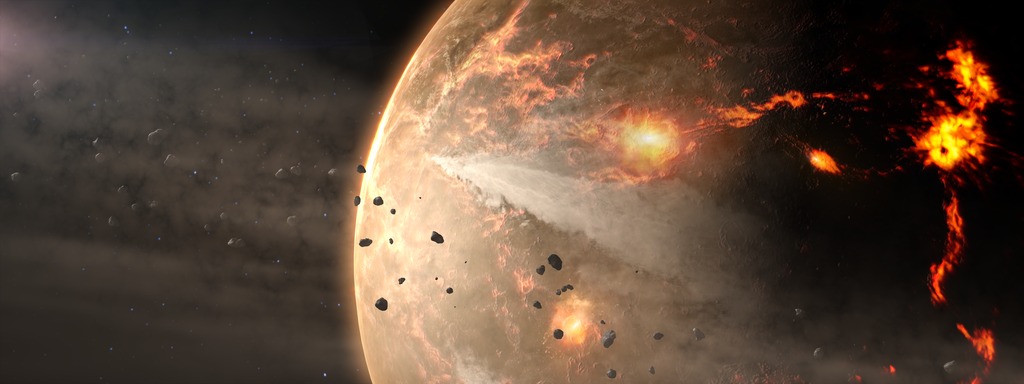
Johnson and his colleagues are now arguing that the formation of continents on Earth was caused largely by an intense, sustained barrage of asteroid impacts that kept the early crust hot and thin enough to make buoyant continents possible. In short, the lands we live on are here because of ancient bombardment from space.
Plates and plumes
The problem with studying the formation of continents is that the geological evidence of this process is almost gone. The oldest known continental-type rocks crystallized around 4.03 billion years ago, right at the end of the Hadean eon (the earliest era in Earth’s history, spanning the first 500 million years of its existence). Rare basaltic rocks date back about 4.2 billion years, and a handful of the oldest zircon crystals push the record back to 4.4 billion years. Beyond that, there's hardly anything else. So, scientists looking into the origin of continents had to rely largely on educated guesses. “There are huge debates about what was going on in the early Earth, because the data is so scarce,” Johnson said.
 Login
Login