Reading view

There are new articles available, click to refresh the page.

How 2 US, European Satellites Are Studying Hurricanes During El Niño

5 min read

Preparations for Next Moonwalk Simulations Underway (and Underwater)
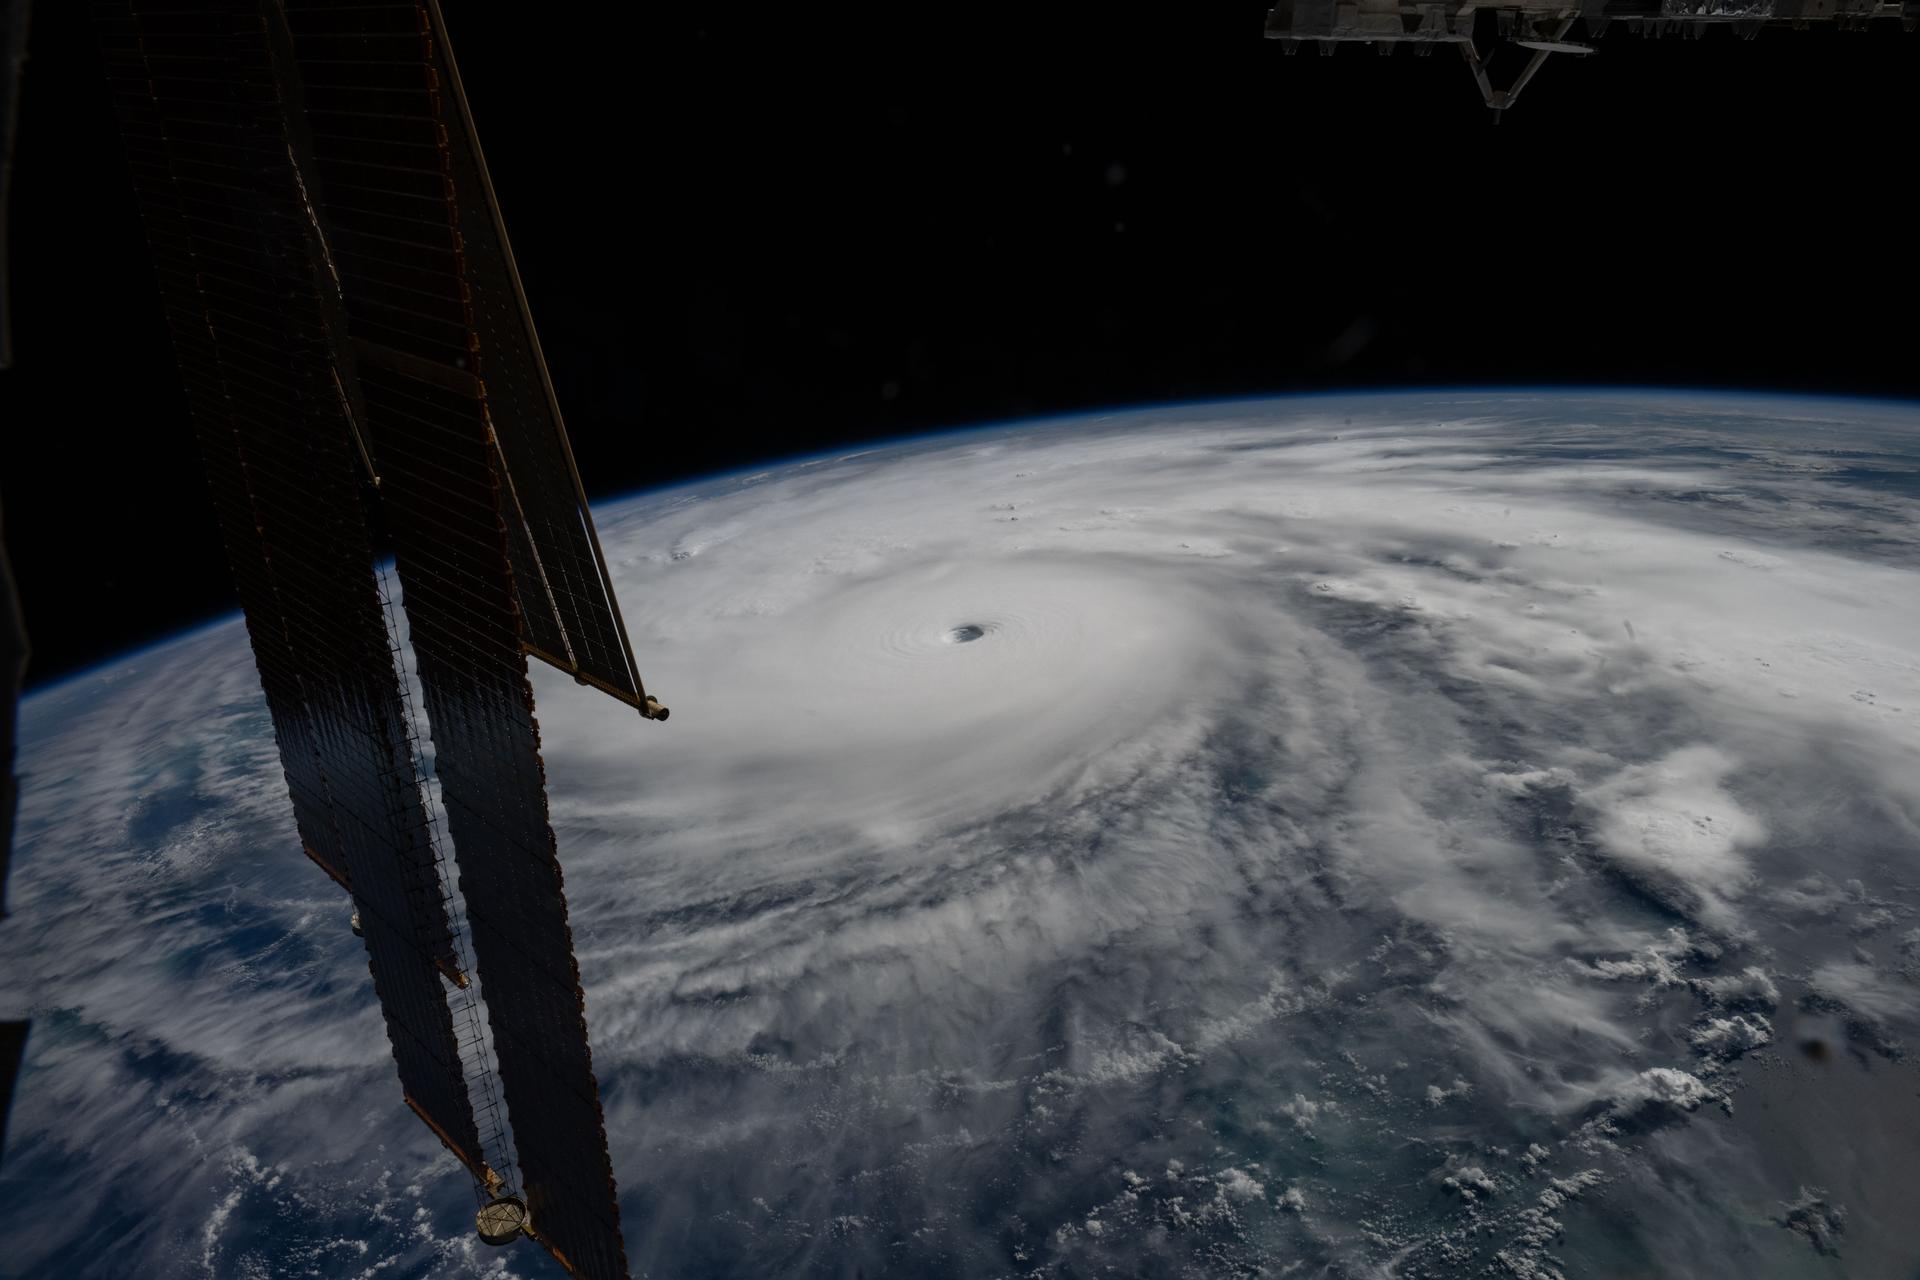
Category 5 Hurricane Melissa, one of the most powerful storms to strike the Caribbean in recent history, is pictured about 50 miles south of Jamaica in this photograph from the International Space Station as it orbited 262 miles above the Yucatan Peninsula.
Hurricane Melissa is seen 50 miles south of Jamaica in this photograph taken from the International Space Station on Oct. 28, 2025.
NASA

Last November, NASA and its European partners launched the Sentinel-6B satellite to improve hurricane forecasts, help protect infrastructure, and benefit commercial industries, including shipping. The satellite now is flying 30 seconds behind its predecessor, Sentinel-6 Michael Freilich. Both satellites are providing precise sea level height measurements during what oceanographers expect to be a historic El Niño, a naturally occurring oceanic phenomenon in which warmer-than-usual Pacific waters shift global weather patterns.

The two satellites make up the Copernicus Sentinel-6/Jason-CS (Continuity of Service) mission, the latest in a series of ocean-observing radar altimetry missions that have been monitoring Earth’s changing seas continuously since the early 1990s.

The data each satellite is collecting will not only allow scientists to better understand this year’s El Niño but will also help them create more accurate hurricane predictions.

“This El Niño was a late-bloomer,” said Josh Willis, Sentinel-6B’s project scientist at NASA’s Jet Propulsion Laboratory in Southern California. “It didn’t kick off until the middle of the year and is just now reaching a strength similar to what we’ve seen in the satellite record during significant El Niños in 1997 and 2015. We expect it to be big, and it’s already having big impacts.”

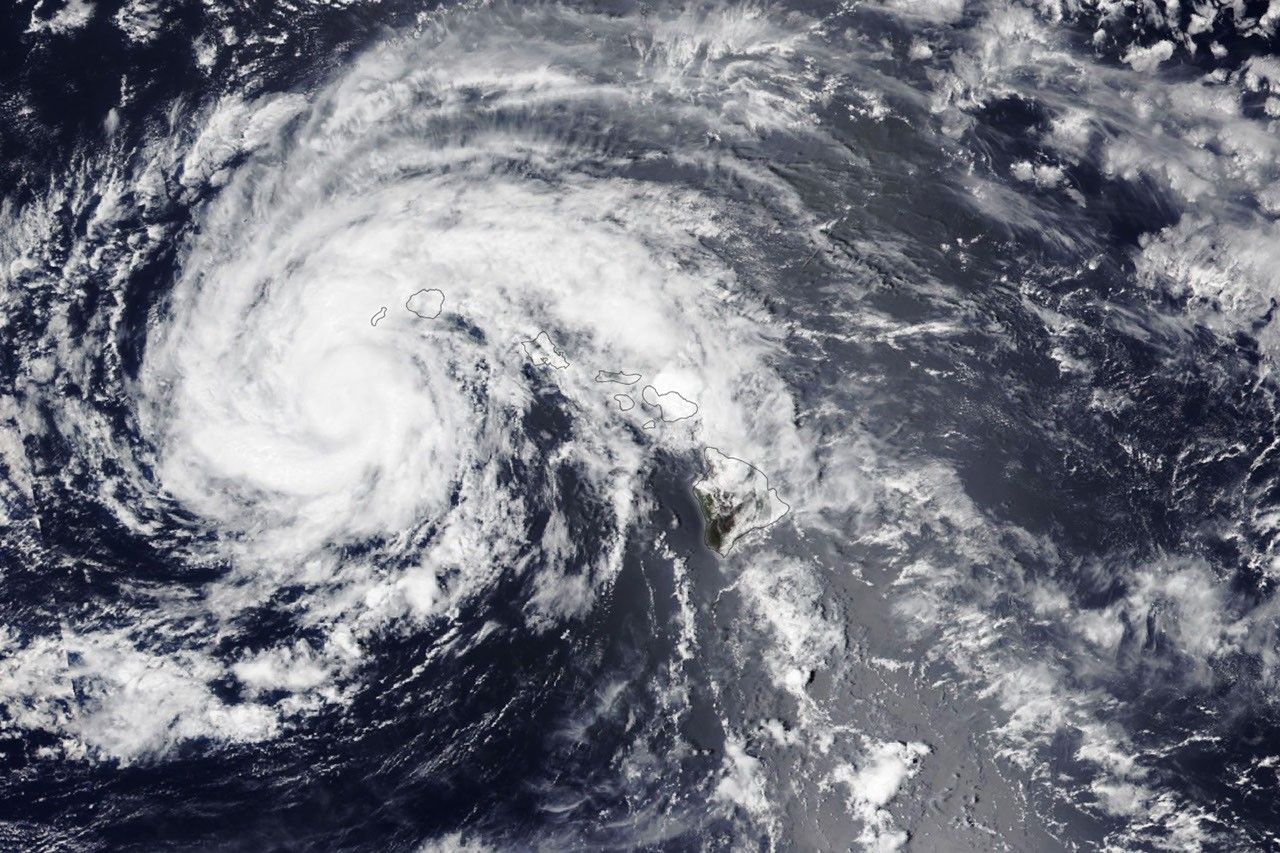
El Niños generally scramble weather patterns tied to rainfall and storms, including hurricanes. They also redistribute heat in the ocean, which affects sea level. Normally, Earth’s warmest ocean waters sit along the equator in the western Pacific. During El Niño, weakened winds, which usually blow westward along the equator, result in heat spreading east toward South America. The change in ocean heat shifts hurricane activity from the Atlantic to the Pacific Ocean.

Predicting hurricane strength

On July 15, Sentinel-6B began delivering low-latency data to scientists that could be used for weather predictions. That data will take some time to work its way into the research models on which meteorologists and climate scientists rely, but when it does, those improved models could save lives.

Data from Sentinel-6 satellite missions feeds into hurricane tracking algorithms used by federal and state agencies. Those predictions can activate disaster response efforts, mobilizing resources ranging from sandbag placement to National Guard activation. They also can lead to evacuation orders that require quick but well-informed decisions about logistics at a local level. More severe events may require engaging larger organizations, such as the Federal Emergency Management Agency.

A tropical storm can take a week or more to become a hurricane and make its way to a coastline, but a hurricane can rapidly intensify in the 48 hours prior to landfall, leaving planners little time to prepare.

“Hurricanes have been known to speed up quickly at the last moment, so the window in which to decide what to do is short,” said Deirdre Byrne, an oceanographer and altimetry expert with the National Oceanic and Atmospheric Administration (NOAA). “The goal is to forecast how much and how rapidly intensification will happen so that officials can make the right calls.”

Byrne oversees one of the country’s most crucial hurricane forecasting algorithms, NOAA’s Satellite Ocean Heat Content Suite, which has been operating since 2012.

Each Sentinel-6 satellite measures ocean height, as well as the size of waves and marine wind speed, using a radar altimeter, which bounces thousands of radar pulses a second off the crests and troughs of waves. Ocean height varies from place to place and provides insight into the ocean’s heat content, since warm water expands. That, in turn, helps forecast how fast hurricanes will grow.

The satellites each carry a second instrument, called the Global Navigation Satellite System – Radio Occultation (GNSS-RO), which measures atmospheric properties, such as humidity, pressure, and temperature.

Among the measurements Sentinel-6 is gathering, Byrne is most anticipating the ocean height data, which she plans to begin incorporating into the current Satellite Ocean Heat Content Suite algorithm by the end of the year.

“In terms of data quality, the Sentinel-6 missions are unparalleled,” Byrne said.

Together, the missions are also extending a precise dataset deep into its fourth decade. This record of sea level observations traces back to the TOPEX/Poseidon mission, which launched in 1992, and continues through to the present day with Sentinel-6 Michael Freilich. Sentinel-6B will take over for its predecessor as the reference satellite for global sea level measurements later this year.

“The key is consistency, measuring the same way, every time,” said Severine Fournier, Sentinel-6B deputy project scientist, JPL. “That’s what lets us predict hurricanes, and, in turn, protect coastal communities and infrastructure.”

More about Sentinel-6B

Sentinel-6 Michael Freilich, named after a former director of NASA’s Earth Science Division, is one of two satellites that compose the Copernicus Sentinel-6/Jason-CS mission.

Sentinel-6/Jason-CS, a part of the European Union’s Earth observation program called Copernicus, was jointly developed by ESA (European Space Agency), EUMETSAT (European Organisation for the Exploitation of Meteorological Satellites), NASA, and NOAA, with funding support from the European Commission and technical support on performance from the French space agency CNES (Centre National d’Études Spatiales). Spacecraft monitoring and control, as well as the processing of all the altimeter science data, is carried out by EUMETSAT on behalf of the European Union’s Copernicus Programme, with the support of all partner agencies.

NASA JPL, a division of Caltech in Pasadena, contributed three science instruments for each Sentinel-6 satellite: the Advanced Microwave Radiometer, the GNSS-RO, and the Laser Retroreflector Array. NASA also contributed launch services, ground systems supporting operation of the agency’s science instruments, the science data processors for two of these instruments, and support for the United States members of the international Ocean Surface Topography Science Team.

For more about Sentinel-6B, visit:

https://science.nasa.gov/mission/sentinel-6B

-end-

Media Contacts

Andrew Good / Andrew Wang
Jet Propulsion Laboratory, Pasadena, Calif.
818-393-2433 / 626-379-6874
andrew.c.good@jpl.nasa.gov / andrew.wang@jpl.nasa.gov

2026-060

NASA Data Feeds River Forecasts as Snow Drought Effects Linger

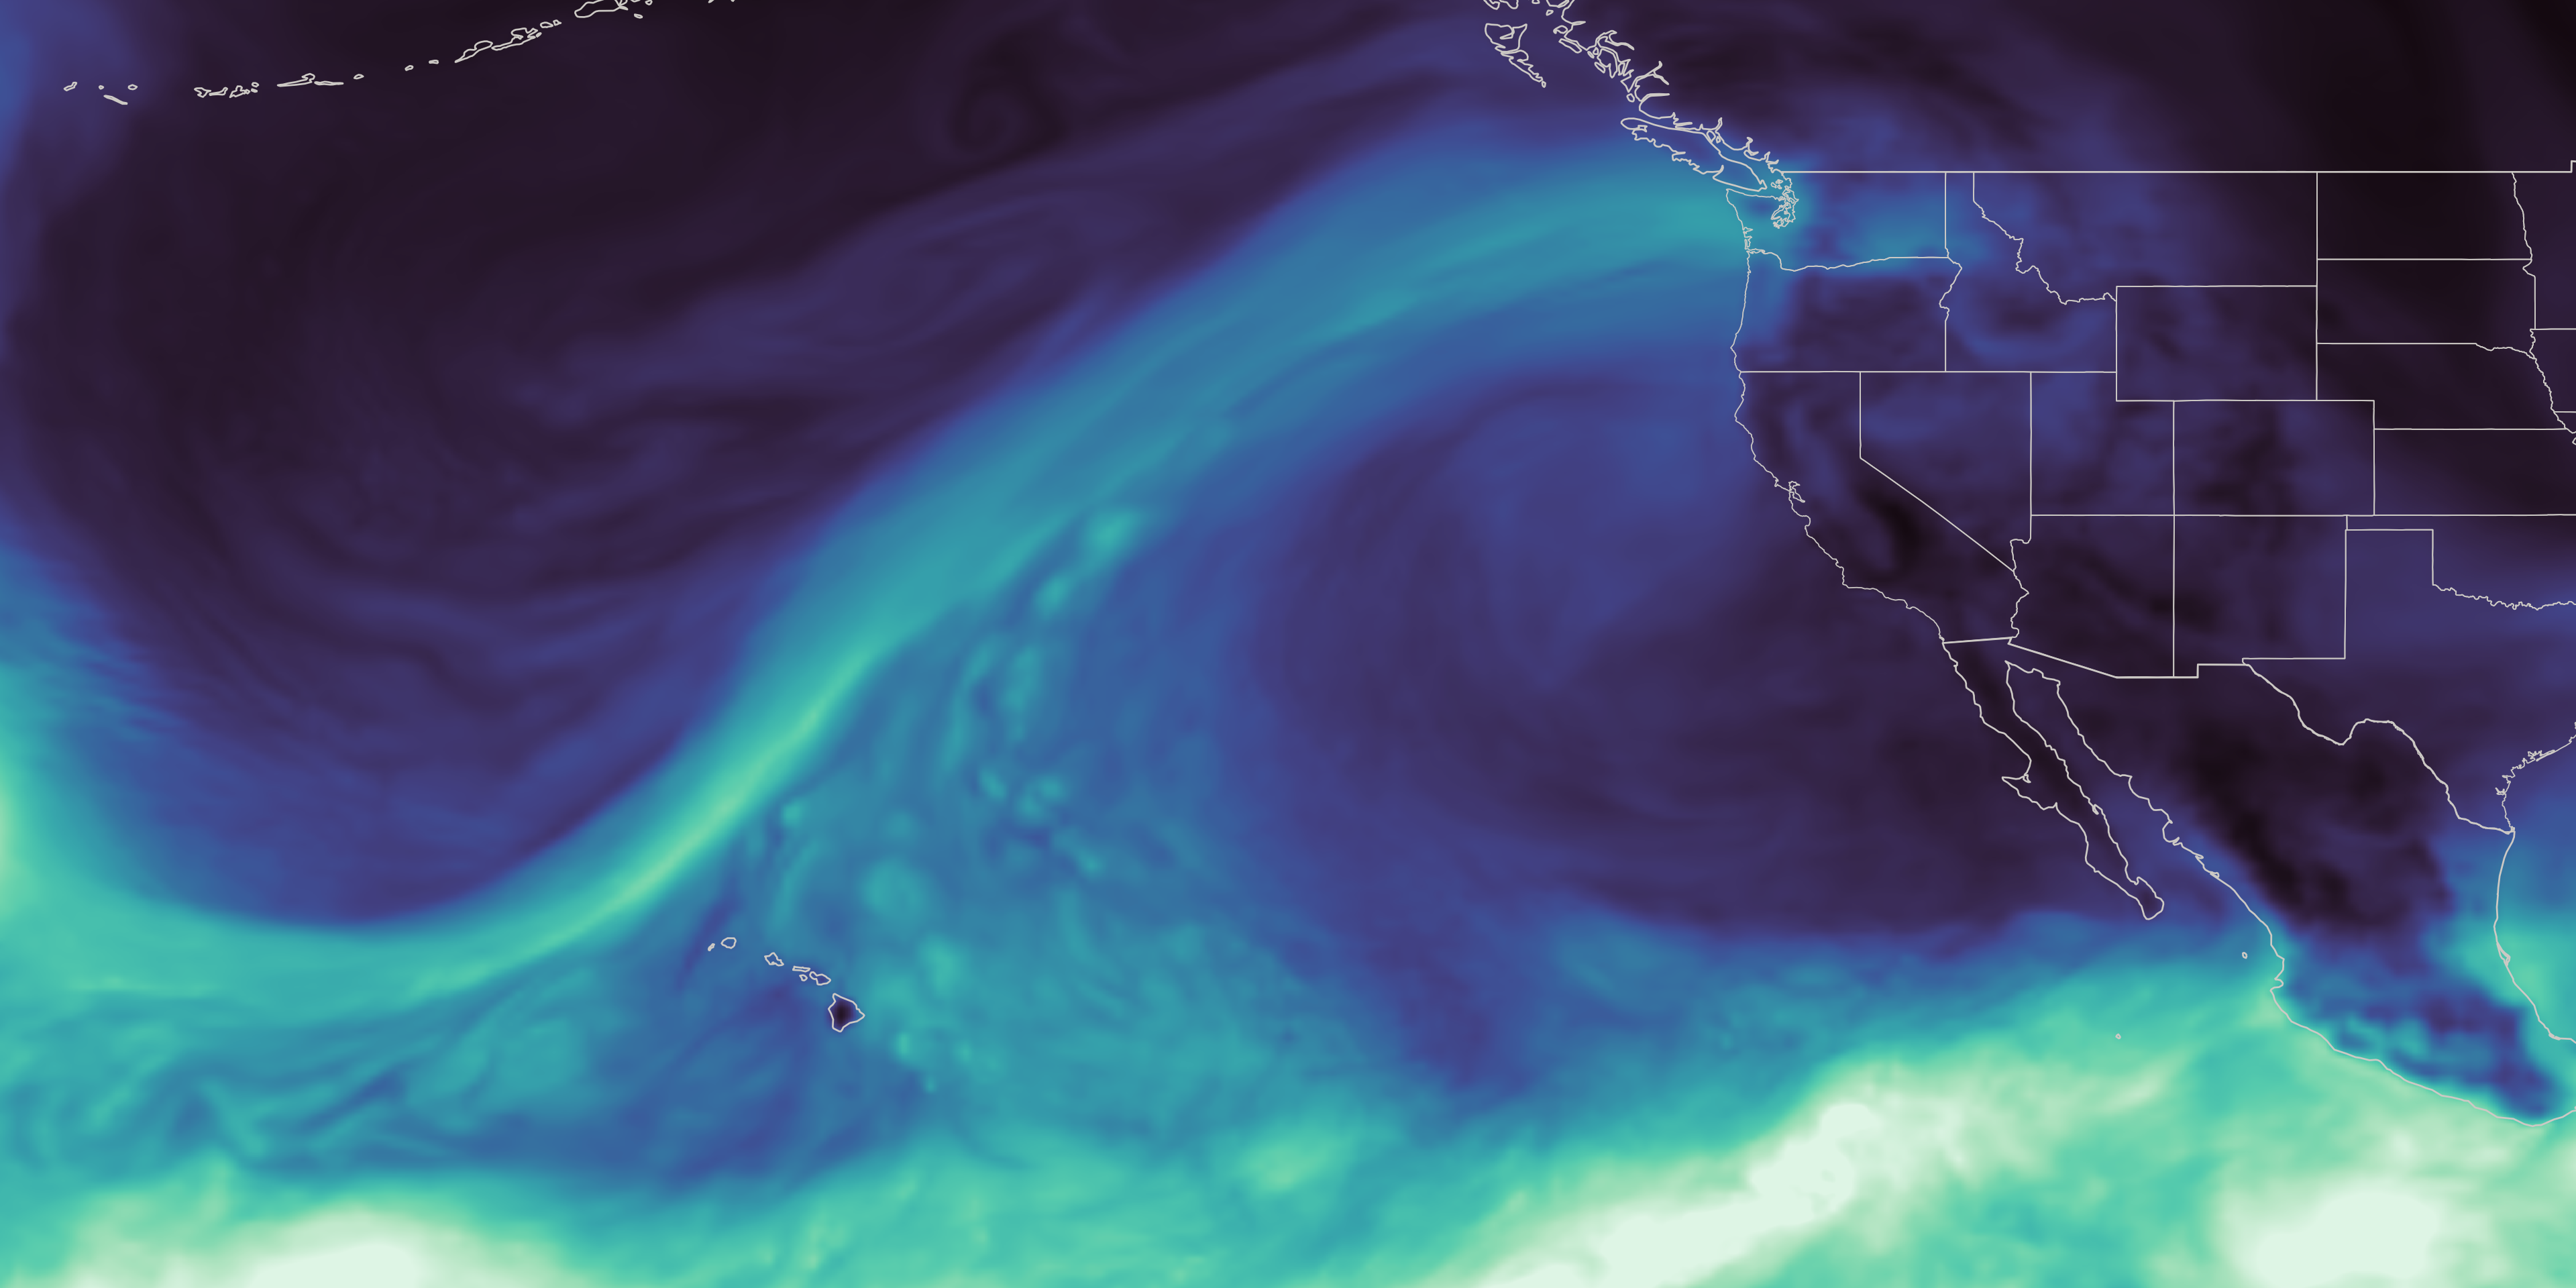
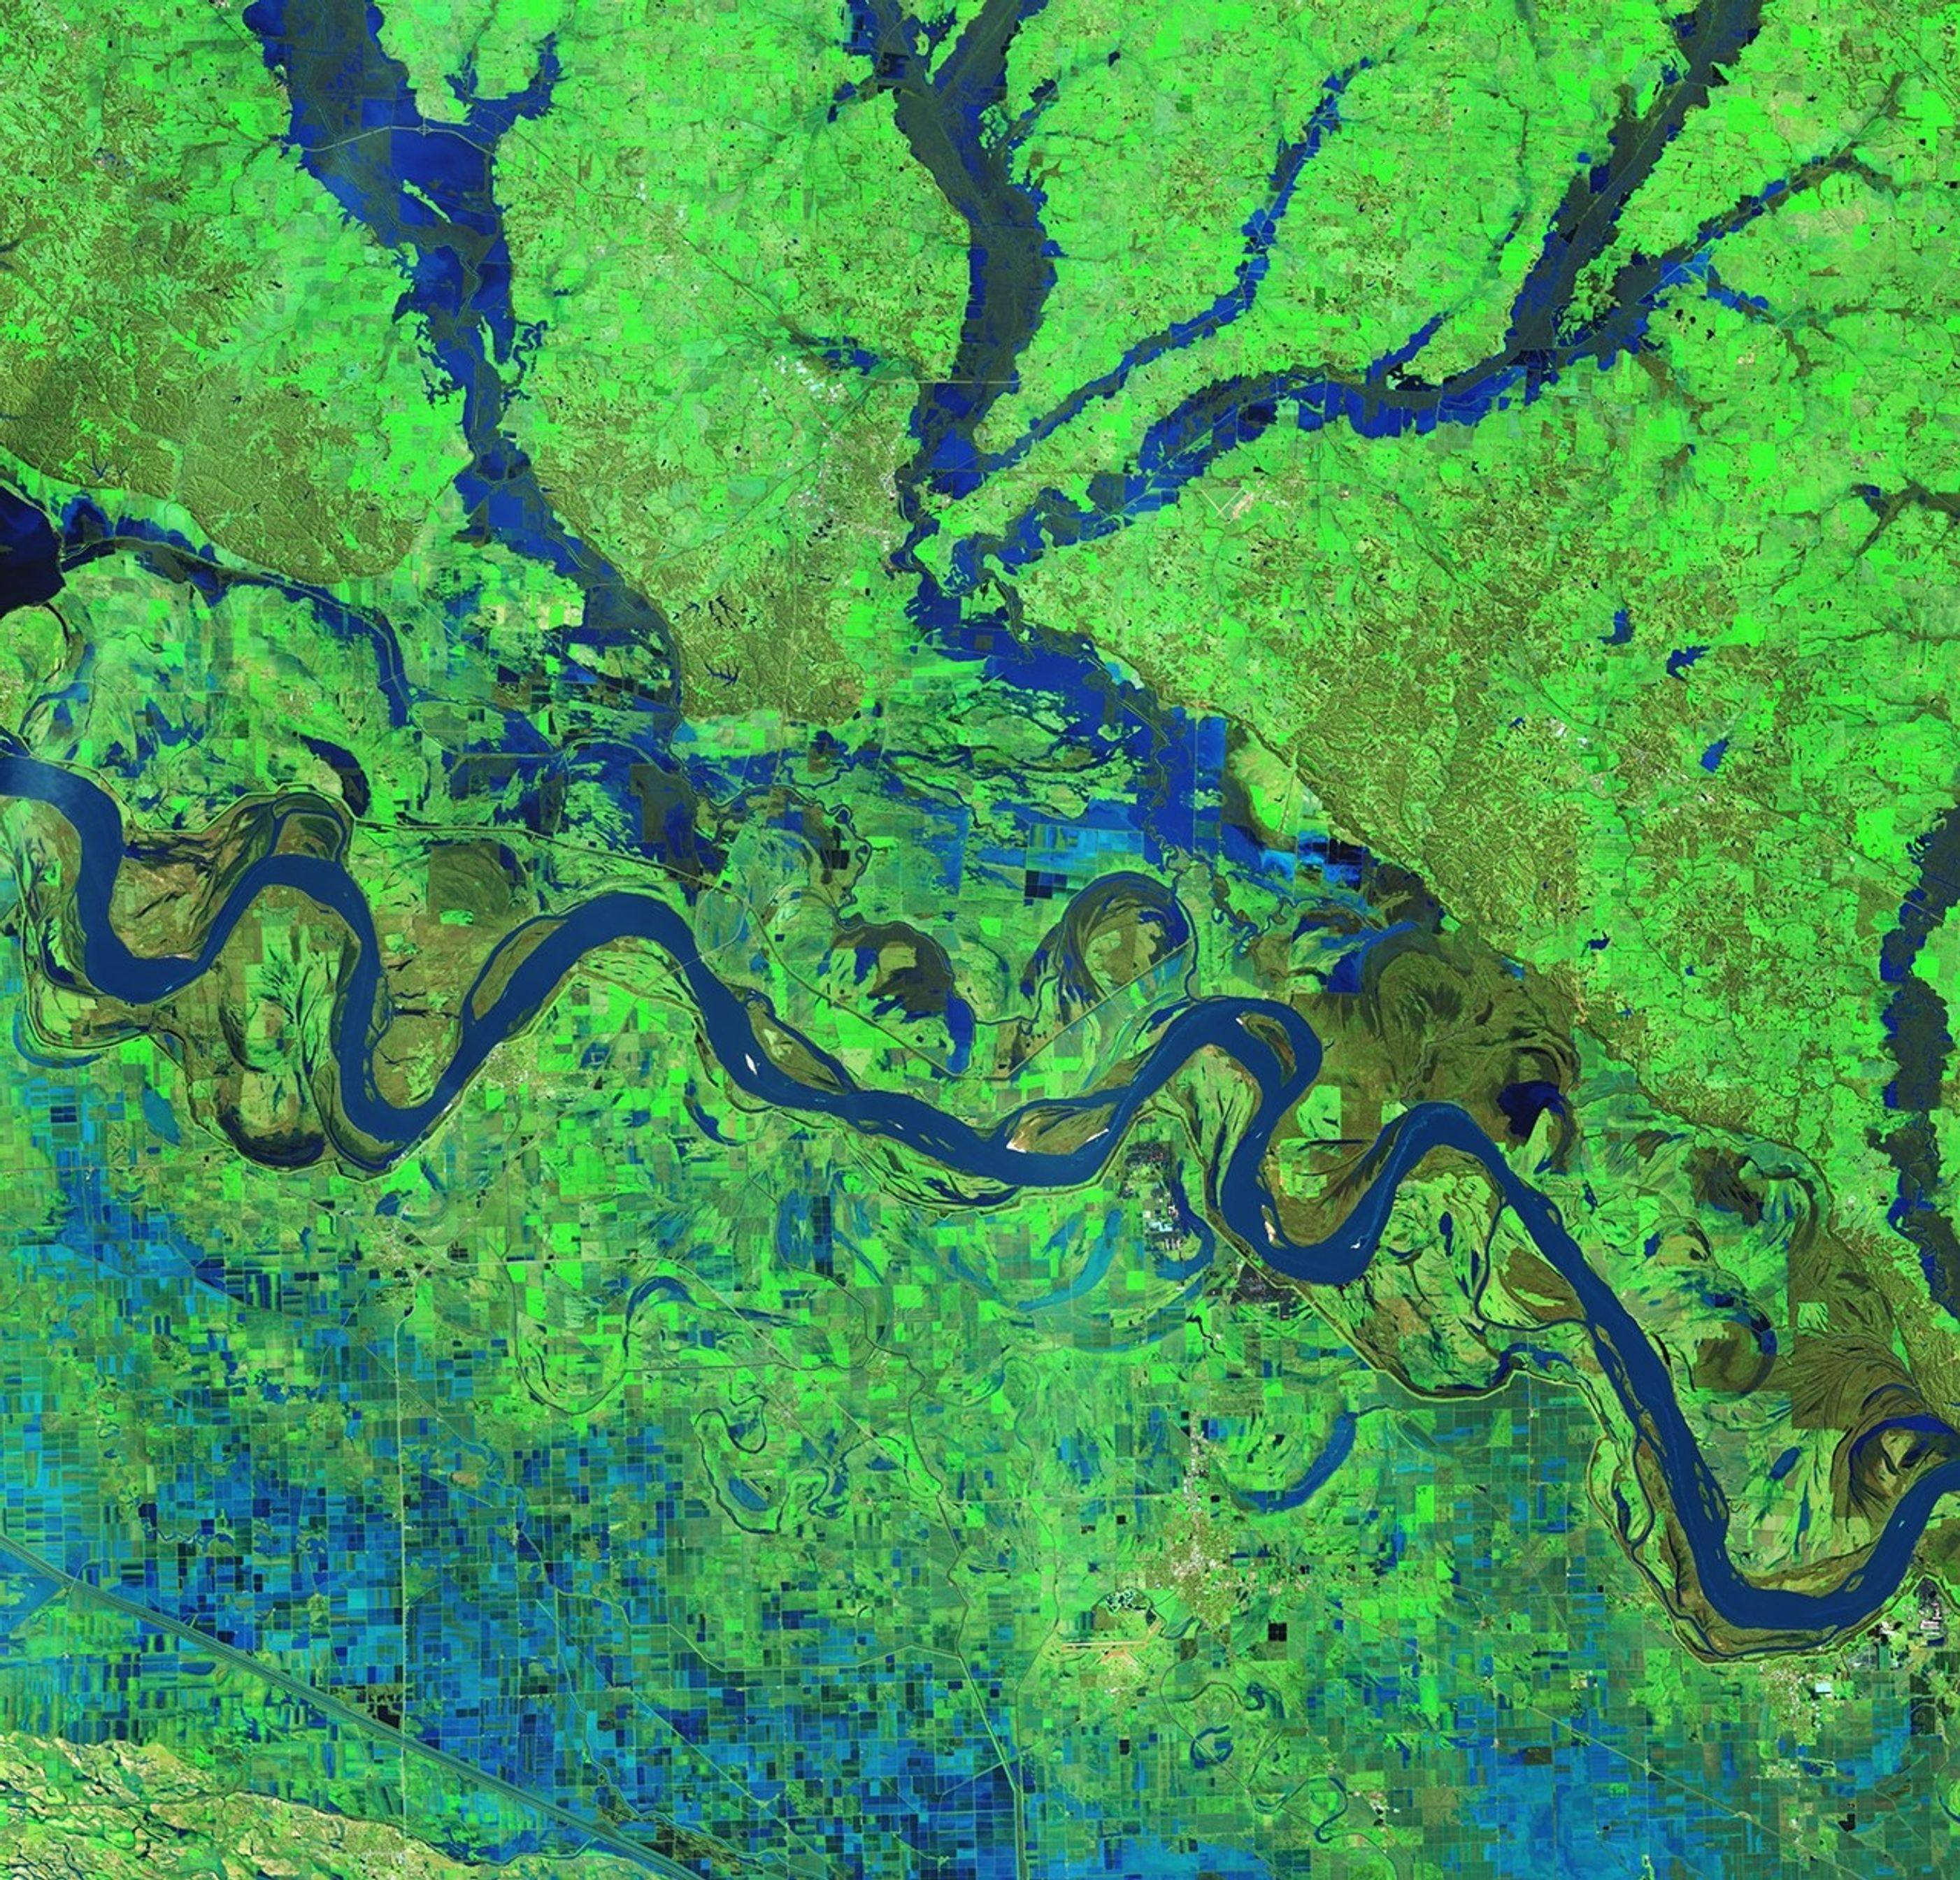
This map, derived from NASA’s GEOS (Goddard Earth Observing System), shows an atmospheric river reaching Washington state in December 2025, during a winter marked by extreme rainfall and too little mountain snow.
NASA’s Scientific Visualization Studio

As the effects of the 2026 snow drought in the western United States carry into summer, NASA Earth data is feeding machine-learning forecasts that inform decisions about water, power, and public safety in Washington state.  

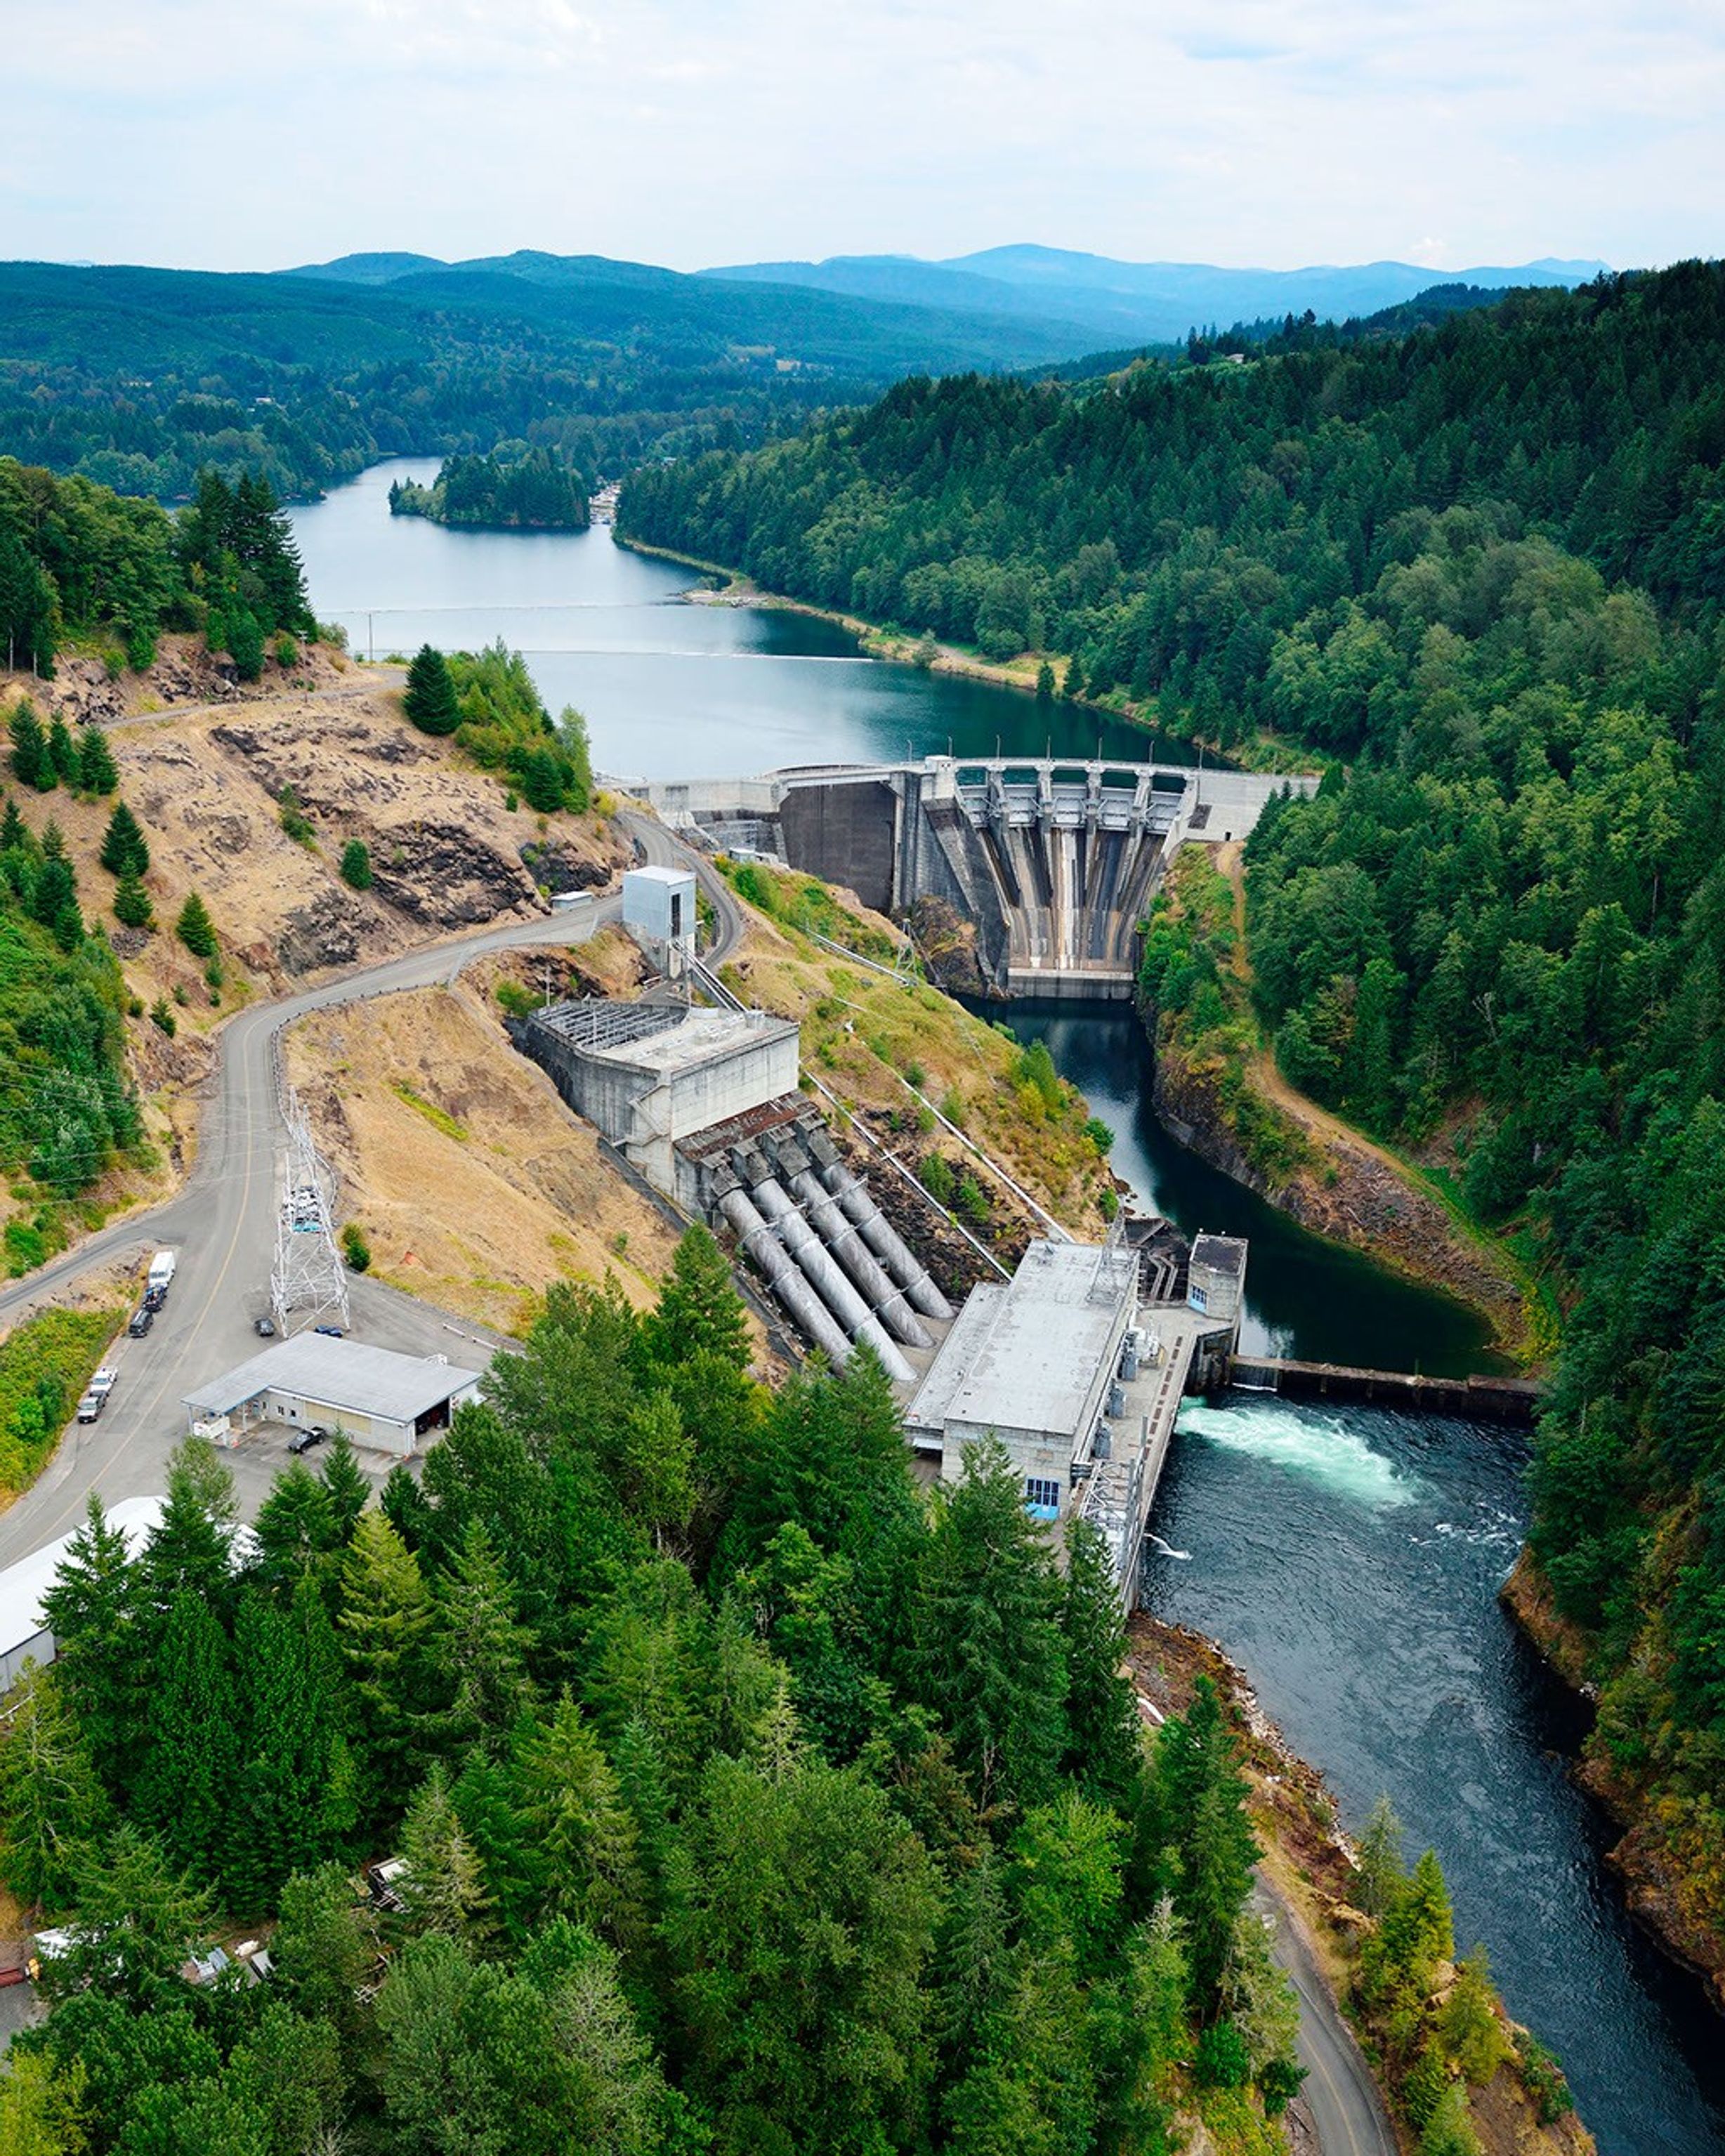
Tacoma Power, a Washington public utility, is using a U.S. technology company’s river-flow forecasts during a year of water extremes on the Cowlitz River. The utility’s largest hydroelectric project uses water stored behind Mayfield and Mossyrock dams to generate enough electricity to serve more than 151,000 homes each year.

Upstream Tech’s HydroForecast combines weather forecasts and river measurements with NASA-produced satellite data on snow cover and vegetation conditions to predict river flow from hours to days ahead. Updated every two hours, the forecasts are used by reservoir managers, hydropower producers, water utilities, and government agencies to prepare for storms, plan reservoir water releases, and navigate dry periods.

“Part of NASA’s mission is to make the view from space useful on the ground,” said Erin Urquhart, manager for NASA’s Water Resources program at the agency’s headquarters in Washington, D.C. “When an American company incorporates NASA’s freely available data into forecasts that help water managers prepare for floods, generate power, and steward water supplies, that’s NASA delivering practical value to the nation.”

Year of water extremes

During the winter of 2025-26, unusual warmth meant a larger share of precipitation fell as rain instead of snow across much of the West, while below-normal precipitation deepened deficits in some areas. January, February, and March each had the lowest Western snow cover for that month in the NASA MODIS (Moderate Resolution Imaging Spectroradiometer) satellite record since 2001.

On the Cowlitz, those conditions produced a season of extremes. In December 2025, a powerful atmospheric river brought a long, narrow band of Pacific moisture into the region, causing one of the largest one-day inflow surges ever recorded at Tacoma Power’s hydroelectric project. Across the season, that rain-heavy pattern sent water downstream quickly instead of building mountain snowpack that would melt and release water steadily into summer. Snowpack remained at just 20% to 50% of normal levels.

As winter became spring, the rain tapered off, and on April 8, Washington state placed every watershed, including the Cowlitz, under a drought emergency. From April through June, peak daily inflow into the project was among the lowest on record, leaving Tacoma Power with less incoming water to replenish its reservoirs ahead of summer demand, said Saul Villarreal, Tacoma Power’s senior hydro operations manager.

Tacoma Power’s Mayfield Dam and powerhouse sit on the Cowlitz River in southwest Washington, where forecasts using NASA data support reservoir operations and hydropower generation.
Tacoma Power, used with permission

Turning satellite data into river forecasts

NASA turns observations collected by the VIIRS (Visible Infrared Imaging Radiometer Suite) instrument on the Suomi-NPP (Suomi National Polar-orbiting Partnership) satellite into data products that provide information about snow cover and vegetation greenness across entire watersheds, including where ground monitors are sparse.

To train HydroForecast, Upstream Tech collects and archives years of those NASA products alongside weather forecast data and actual river-flow measurements. Using records from hundreds of watersheds, the models learn common patterns in how water moves through the landscape and apply them in new locations.

Tests across multiple basins found that including snow and vegetation observations increased forecast skill, said Dr. Laura Read, director of technical and federal partnerships for HydroForecast at Upstream Tech. “NASA’s data gives us the reliability, global coverage, and consistency we need,” said Read. “Our short-term models run every two hours, so those inputs have to show up when we need them. Though we have stopgaps in place, any interruption to our operational pipeline is a huge deal.”

Tacoma Power uses HydroForecast alongside stream gauges, snow stations, and operator judgment. During the December storm, the NASA-informed, short-term forecast helped the utility anticipate how much water would reach the project and prepare for dynamic river conditions, while meeting operating requirements and keeping public safety at the forefront, Villarreal said.

NASA’s GEOS (Goddard Earth Observing System) maps an atmospheric river, a ribbon of water vapor, before Washington’s January-April 2026 snow cover is compared with a historical median.
NASA’s Scientific Visualization Studio

As spring approached, the operational challenge reversed. Tacoma Power used HydroForecast’s seasonal model to track the growing risk of weak runoff and began keeping its reservoirs higher than usual to preserve water for summer. That left less space to contain another large storm, so operators continued checking the short-term forecast “to play defense,” and remained ready to adjust operations if another atmospheric river developed.

“The earlier we understand how conditions might change, the more effective planning we can do to manage our reservoir and balance the many demands of our system throughout the season,” said Villarreal.

Tacoma Power entered summer 2026 with reservoir levels near average despite the dry spring. The stored water supports reliable hydropower, required river flows to support fish and aquatic habitat, and public recreation. It also gives the utility more flexibility to meet electricity demand during heat waves or unexpected outages and, when possible, support the wider regional power system.

From forecasts to drought assessments

Tacoma Public Utilities’ Cowlitz Hydro Project is just one example of NASA science supporting water decisions across the West.

NASA also has partnered with the U.S. Department of Agriculture’s Natural Resources Conservation Service to bring satellite-based snow and groundwater information into machine-learning water-supply forecasts.

The National Oceanic and Atmospheric Administration’s Colorado Basin River Forecast Center uses MODIS and VIIRS data to adjust snowmelt rates in its model. The Bureau of Reclamation uses NASA and NASA-derived snow data, alongside other sources, for reservoir operations in California’s San Joaquin Basin.

NASA data and research have long informed the U.S. Drought Monitor, the weekly assessment used by farmers, water managers, and public agencies. NASA became a formal partner in 2026, expanding its role from providing information to helping produce the assessment. The agency took its first turn authoring the Drought Monitor during the week of Aug. 17.

About the Author

Emily DeMarco

Emily DeMarco

Writer/Editor (IV), Earth Science Division

Emily is a science writer and editor with NASA’s Earth Science Division, with more than 10 years of experience in science journalism and communication. A former deputy news editor at the magazine Science News, she holds a master’s in environmental science and management from UC Santa Barbara’s Bren School, where she specialized in water resources management and science communication.

NASA Mission Studies Air Pollution Over Ethiopia

5 min read

Preparations for Next Moonwalk Simulations Underway (and Underwater)

A busy street in Addis Ababa, Ethiopia’s capital, which is the subject of NASA-led air quality research.
Ninaras (CC BY-SA 4.0)

A NASA-funded air pollution monitoring network has provided one of the most detailed long-term views yet of the role of black carbon, or soot produced by fires, diesel vehicles, and other combustion sources, in Ethiopia’s capital, Addis Ababa. The detailed measurements show how pollution changes by time of day and season, including increases associated with rush-hour traffic and holiday celebrations. The findings are relevant to cities around the world, including in the United States.

In a new paper published in ES&T: Air, scientists analyzed data collected throughout Addis Ababa between 2022 and 2025 from 10 air-quality monitoring sites deployed by NASA’s Multi-Angle Imager for Aerosols (MAIA) project.

The research comes as Ethiopia is taking steps aimed at improving air quality. In 2024, the country became the first in the world to ban the import of internal combustion engine vehicles, while cities have been adding bike lanes and electric vehicle infrastructure. The MAIA project’s measurements provide researchers with a baseline for understanding how air quality changes over time as Addis Ababa continues to grow and evolve.

The study focuses on particulate matter that is 2.5 micrometers or less in diameter, also known as PM2.5. The 2025 State of Global Air Report, cited in the paper, estimates that exposure to PM2.5 is associated with approximately 4.9 million deaths globally each year. Among the many kinds of PM2.5, black carbon has been has been studied for its potential effects on human health.

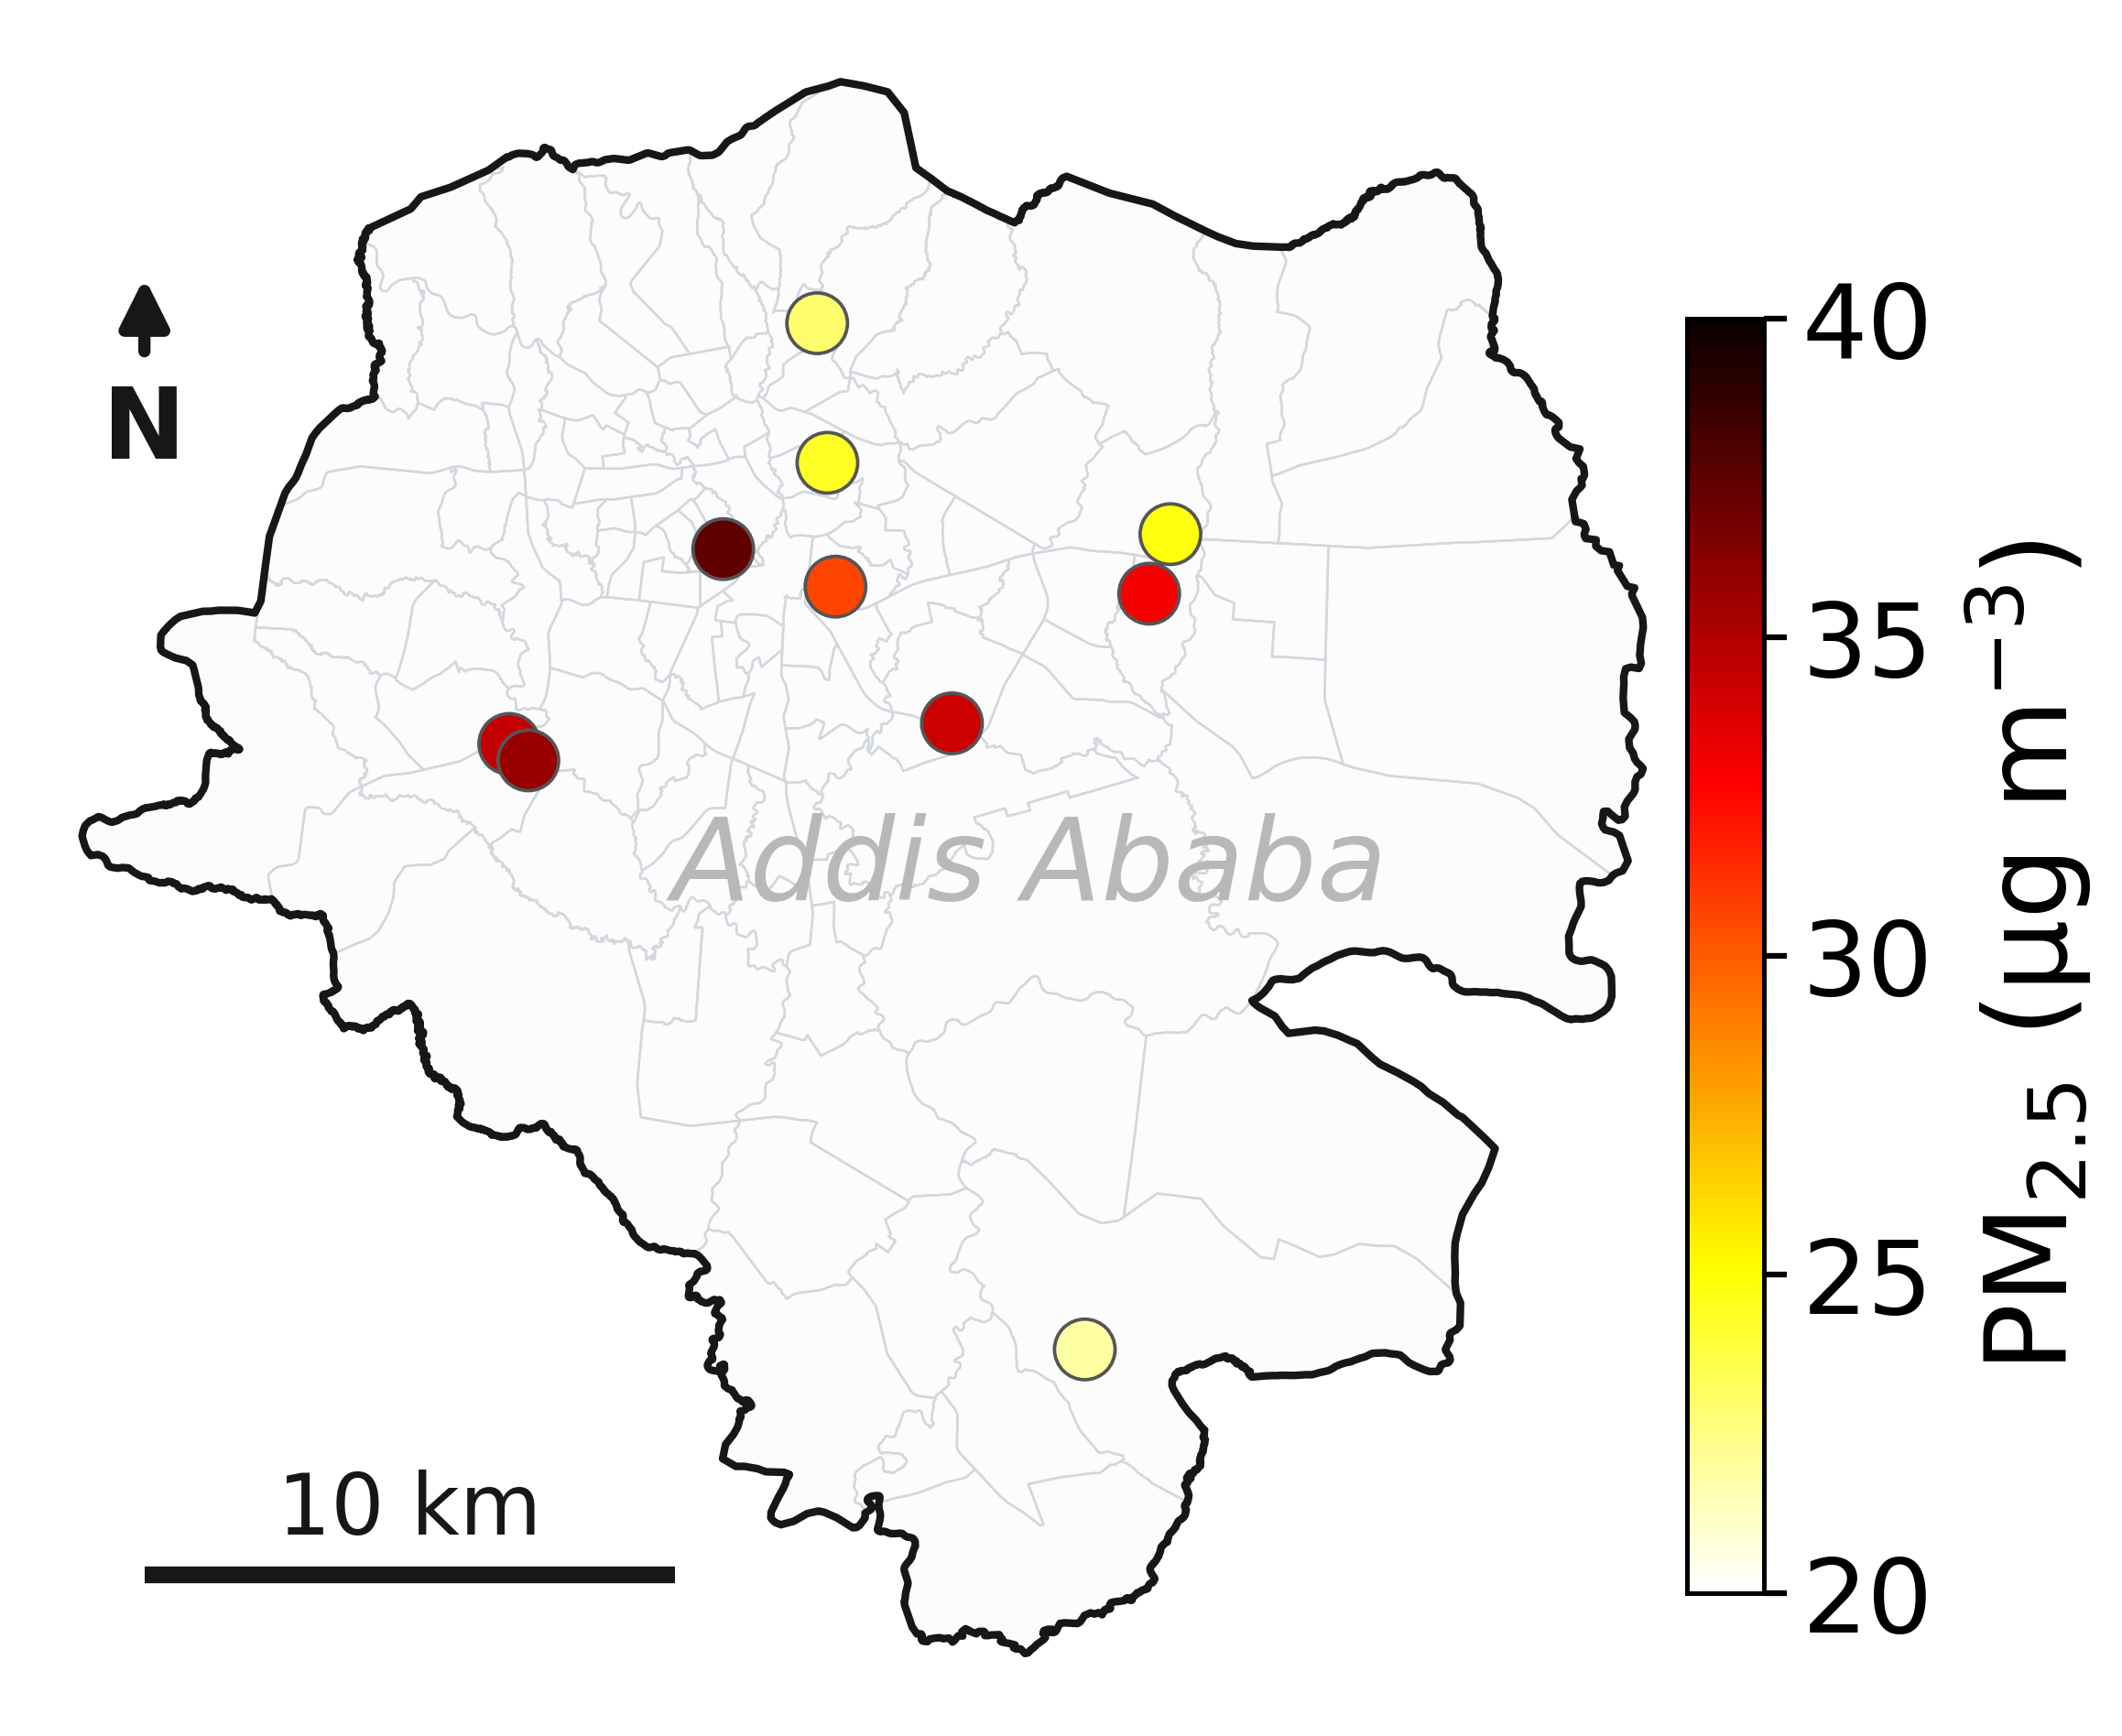
The paper found that Addis Ababa’s three-year average PM2.5 concentration was 30 micrograms per cubic meter, which is more than three times the level of the U.S. Environmental Protection Agency’s health-based annual PM2.5 standard. The new paper cites data from MAIA’s ground sensors indicating that average black carbon levels in Addis Ababa were approximately four to nine times higher than those measured in the three U.S. metropolitan areas the mission is monitoring.

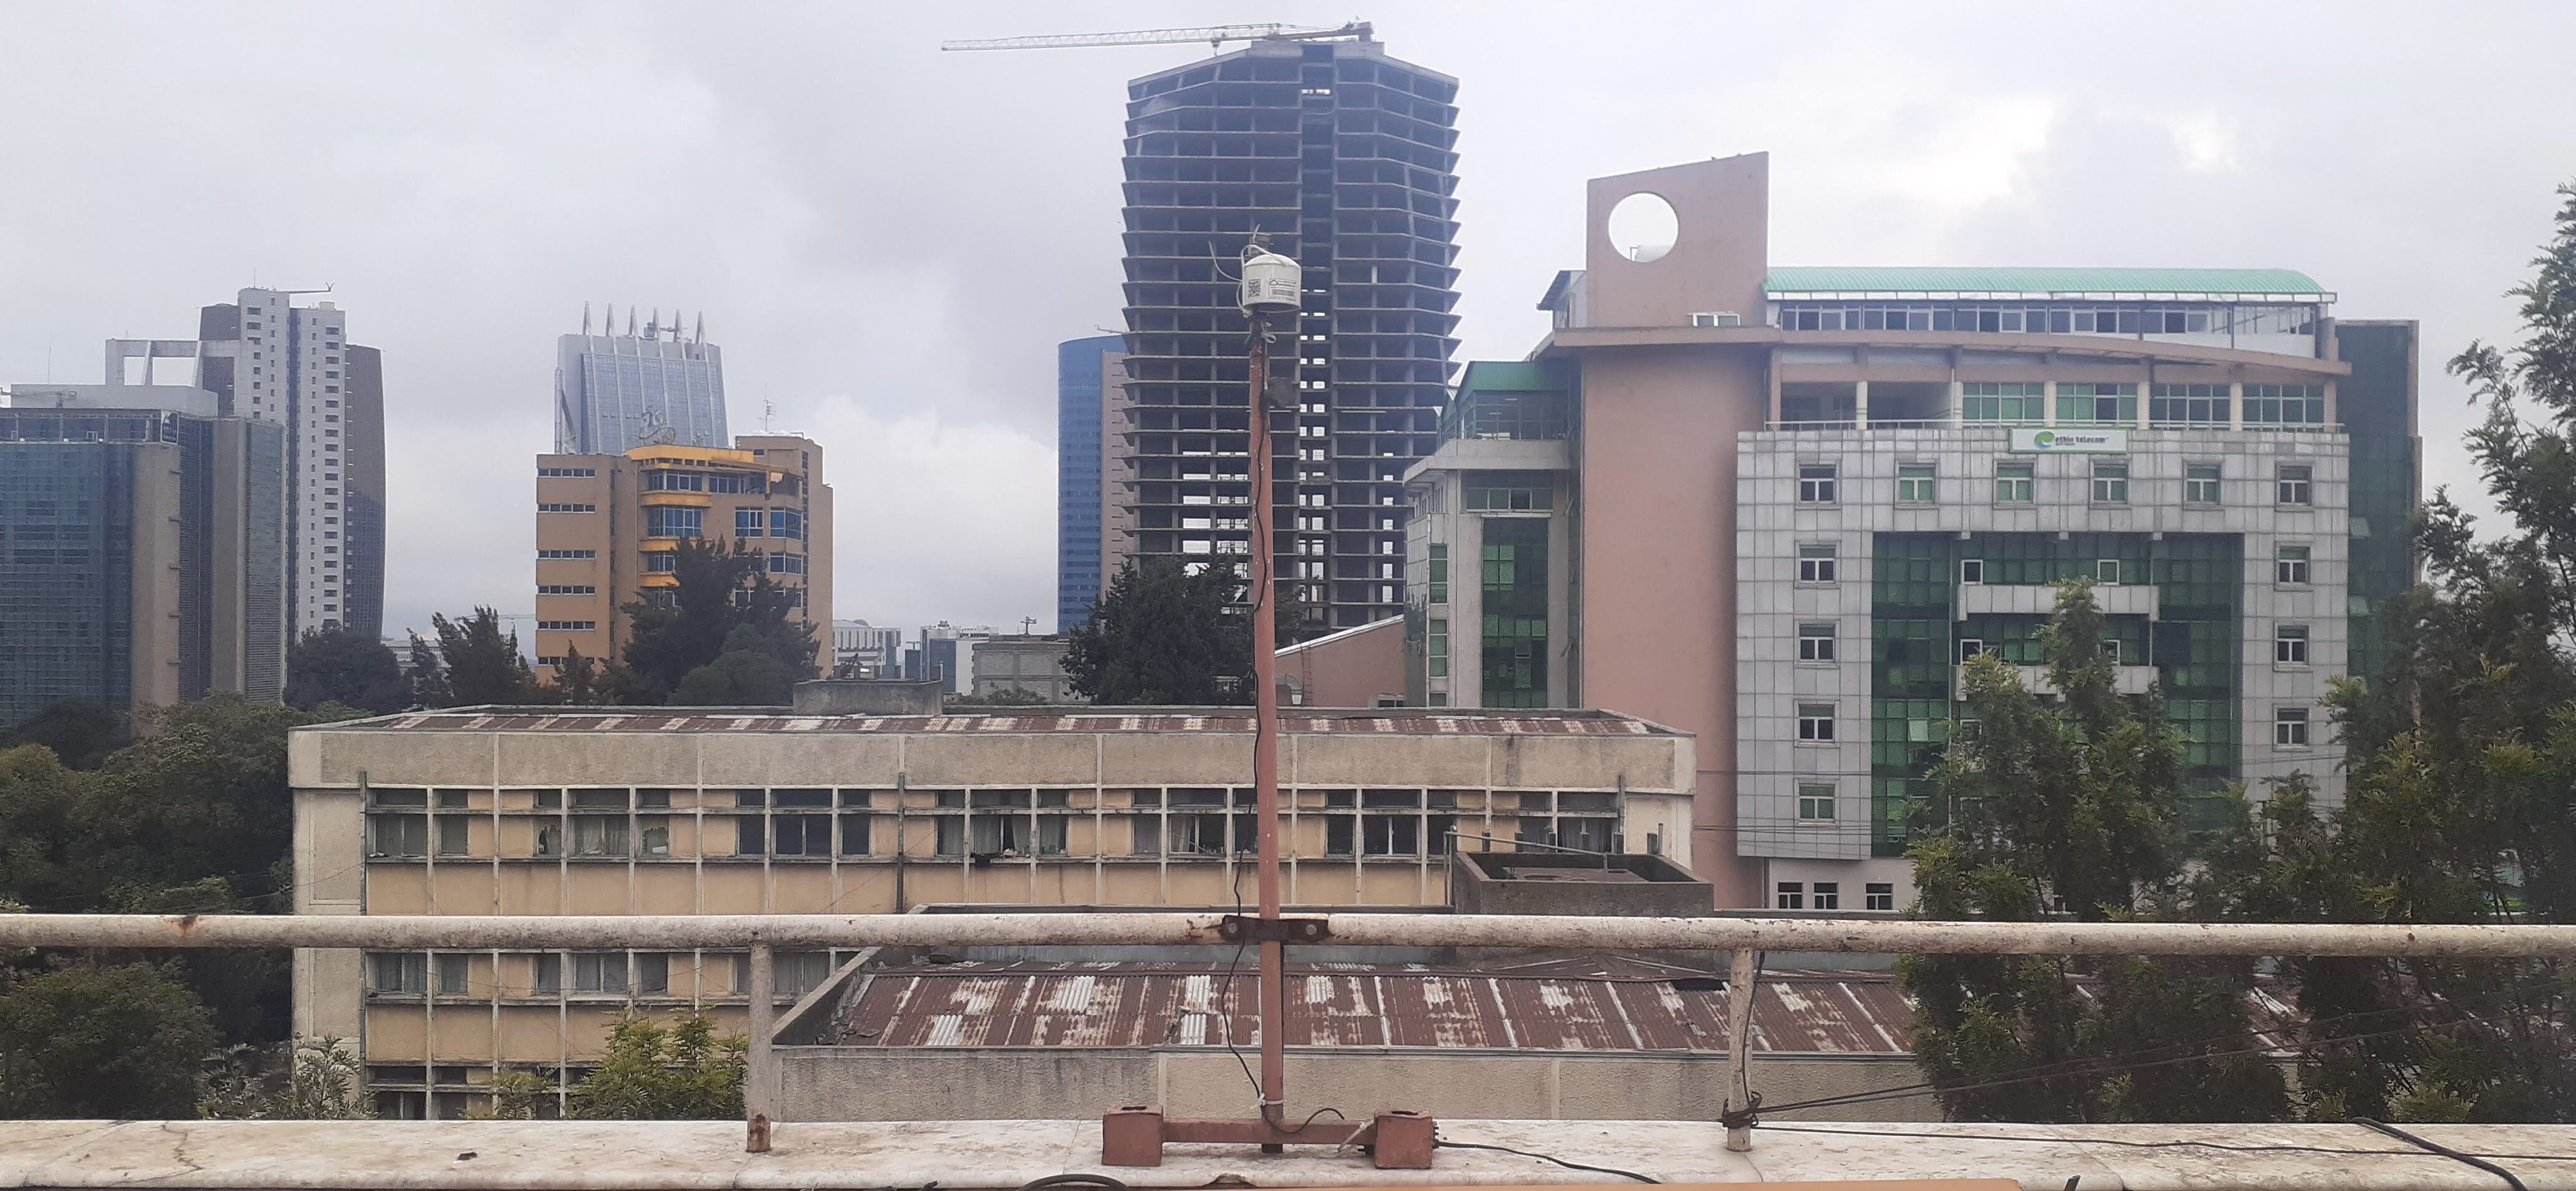
An air quality monitoring sensor mounted on a rooftop stands in front of a dense urban skyline, capturing atmospheric data. The sensor is semi-cylindrical white object several inches across, mounted on a tall rust-colored pole.
This roof-mounted air sensor in Addis Ababa, the capital of Ethiopia, is one of 10 used by NASA’s MAIA mission to study the city’s air quality. MAIA’s air sensors provide a detailed look at PM2.5, one of the world’s deadliest forms of air pollution.
NASA/JPL-Caltech

“To our knowledge, this is the first long-term, multisite study of continuous PM2.5 and black carbon measurements in Ethiopia,” said Sina Hasheminassab, a coauthor of the paper and MAIA’s deputy principal investigator at NASA’s Jet Propulsion Laboratory in Southern California. “Many rapidly growing cities have limited long-term monitoring, so these measurements provide an important baseline for understanding how pollution changes across space and time.”

The composition and sources of PM2.5 can differ substantially between cities, depending on their local geography, traffic, industries, and more. Desert cities, for example, may have more dust, while those near coal-fired power plants may have higher concentrations of sulfate. Long-term surface measurements remain limited in many parts of the world.

NASA is supporting MAIA’s air pollution research in a dozen metropolitan areas around the globe, including three in the U.S.: Los Angeles, Atlanta, and Boston. The mission consists of a ground-based network of sensors already in operation as well as a space observatory, which uses a JPL-built camera that will be launched by the Italian Space Agency (ASI) on an ASI satellite no earlier than late 2027.

The camera is designed to identify different types of PM2.5 aerosols based on how they reflect light, making it possible to map particle concentrations over each city that the mission studies. Mounted on a gimbal, the camera captures data from multiple angles using JPL-pioneered technologies that make particles stand out more prominently against the surface background to provide valuable information about their shape and size.

The MAIA mission is the first NASA project to include public health researchers among a space mission’s team. These researchers will use MAIA’s PM2.5 concentration maps alongside health data to study potential relationships between different particle types and health outcomes. By developing a better understanding of particulate matter pollution, researchers can potentially advance how air quality is studied and managed.

“This paper shows how valuable the air sensor data is on its own, but combining the sensor network and satellite observations will be a game-changer,” said, Kyan Shlipak, the paper’s lead author, who worked on the research while interning at JPL.

Tracking black carbon

The greater Addis Ababa urban area is home to nearly 6 million people, and according to United Nations projections, that figure is expected to surpass 10 million by 2050.

This map of Addis Ababa, the capital of Ethiopia, shows the locations of 10 air sensors that NASA’s MAIA mission is using to provide one of the most detailed looks ever at the city’s air pollution.
NASA/JPL-Caltech

“It’s a cosmopolitan city with many international communities,” said Araya Asfaw of Addis Ababa University, a coauthor of the paper and the MAIA project’s lead Ethiopian collaborator. “Think of it as Africa’s version of Brussels, where the European Union is based.”

“Even at night, when traffic dies down, you see high emissions from the burning of charcoal and other fuels,” Asfaw said.

The MAIA sensor network detected increases in black carbon during two major holidays in Addis Ababa that involve bonfires and was able to distinguish between particles originating from the fires and those from fossil fuel combustion. The findings demonstrate how detailed measurements can help researchers identify different sources of particulate matter and better understand how air quality varies across a city and over time.

To learn more about MAIA, visit:

https://science.nasa.gov/mission/maia/

2026-056

❌