Longtime Slashdot reader AmiMoJo shares a report from the BBC: August was the joint-hottest month ever recorded, tying with July 2023, according to the EU's climate service. The record was driven by a combination of climate change and the rising influence of El Nino, pushing heat into the atmosphere across the Pacific. Temperatures for the month were 1.65C above pre-industrial levels -- surpassing the critical 1.5C threshold agreed by countries to avoid the worst consequences of climate change. While a single month above 1.5C does not mean it has been permanently crossed, it shows a trend towards breaching that limit. The month also capped western Europe's warmest summer, with high temperatures pushing the season past the deadly heat of 2003.
An anonymous reader quotes a report from The Guardian: Rising global temperatures caused by the burning of fossil fuels are transforming the world's forests, wetlands and tundra to the point they are releasing emissions that could further worsen global heating by as much as 30%, a new study has found. As the world heats up, permafrost in the high latitudes is thawing, fiercer wildfires are burning in drying forests and wetlands and lakes are warming. All of these changes are themselves causing the release of planet-heating methane and carbon dioxide locked in trees and soils, therefore worsening the climate crisis, the paper states.
While scientists have long known of these "feedback loops" that amplify the impact of direct pollution from burning coal, oil and gas, the emissions from natural sources are largely unaccounted for in climate projections. This additional heating is however significant, researchers found, with emissions from natural sources set to amplify global heating by 20% to 30% by the end of this century. This would add an estimated 0.2C to 0.4C to the global average temperature by this time, depending on the overall action taken by countries to combat the climate crisis.
[...] This latest paper makes clear that action by countries to cut fossil fuel pollution will still lessen the amount of additional emissions that come from landscapes. Under the most optimistic climate scenario where emissions are cut quickly, natural sources will add 0.2C of warming, the paper found. Under a worse case higher emissions scenario, 0.4C will likely be added. Current policies put in place by governments are likely to see the global temperature rise to 2.6C above pre-industrial times, according to Climate Action Tracker. This will likely cause severe disruption and hardship to billions of people through sea level rise, crop losses and other consequences. "This hidden multiplier is missing from the models guiding climate policy, so those models are likely underestimating how much warming is coming -- and overestimating how much carbon we can still afford to emit," said Sam Abernethy, a scientist at Spark Climate Solutions who led the research, published in Environmental Research Letters.
The disruption of the worldâ(TM)s carbon cycles is now being seen in "real time," said Rob Jackson, a Stanford University scientist and study co-author. "The results are a wake-up call, and itâ(TM)s imperative that they be included in the next generation of climate policies," he added. "Failure to do so will make meeting the worldâ(TM)s climate goals less and less likely."
Nearly every country represented in the United Nations General Assembly recently voted in favor of promoting world maps that more accurately show the size of various continents. But the UN resolution is unlikely to change how millions of people regularly see versions of 16th-century Mercator maps depicting skewed continent sizes in navigation apps.
On September 4, the African-led resolution attracted 164 votes in favor, with six countries abstaining from voting. Only the United States voted to oppose the resolution after describing it as a “radical ideological project,” according to UN News.
The non-binding UN resolution does not impose map changes on anyone. Instead, it “encourages governments, schools, international organizations, and technology companies to use the Equal Earth projection and other so-called equal-area maps when relative size matters,” UN News reported. The resolution also encourages teaching about the trade-offs that arise from depicting a spherical planet on a flat map.
Preparations for Next Moonwalk Simulations Underway (and Underwater)
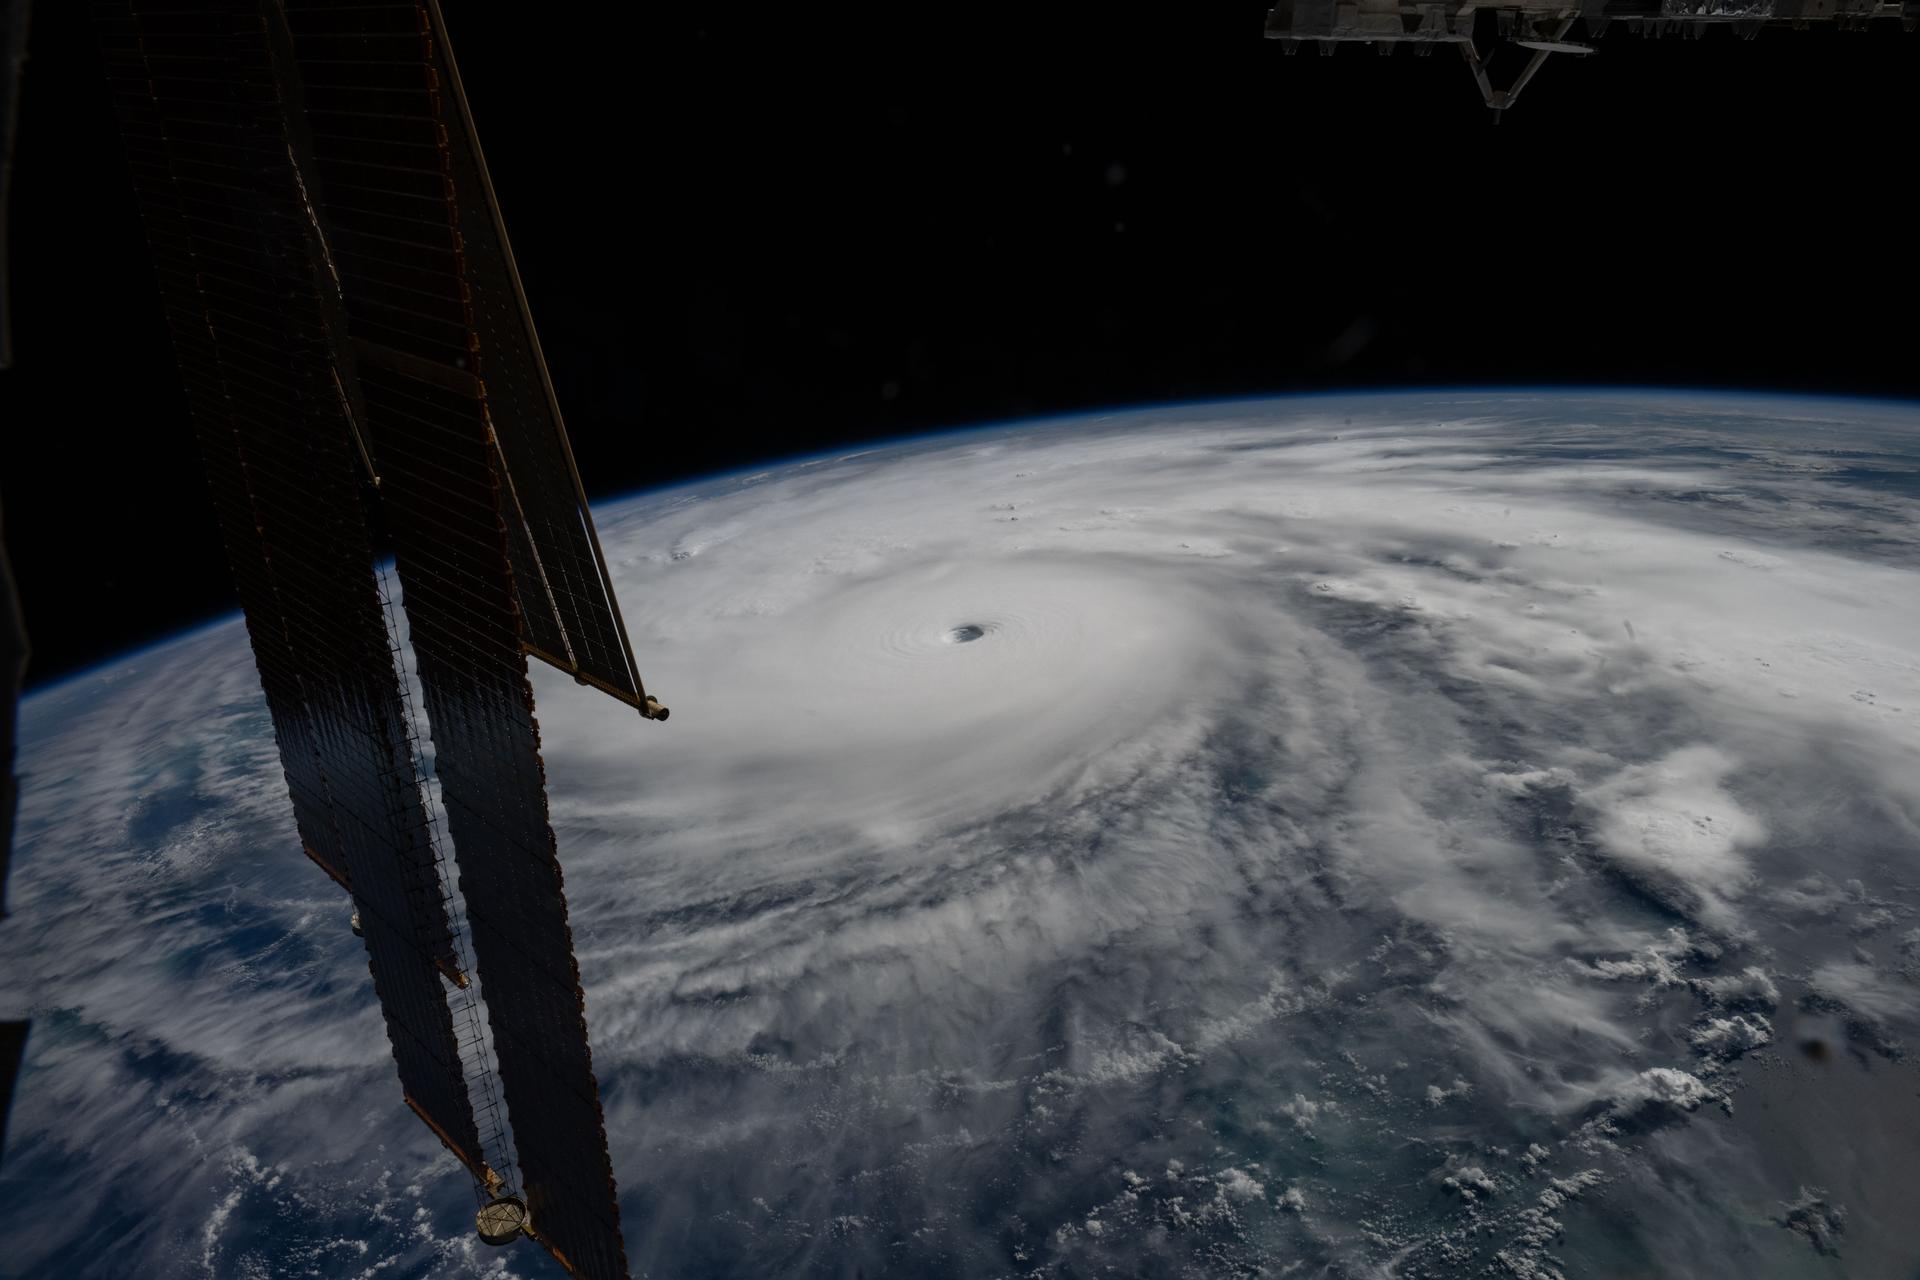
Hurricane Melissa is seen 50 miles south of Jamaica in this photograph taken from the International Space Station on Oct. 28, 2025.
NASA
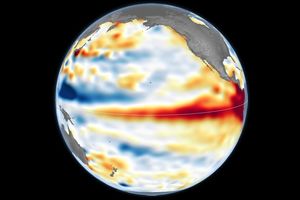
Last November, NASA and its European partners launched the Sentinel-6B satellite to improve hurricane forecasts, help protect infrastructure, and benefit commercial industries, including shipping. The satellite now is flying 30 seconds behind its predecessor, Sentinel-6 Michael Freilich. Both satellites are providing precise sea level height measurements during what oceanographers expect to be a historic El Niño, a naturally occurring oceanic phenomenon in which warmer-than-usual Pacific waters shift global weather patterns.
The two satellites make up the Copernicus Sentinel-6/Jason-CS (Continuity of Service) mission, the latest in a series of ocean-observing radar altimetry missions that have been monitoring Earth’s changing seas continuously since the early 1990s.
The data each satellite is collecting will not only allow scientists to better understand this year’s El Niño but will also help them create more accurate hurricane predictions.
“This El Niño was a late-bloomer,” said Josh Willis, Sentinel-6B’s project scientist at NASA’s Jet Propulsion Laboratory in Southern California. “It didn’t kick off until the middle of the year and is just now reaching a strength similar to what we’ve seen in the satellite record during significant El Niños in 1997 and 2015. We expect it to be big, and it’s already having big impacts.”
El Niños generally scramble weather patterns tied to rainfall and storms, including hurricanes. They also redistribute heat in the ocean, which affects sea level. Normally, Earth’s warmest ocean waters sit along the equator in the western Pacific. During El Niño, weakened winds, which usually blow westward along the equator, result in heat spreading east toward South America. The change in ocean heat shifts hurricane activity from the Atlantic to the Pacific Ocean.
Predicting hurricane strength
On July 15, Sentinel-6B began delivering low-latency data to scientists that could be used for weather predictions. That data will take some time to work its way into the research models on which meteorologists and climate scientists rely, but when it does, those improved models could save lives.
Data from Sentinel-6 satellite missions feeds into hurricane tracking algorithms used by federal and state agencies. Those predictions can activate disaster response efforts, mobilizing resources ranging from sandbag placement to National Guard activation. They also can lead to evacuation orders that require quick but well-informed decisions about logistics at a local level. More severe events may require engaging larger organizations, such as the Federal Emergency Management Agency.
A tropical storm can take a week or more to become a hurricane and make its way to a coastline, but a hurricane can rapidly intensify in the 48 hours prior to landfall, leaving planners little time to prepare.
“Hurricanes have been known to speed up quickly at the last moment, so the window in which to decide what to do is short,” said Deirdre Byrne, an oceanographer and altimetry expert with the National Oceanic and Atmospheric Administration (NOAA). “The goal is to forecast how much and how rapidly intensification will happen so that officials can make the right calls.”
Each Sentinel-6 satellite measures ocean height, as well as the size of waves and marine wind speed, using a radar altimeter, which bounces thousands of radar pulses a second off the crests and troughs of waves. Ocean height varies from place to place and provides insight into the ocean’s heat content, since warm water expands. That, in turn, helps forecast how fast hurricanes will grow.
Among the measurements Sentinel-6 is gathering, Byrne is most anticipating the ocean height data, which she plans to begin incorporating into the current Satellite Ocean Heat Content Suite algorithm by the end of the year.
“In terms of data quality, the Sentinel-6 missions are unparalleled,” Byrne said.
Together, the missions are also extending a precise dataset deep into its fourth decade. This record of sea level observations traces back to the TOPEX/Poseidon mission, which launched in 1992, and continues through to the present day with Sentinel-6 Michael Freilich. Sentinel-6B will take over for its predecessor as the reference satellite for global sea level measurements later this year.
“The key is consistency, measuring the same way, every time,” said Severine Fournier, Sentinel-6B deputy project scientist, JPL. “That’s what lets us predict hurricanes, and, in turn, protect coastal communities and infrastructure.”
More about Sentinel-6B
Sentinel-6 Michael Freilich, named after a former director of NASA’s Earth Science Division, is one of two satellites that compose the Copernicus Sentinel-6/Jason-CS mission.
Sentinel-6/Jason-CS, a part of the European Union’s Earth observation program called Copernicus, was jointly developed by ESA (European Space Agency), EUMETSAT (European Organisation for the Exploitation of Meteorological Satellites), NASA, and NOAA, with funding support from the European Commission and technical support on performance from the French space agency CNES (Centre National d’Études Spatiales). Spacecraft monitoring and control, as well as the processing of all the altimeter science data, is carried out by EUMETSAT on behalf of the European Union’s Copernicus Programme, with the support of all partner agencies.
NASA JPL, a division of Caltech in Pasadena, contributed three science instruments for each Sentinel-6 satellite: the Advanced Microwave Radiometer, the GNSS-RO, and the Laser Retroreflector Array. NASA also contributed launch services, ground systems supporting operation of the agency’s science instruments, the science data processors for two of these instruments, and support for the United States members of the international Ocean Surface Topography Science Team.
An anonymous reader quotes a report from The Guardian: Global heating will reach at least 1.8C under even the most optimistic future, well beyond the Paris agreement goal of 1.5C, according to a UN report that warns every fraction of temperature rise intensifies destructive extreme weather, glacier melt, ecosystem loss, and island and coastal city submersion. The report by the Nairobi-based UN Environment Program confirmed overshooting the 1.5C goal inscribed in the landmark Paris agreement of 2015 was now "unavoidable" and, despite some progress in addressing the human-caused climate crisis driven by burning fossil fuels, likely in the next few years. It said: "There are no good outcomes above 1.5C."
Heating of up to 3C above preindustrial levels could lead to glaciers losing more than a quarter of their mass by 2100, raising sea levels by up to 13cm. Global food production could decline by up to 14% by 2050 if there are not effective strategies to adapt. Human health, water supplies, nature, cities, infrastructure and economies could all be severely damaged. Some losses would be irreversible. Many communities may have to relocate or change their livelihoods. The report said the best hope for humanity to limit damage was to adopt an "overshoot, peak and decline" pathway that required immediate and sustained greenhouse gas emissions cuts combined with steps to remove carbon dioxide from the atmosphere.
It described the goal of net zero emissions -- increasingly politically contentious in some countries -- as "an essential milestone that cannot be skipped" and stressed carbon dioxide removal through steps such as establishing vast new forests must occur alongside, not as an alternative to, deep cuts in fossil pollution. Crucially, the authors of the report, titled Limiting Overshoot, said the average global temperature could be returned to 1.5C this century only if heating stayed below about 1.8C. They warned nature's capacity to store carbon was uncertain and would shrink the more the planet heats. [...] The report's authors cited earlier work that found limiting heating to about 1.8C required global emissions to be halved by 2035. They said existing national policies were projected to lead to at least 2.3C heating, but it would still be possible to limit stay below 2C if countries delivered on net zero emissions commitments by mid-century.
Researchers have found that tiny electrical charges picked up by moving water droplets may be damaging cars and buildings like the Eiffel Tower. In experiments, thousands of charged droplets degraded Teflon and corroded the copper beneath it, while uncharged droplets caused no comparable damage. C&EN reports: For years, researchers at the Max Planck Institute for Polymer Research have studied how water droplets from rain, dew, ocean waves, and melting snow become electrically charged. They say the process is like tribocharging, which causes static when we rub certain objects together, such as a balloon on our hair or a sweater on our skin. "Water drops spontaneously become electrically charged when moving on different surfaces, such as plant leaves, insect wings, building walls, window glass, and plastic. This process, known as contact or sliding electrification, is analogous to tribocharging between solids," says study coauthor Zhongyuan Ni, a PhD candidate at Max Planck. "Water drops getting charged is not a new phenomenon, but for the past 200 years, people have not paid attention to this," Ni says.
In 2023, Ni and colleagues set out to determine whether electrically charged water droplets affect the surfaces they contact. To find out, the team poured water over four common surfaces -- a plant leaf; polyvinyl chloride foam board; polystyrene glass; and perfluoro octadecyltrichlorosilane (PFOTS), a commonly used water-repelling coating -- and let it drip onto sheets of Teflon-coated copper tilted at 50 degrees. When the experiments began, the team would allow only a few dozen drops to fall onto the copper before using electron microscopy to examine it. The researchers repeatedly failed to find any evidence of decay. But one day, Ni just let the drops keep falling. "After thousands of drops, it looked like the drops were pinning onto the surface," he says. After inspecting the copper under the microscope, Ni got his first glimpse of the destructive strength of electrically charged water drops.
After repeating the experiment several times with thousands rather than dozens of drops, the researchers found that the electrified water drops not only broke down the Teflon coating but also corroded the underlying copper. Up close, the copper sheets looked like scraped-up skin. But when the experiment was conducted with nonelectrified drops, neither the copper nor its Teflon coating was any worse for wear. Even though the drops contained only around 0.2 to 2.0 nanocoulombs of charge -- around one billionth of a standard unit -- the impact of the charged drops was significant. "The finding is important because it suggests that the electrical state of a water droplet, not just its chemical composition, acidity, or mechanical impact, can influence how corrosion begins," says Guangwen Zhou, a professor of mechanical engineering at Binghamton University who was not involved in the study.
"This perspective could open up new approaches to designing protective coatings and materials that are more resistant to corrosion in environments where charged water droplets are present."
Starstruck: NASA Research Shows How Sun’s Ancient History Shaped Earth
At the center of our solar system, the Sun influences every planet that orbits it. In two recent NASA-funded studies, scientists uncovered how ancient events in the Sun’s history may have helped create Earth’s unique climate and driven previously unexplained climatic shifts.
In new research, scientists at NASA’s SHIELD (Solar Wind with Hydrogen Ion charge Exchange and Large-Scale Dynamics) center — one of NASA’s DRIVE (Diversify, Realize, Integrate, Venture, Educate) Science Centers — trace the trajectory of the heliosphere, the massive bubble created by our Sun that envelops our solar system, as it moved through our galaxy and influenced Earth’s climate along the way. In another paper, a NASA scientist and coauthors investigate how the younger, dimmer Sun managed to heat Earth by seeding the production of potent greenhouse gases.
A Sun on the move
Over the last tens of millions of years, Earth’s climate has undergone significant shifts, including notable ice ages in which the global average temperature temporarily dropped by several degrees. During these periods, more frequent climate swings led Earth to warm and cool. To explain these periods of warming and cooling, scientists looked to factors internal to Earth, including orbital changes, greenhouse gases, and ice. But new research suggests changes to the Sun’s environment may be key to understanding Earth’s temperature swings.
Just as our planet is encased by an atmosphere, so our entire solar system is encased inside a kind of “atmosphere” created by the Sun. This protective bubble, known as the heliosphere, is formed by a continuous solar wind of charged particles streaming out from the Sun in all directions.
This conceptual animation begins with a view of the Milky Way Galaxy. As we zoom in, we travel to the Local Interstellar Cloud, and then to the heliosphere, the protective bubble that surrounds our solar system. The heliosphere is formed by a continuous stream of charged particles from the Sun, called the solar wind.
NASA’s Goddard Space Flight Center Conceptual Image Lab
Our heliosphere orbits around the center of our galaxy, the Milky Way. Throughout the Sun’s 4.6-billion-year existence, our heliosphere has traversed various regions within our galaxy. In a paper published on Aug. 21 in Annual Review of Astronomy and Astrophysics, researchers at NASA’s SHIELD used computer modeling to reverse-engineer the path of the heliosphere through our galaxy, revealing that the environments it passed through may have triggered changes on Earth.
Merav Opher, SHIELD’s principal investigator at Boston University, and her team ran simulations that showed the Sun has encountered frigid expanses of gas and dust at least three different times in the past few million years. In these instances, massive interstellar “cold clouds” pushed against the heliosphere to such an extent that it shrank to smaller than Earth’s orbit, stranding our planet outside the Sun’s protective shield.
These exposures — approximately 2 to 3 million years, 6 to 7 million years, and 13 to 14 million years ago — would have exposed Earth’s atmosphere to totally different surroundings. The simulation results match geologic evidence: Elements prevalent in interstellar dust appear in deep-sea sediment core samples, Antarctic snow, and lunar samples during these timelines.
This animated illustration shows Earth and the Sun protected by the heliosphere, the massive bubble created by our Sun. As our solar system traverses through the galaxy, encounters with massive interstellar “cold clouds” pushed against the heliosphere and caused the heliosphere to shrink past Earth, exposing the planet to cosmic radiation and elements from interstellar space.
NASA’s SHIELD DRIVE Science Center/Merav Opher/Harvard Radcliffe Institute
These heliosphere collapse events may also explain ancient climatic patterns on Earth. In the simulations, when Earth’s atmosphere was exposed to a cold, dense galactic hydrogen cloud, it increased water vapor content and shifted upper-atmospheric dynamics, ultimately altering the conditions at the surface. In summary, our heliosphere’s trips through colder regions in our galaxy may be a key factor in driving some of Earth’s ancient changes in climate, including possible ice ages.
Next frontier in studying heliophysics
The SHIELD center is one of several that NASA funds to unlock the next generation of heliospheric research. As a DRIVE Science Center, SHIELD builds a team of researchers with differing expertise, approaches, and opinions to develop a model, or “digital twin,” of the heliosphere that helps reveal how the heliosphere interacts with its surroundings, including dense interstellar clouds. Understanding our unique, habitable solar system will help unravel the mysteries of life’s evolution on Earth and potentially uncover other habitable star systems.
Young Sun
In another paper, Vladimir Airapetian, a scientist at NASA’s Goddard Space Flight Center in Greenbelt, Maryland, focuses on a long-standing mystery of how the ancient Sun warmed early Earth enough to sustain life. Three billion years ago, the young Sun was 70% as bright as it is today. Under these dimmer conditions, Earth should have been frozen solid. Yet geological evidence shows stable liquid water already existed long before that. This puzzle — a balmy Earth under a cooler, dimmer Sun — is known as the Faint Young Sun paradox.
One clue to resolving the paradox comes from young Sun-like stars elsewhere in the galaxy. These “toddler” stars are prone to throwing fits. Specifically, data from NASA’s retired Kepler space telescope shows that young Sun-like stars regularly erupt with massive superflares, flinging high-energy particles in all directions on a daily basis. If our young Sun was like these other stars, Airapetian proposes, the barrage of high-energy solar particles could have triggered chemical reactions that were key to warming early Earth.
Airapetian’s team simulated early Earth’s atmosphere in a sealed chamber, mixing molecular nitrogen, ammonia, carbon dioxide, and carbon monoxide. They then fired protons into the mixture, simulating the onslaught of particles from superflares. This proton bombardment triggered several changes including the production of nitrous oxide, a greenhouse gas 300 times more potent than carbon dioxide. The research was published in Astrophysical Journal Letters.
This nitrous oxide could help Earth hold onto heat. But not all the nitrous oxide would last. The young Sun’s intense ultraviolet radiation would break some of it down, splitting the molecule back into nitrogen and oxygen. But even if only 10% of the nitrous observed in the experiment survived, Airapetian’s team’s computer simulations confirmed, it would still warm Earth’s equatorial regions to about 41 degrees Fahrenheit (5 degrees Celsius), above water’s freezing point. This smaller amount of nitrous could even accelerate prebiotic synthesis: just-above-freezing temperatures have been found to be more efficient for building complex chains of amino acids than warmer temperatures.
Unearthing secrets of our star-planet system
Together, these two studies show that the Sun can lead to surprising implications for Earth. While our planet stands alone in many ways, it was formed and has always existed as part of a star-planet system. Understanding that unique relationship promises new insights about both Earth and the star that sustains it.
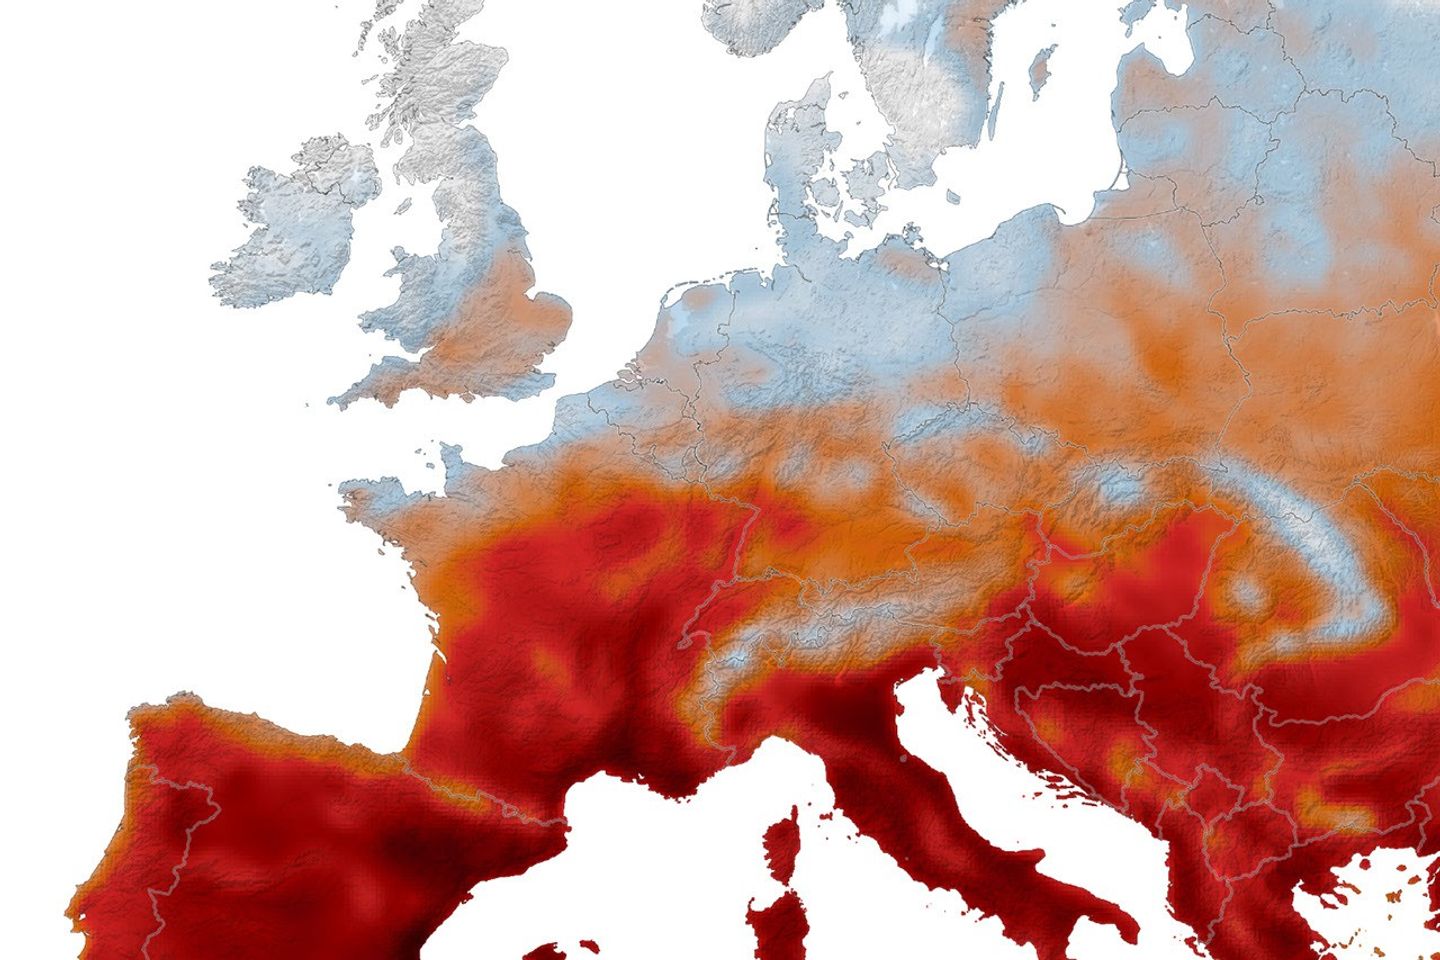
Output from NASA’s GEOS (Goddard Earth Observing System) global model shows daily maximum surface air temperature across Western Europe from May 1 to August 19, 2026. The darkest red areas indicate temperatures that met or exceeded 40°C (104°F).
NASA Earth Observatory/Lauren Dauphin
Western Europe got its first hint of an unusual summer in May 2026, when a heat dome produced exceptional temperatures that shattered records in several countries. Remarkable as it was, that early heat wave turned out to be only the opening salvo.
By mid-August, Europeans were sweating through their fifth heat wave of the season, with the latest onslaught pushing temperatures well above 40 degrees Celsius (104 degrees Fahrenheit) across a broad area. During these bouts of extreme weather, high temperatures were often unrelenting, persisting for several days and sometimes weeks on end, and remaining overnight.
For a region accustomed to relatively mild summers, the heat upended everyday life. Hospitalizations and heat-related deaths spiked. Highways and train tracks buckled, forcing road closures and service disruptions. Large and destructive wildfires raged in areas where they were once rarely seen. The heat also worsened the severe drought that has gripped the region for months, contributing to record-low river water levels and disrupting water and power supplies, transportation routes, and agriculture.
The animation above shows the daily maximum surface air temperature across Western Europe from May 1 to August 19, 2026. It was produced by combining satellite observations with temperatures predicted by a version of NASA’s GEOS (Goddard Earth Observing System) global model, which uses mathematical equations to represent physical processes in the atmosphere. The darkest red areas indicate where temperatures met or exceeded 40°C.
The heat broke records at a furious pace, often by wide margins. According to the UK Met Office, temperatures soared as high as 35.1°C (95.2°F) in London on May 26, smashing the previous May record by 2.3°C (4.1°F). In June, Bordeaux, France, broke its maximum-temperature record on three consecutive days, hitting 42.5°C on June 24, Météo-France reported. Slovakia, meanwhile, set new national records for both daytime and nighttime highs in August. Combined June and July temperatures in Western Europe were the highest on record, according to Europe’s Copernicus climate monitoring service.
In Europe, extreme temperatures collided with several vulnerabilities, including limited access to air conditioning, high nighttime temperatures, and a lack of green space in some cities. The circumstances triggered not just discomfort but heat exhaustion and heatstroke in some cases. Preliminary reports suggest that heat may have been associated with 10,000 excess deaths, including thousands of people in the UK, France, Germany, and Belgium.
“Air conditioning is an especially critical issue in Europe in the short term,” said Anamika Shreevastava, a researcher at New York University who studied urban heat islands as a postdoc at NASA’s Jet Propulsion Laboratory. One of her goals was to produce thermal maps based on NASA data from missions like ECOSTRESS that city planners could use to make cities more resilient to heat waves.
International Energy Agency data show that 23 percent of homes in Europe have air conditioning, compared to 90 percent of homes in the United States. That difference contributes to the much higher death rates that researchers have documented in European cities during heat waves than in comparable American cities. “Longer term, cities can also plant trees, expand parks, use reflective roof paint, and transition to building materials less likely to retain heat,” Shreevastava said.
An analysis from the World Health Organization indicates that heat stress is the world’s leading cause of weather-related deaths, noting it exacerbates underlying illnesses, including cardiovascular disease, diabetes, mental health conditions, and asthma. Researchers have calculated that roughly 489,000 heat-related deaths occur each year, with 45 percent of the deaths in Asia and 36 percent in Europe.
“For older adults with physical health problems, temperatures as low as 26.7°C (80°F) can pose significant danger,” said Deborah Carr, a Boston University sociologist who specializes in the study of aging. “Nighttime heat is especially harmful for older adults whose homes lack air conditioning.”
Carr is part of a research team that used demographic data, along with temperature and climate data archived by NASA, to identify which parts of the world are at the greatest risk of current and future heat exposure. Southern Europe was among the areas facing growing heat exposure and an aging population, the researchers found.
Other research, published in Lancet Planetary Health in August 2026, underscores the importance of demographics in assessing the risks posed by heat. This study, led by Stanford researcher Qinqin Kong, mapped where increasing heat is likely to lead to intolerable conditions in the coming decades for young, middle-aged, and older adults, concluding that safe thresholds will be breached often and widely, with risks falling disproportionately on older people.
“The human body can tolerate only a limited range of ambient heat,” said Kong, a recipient of a NASA Earth and Space Science and Technology award. “Understanding where, when, and to what extent these limits are exceeded is critical.”
With intolerable levels of heat expected to affect more people across larger regions and for longer periods than previously thought, Kong and his colleagues hope that their findings will inform targeted heat action plans, emergency preparedness, and health system planning.
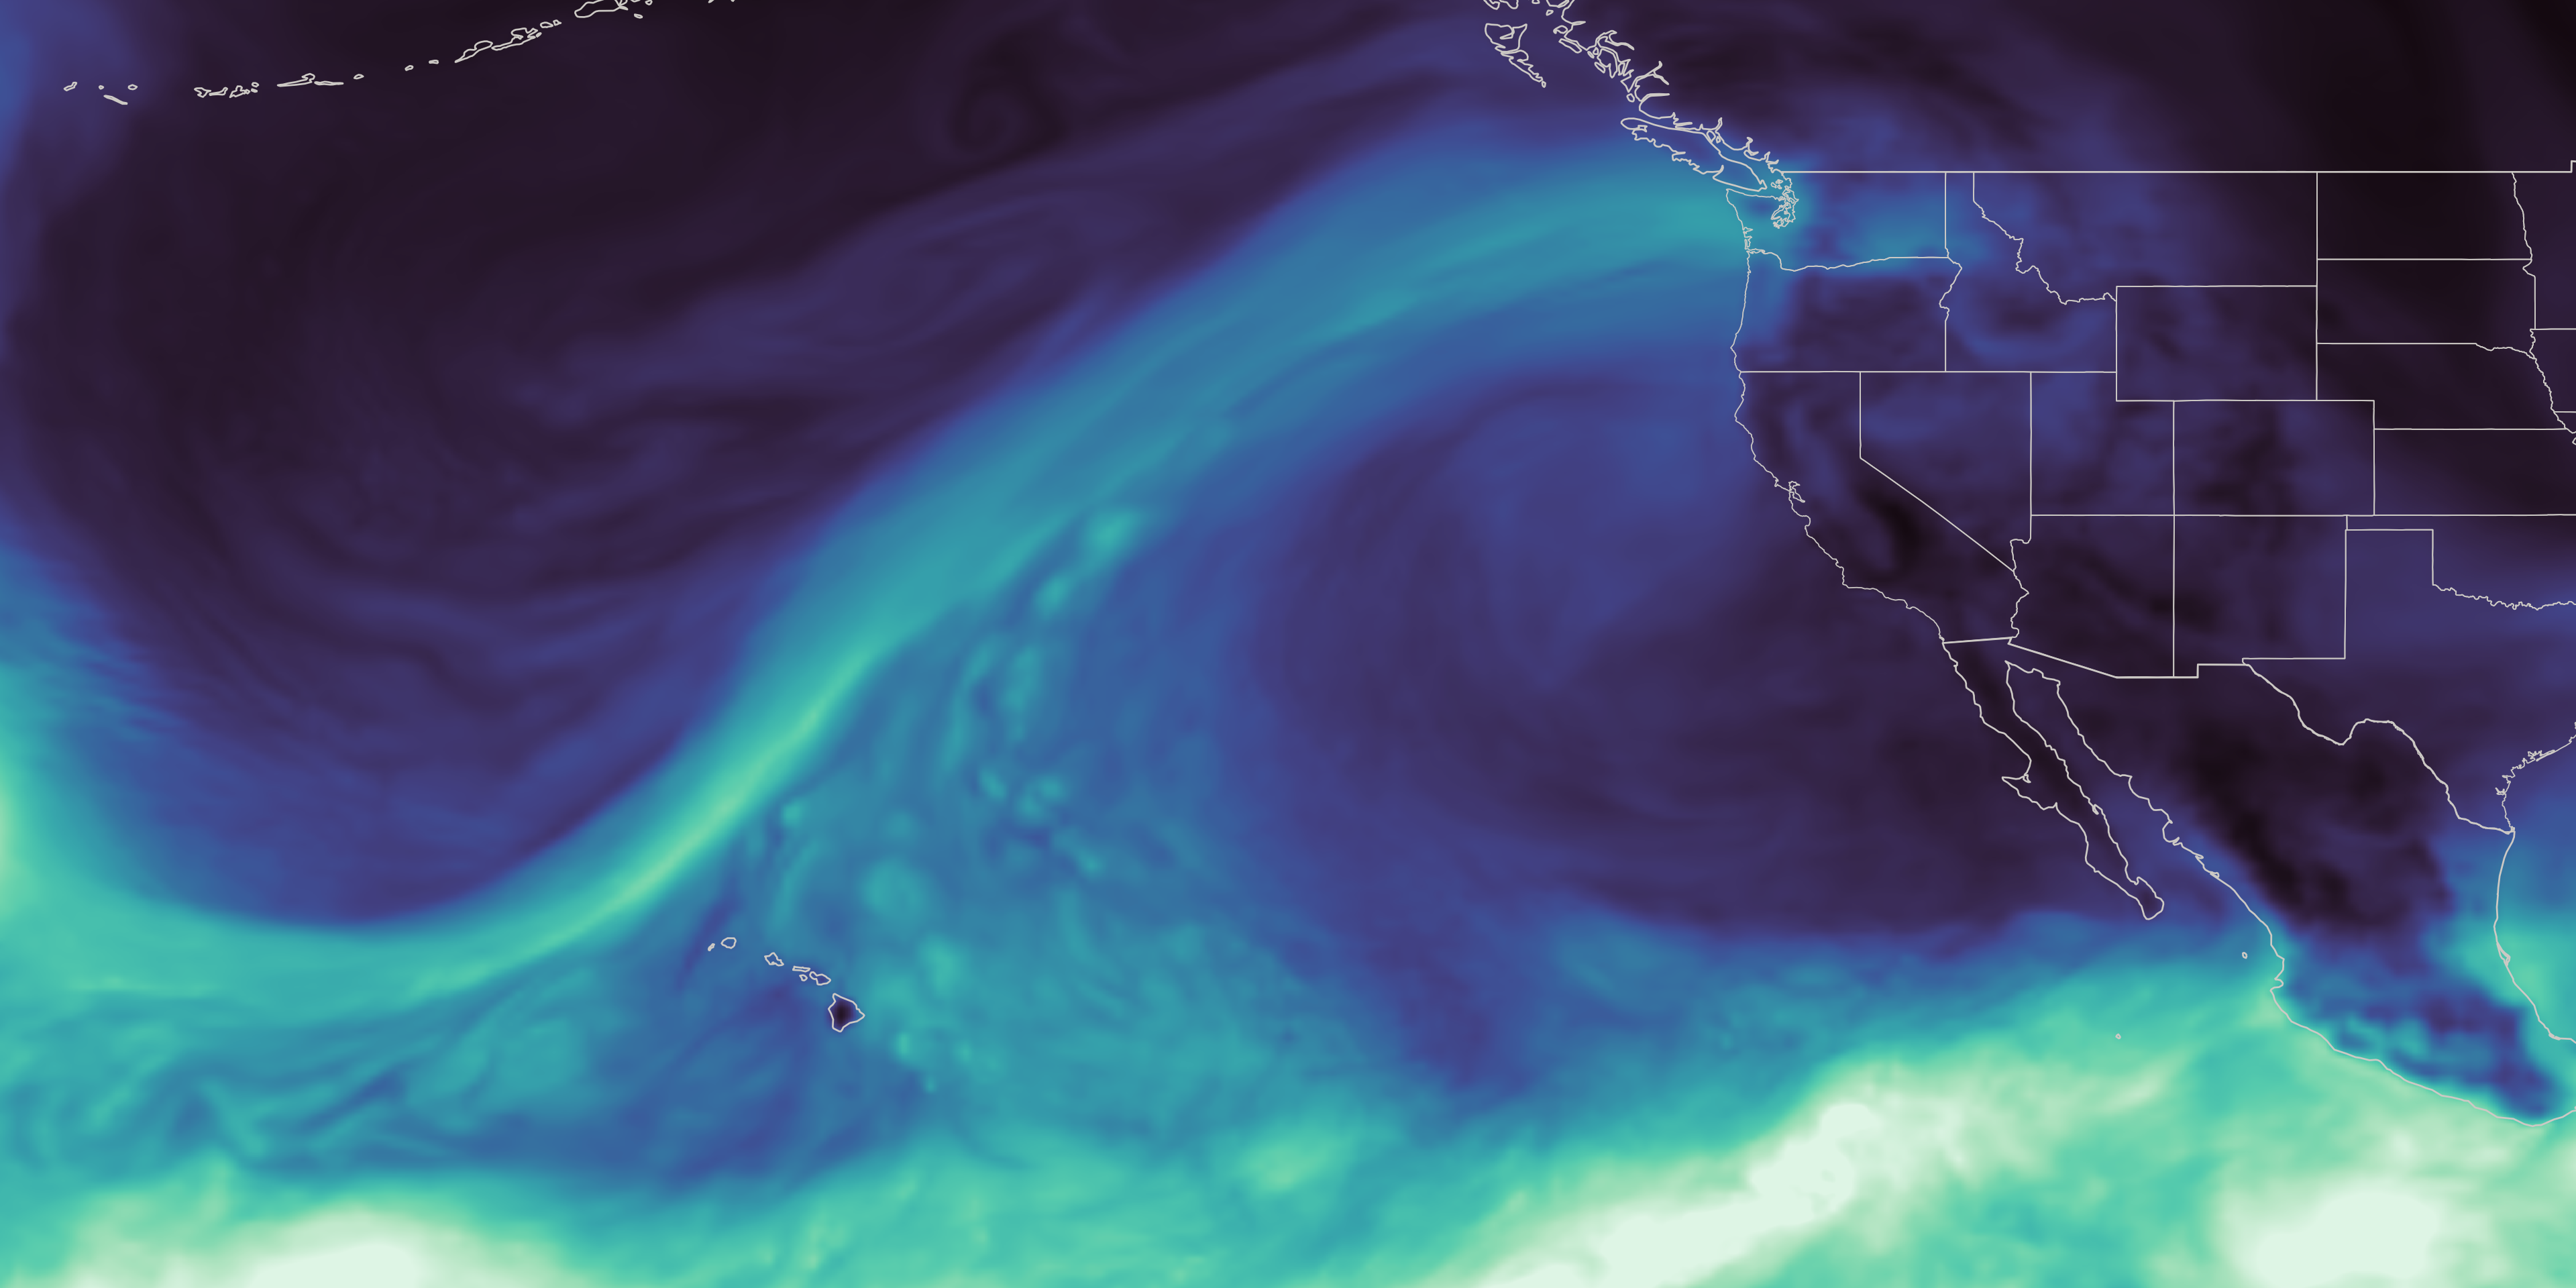
This map, derived from NASA’s GEOS (Goddard Earth Observing System), shows an atmospheric river reaching Washington state in December 2025, during a winter marked by extreme rainfall and too little mountain snow.
NASA’s Scientific Visualization Studio
As the effects of the 2026 snow drought in the western United States carry into summer, NASA Earth data is feeding machine-learning forecasts that inform decisions about water, power, and public safety in Washington state.
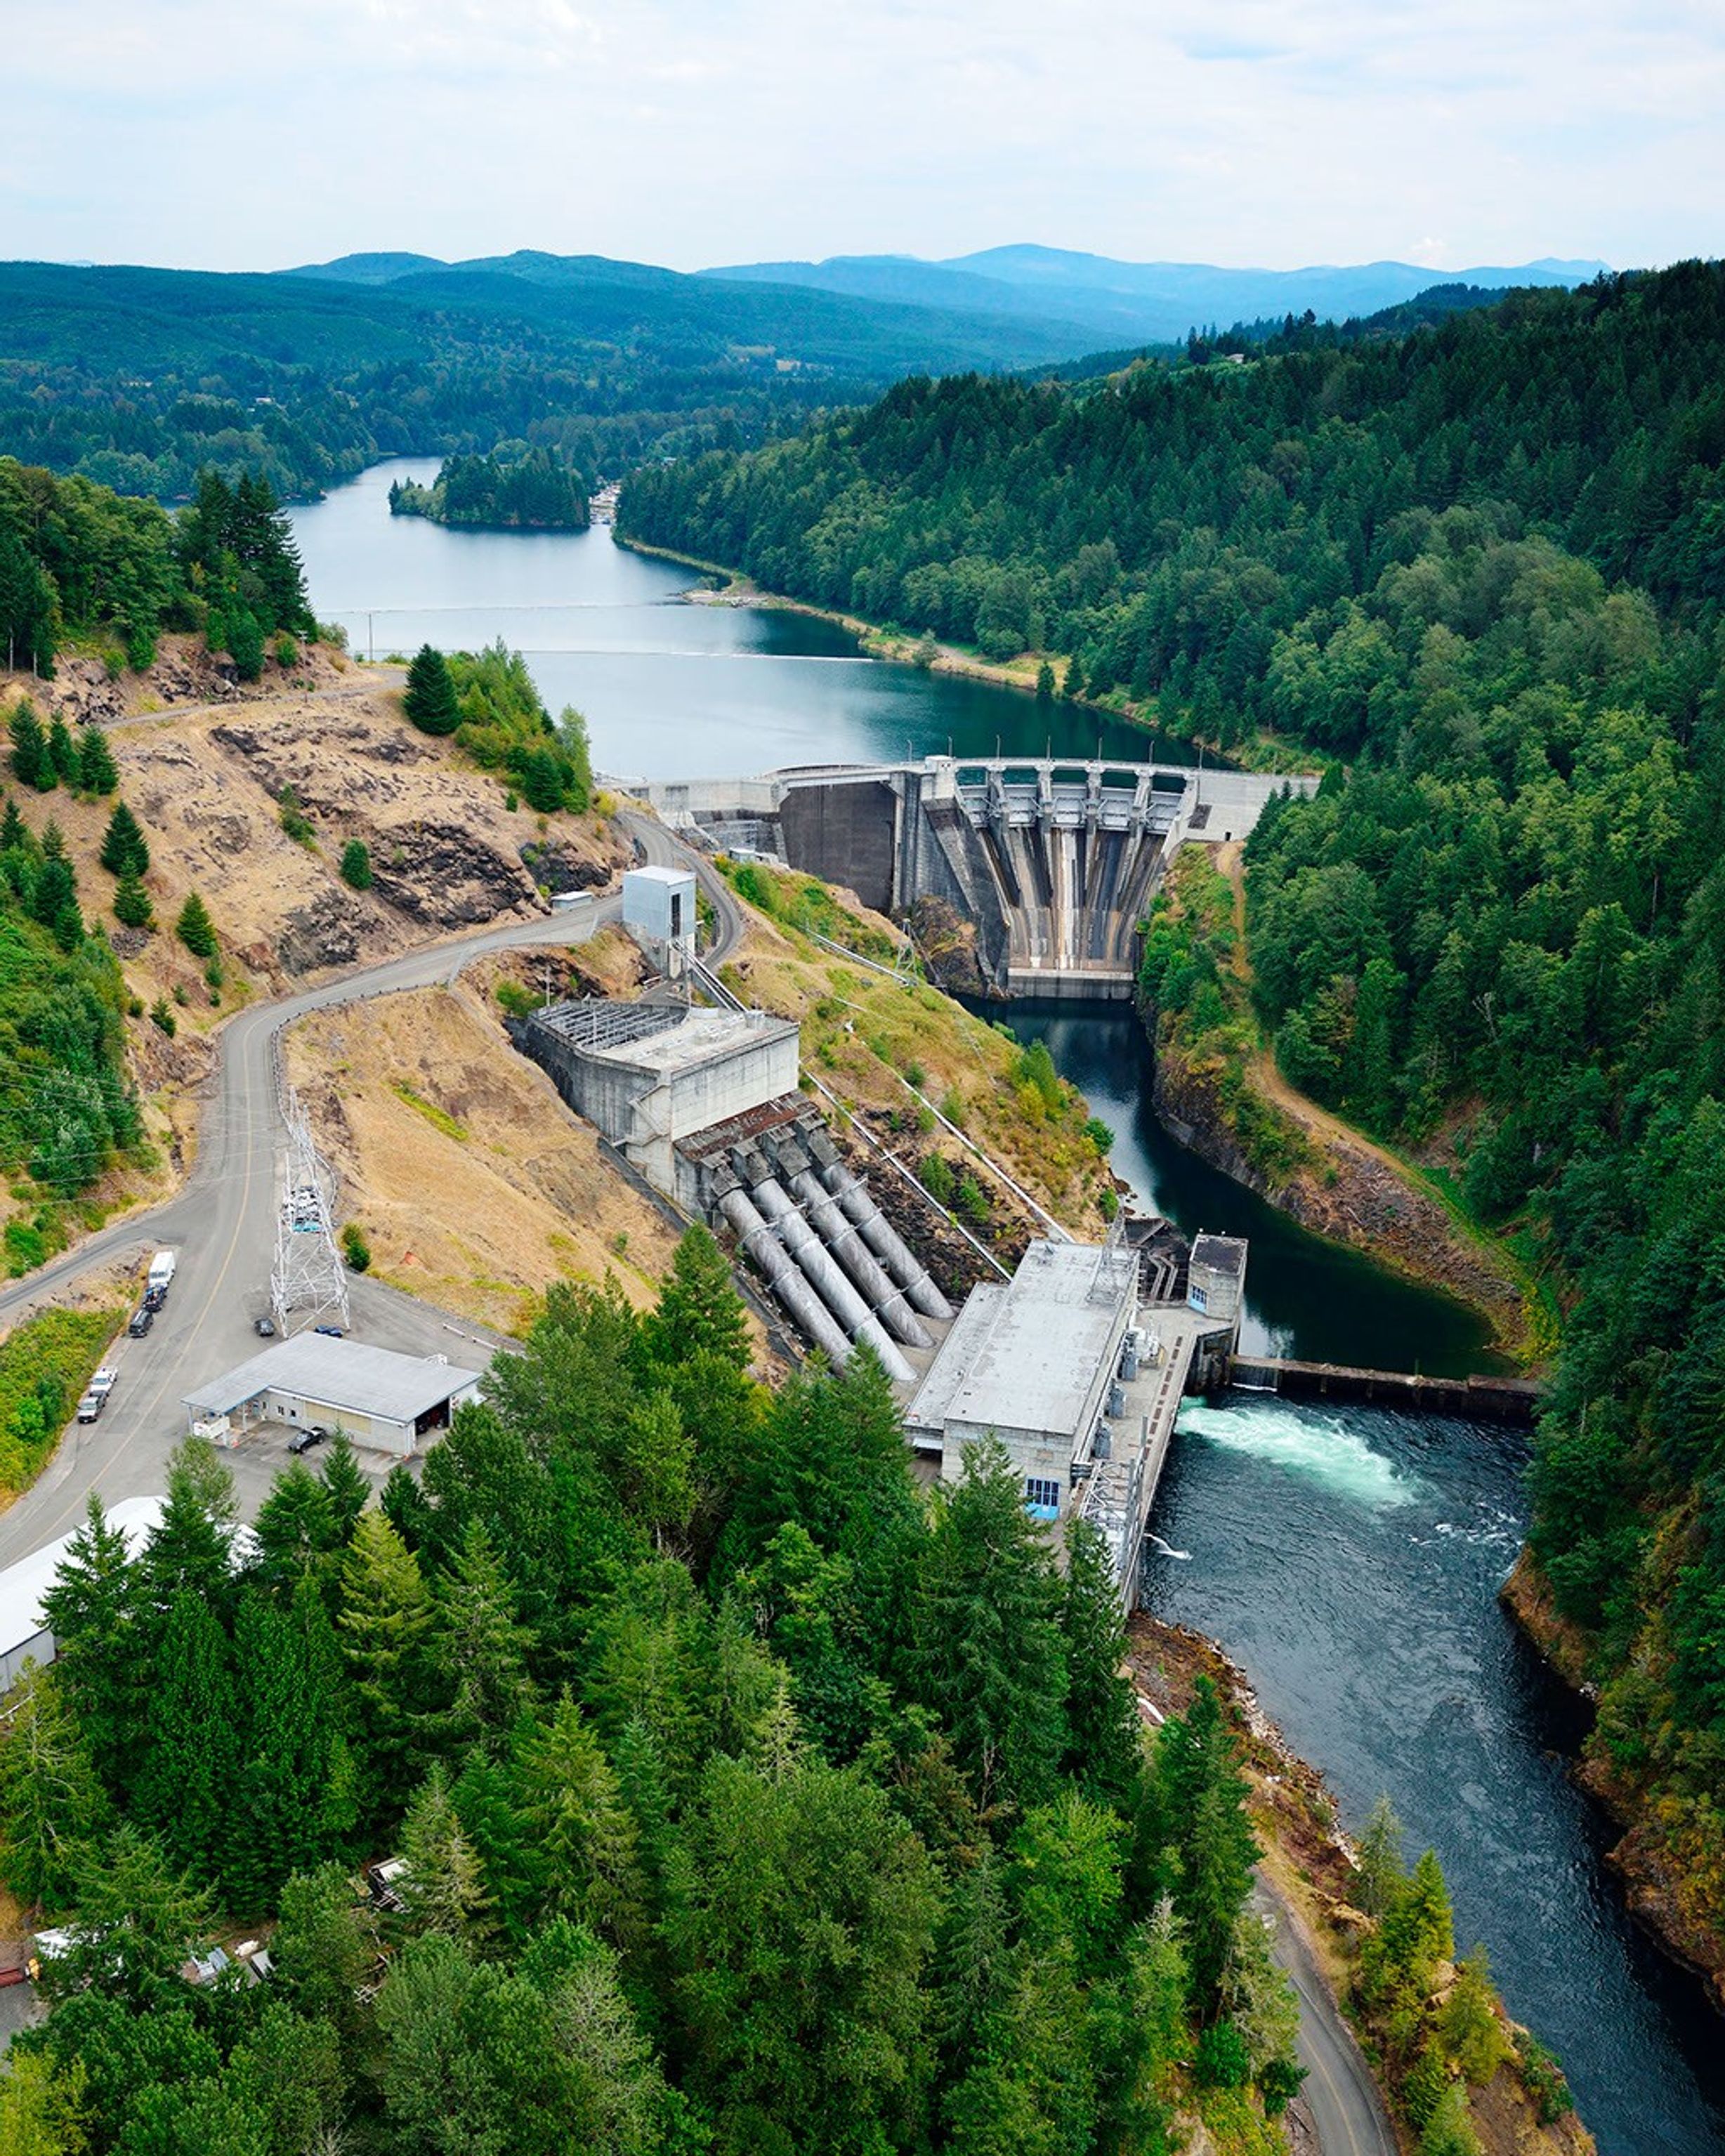
Tacoma Power, a Washington public utility, is using a U.S. technology company’s river-flow forecasts during a year of water extremes on the Cowlitz River. The utility’s largest hydroelectric project uses water stored behind Mayfield and Mossyrock dams to generate enough electricity to serve more than 151,000 homes each year.
Upstream Tech’s HydroForecast combines weather forecasts and river measurements with NASA-produced satellite data on snow cover and vegetation conditions to predict river flow from hours to days ahead. Updated every two hours, the forecasts are used by reservoir managers, hydropower producers, water utilities, and government agencies to prepare for storms, plan reservoir water releases, and navigate dry periods.
“Part of NASA’s mission is to make the view from space useful on the ground,” said Erin Urquhart, manager for NASA’s Water Resources program at the agency’s headquarters in Washington, D.C. “When an American company incorporates NASA’s freely available data into forecasts that help water managers prepare for floods, generate power, and steward water supplies, that’s NASA delivering practical value to the nation.”
Year of water extremes
During the winter of 2025-26, unusual warmth meant a larger share of precipitation fell as rain instead of snow across much of the West, while below-normal precipitation deepened deficits in some areas. January, February, and March each had the lowest Western snow cover for that month in the NASA MODIS (Moderate Resolution Imaging Spectroradiometer) satellite record since 2001.
On the Cowlitz, those conditions produced a season of extremes. In December 2025, a powerful atmospheric river brought a long, narrow band of Pacific moisture into the region, causing one of the largest one-day inflow surges ever recorded at Tacoma Power’s hydroelectric project. Across the season, that rain-heavy pattern sent water downstream quickly instead of building mountain snowpack that would melt and release water steadily into summer. Snowpack remained at just 20% to 50% of normal levels.
As winter became spring, the rain tapered off, and on April 8, Washington state placed every watershed, including the Cowlitz, under a drought emergency. From April through June, peak daily inflow into the project was among the lowest on record, leaving Tacoma Power with less incoming water to replenish its reservoirs ahead of summer demand, said Saul Villarreal, Tacoma Power’s senior hydro operations manager.
Tacoma Power’s Mayfield Dam and powerhouse sit on the Cowlitz River in southwest Washington, where forecasts using NASA data support reservoir operations and hydropower generation.
Tacoma Power, used with permission
Turning satellite data into river forecasts
NASA turns observations collected by the VIIRS (Visible Infrared Imaging Radiometer Suite) instrument on the Suomi-NPP (Suomi National Polar-orbiting Partnership) satellite into data products that provide information about snow cover and vegetation greenness across entire watersheds, including where ground monitors are sparse.
To train HydroForecast, Upstream Tech collects and archives years of those NASA products alongside weather forecast data and actual river-flow measurements. Using records from hundreds of watersheds, the models learn common patterns in how water moves through the landscape and apply them in new locations.
Tests across multiple basins found that including snow and vegetation observations increased forecast skill, said Dr. Laura Read, director of technical and federal partnerships for HydroForecast at Upstream Tech. “NASA’s data gives us the reliability, global coverage, and consistency we need,” said Read. “Our short-term models run every two hours, so those inputs have to show up when we need them. Though we have stopgaps in place, any interruption to our operational pipeline is a huge deal.”
Tacoma Power uses HydroForecast alongside stream gauges, snow stations, and operator judgment. During the December storm, the NASA-informed, short-term forecast helped the utility anticipate how much water would reach the project and prepare for dynamic river conditions, while meeting operating requirements and keeping public safety at the forefront, Villarreal said.
NASA’s GEOS (Goddard Earth Observing System) maps an atmospheric river, a ribbon of water vapor, before Washington’s January-April 2026 snow cover is compared with a historical median.
NASA’s Scientific Visualization Studio
As spring approached, the operational challenge reversed. Tacoma Power used HydroForecast’s seasonal model to track the growing risk of weak runoff and began keeping its reservoirs higher than usual to preserve water for summer. That left less space to contain another large storm, so operators continued checking the short-term forecast “to play defense,” and remained ready to adjust operations if another atmospheric river developed.
“The earlier we understand how conditions might change, the more effective planning we can do to manage our reservoir and balance the many demands of our system throughout the season,” said Villarreal.
Tacoma Power entered summer 2026 with reservoir levels near average despite the dry spring. The stored water supports reliable hydropower, required river flows to support fish and aquatic habitat, and public recreation. It also gives the utility more flexibility to meet electricity demand during heat waves or unexpected outages and, when possible, support the wider regional power system.
From forecasts to drought assessments
Tacoma Public Utilities’ Cowlitz Hydro Project is just one example of NASA science supporting water decisions across the West.
NASA also has partnered with the U.S. Department of Agriculture’s Natural Resources Conservation Service to bring satellite-based snow and groundwater information into machine-learning water-supply forecasts.
The National Oceanic and Atmospheric Administration’s Colorado Basin River Forecast Center uses MODIS and VIIRS data to adjust snowmelt rates in its model. The Bureau of Reclamation uses NASA and NASA-derived snow data, alongside other sources, for reservoir operations in California’s San Joaquin Basin.
NASA data and research have long informed the U.S. Drought Monitor, the weekly assessment used by farmers, water managers, and public agencies. NASA became a formal partner in 2026, expanding its role from providing information to helping produce the assessment. The agency took its first turn authoring the Drought Monitor during the week of Aug. 17.
Emily is a science writer and editor with NASA’s Earth Science Division, with more than 10 years of experience in science journalism and communication. A former deputy news editor at the magazine Science News, she holds a master’s in environmental science and management from UC Santa Barbara’s Bren School, where she specialized in water resources management and science communication.
Preparations for Next Moonwalk Simulations Underway (and Underwater)
A busy street in Addis Ababa, Ethiopia’s capital, which is the subject of NASA-led air quality research.
Ninaras (CC BY-SA 4.0)
A NASA-funded air pollution monitoring network has provided one of the most detailed long-term views yet of the role of black carbon, or soot produced by fires, diesel vehicles, and other combustion sources, in Ethiopia’s capital, Addis Ababa. The detailed measurements show how pollution changes by time of day and season, including increases associated with rush-hour traffic and holiday celebrations. The findings are relevant to cities around the world, including in the United States.
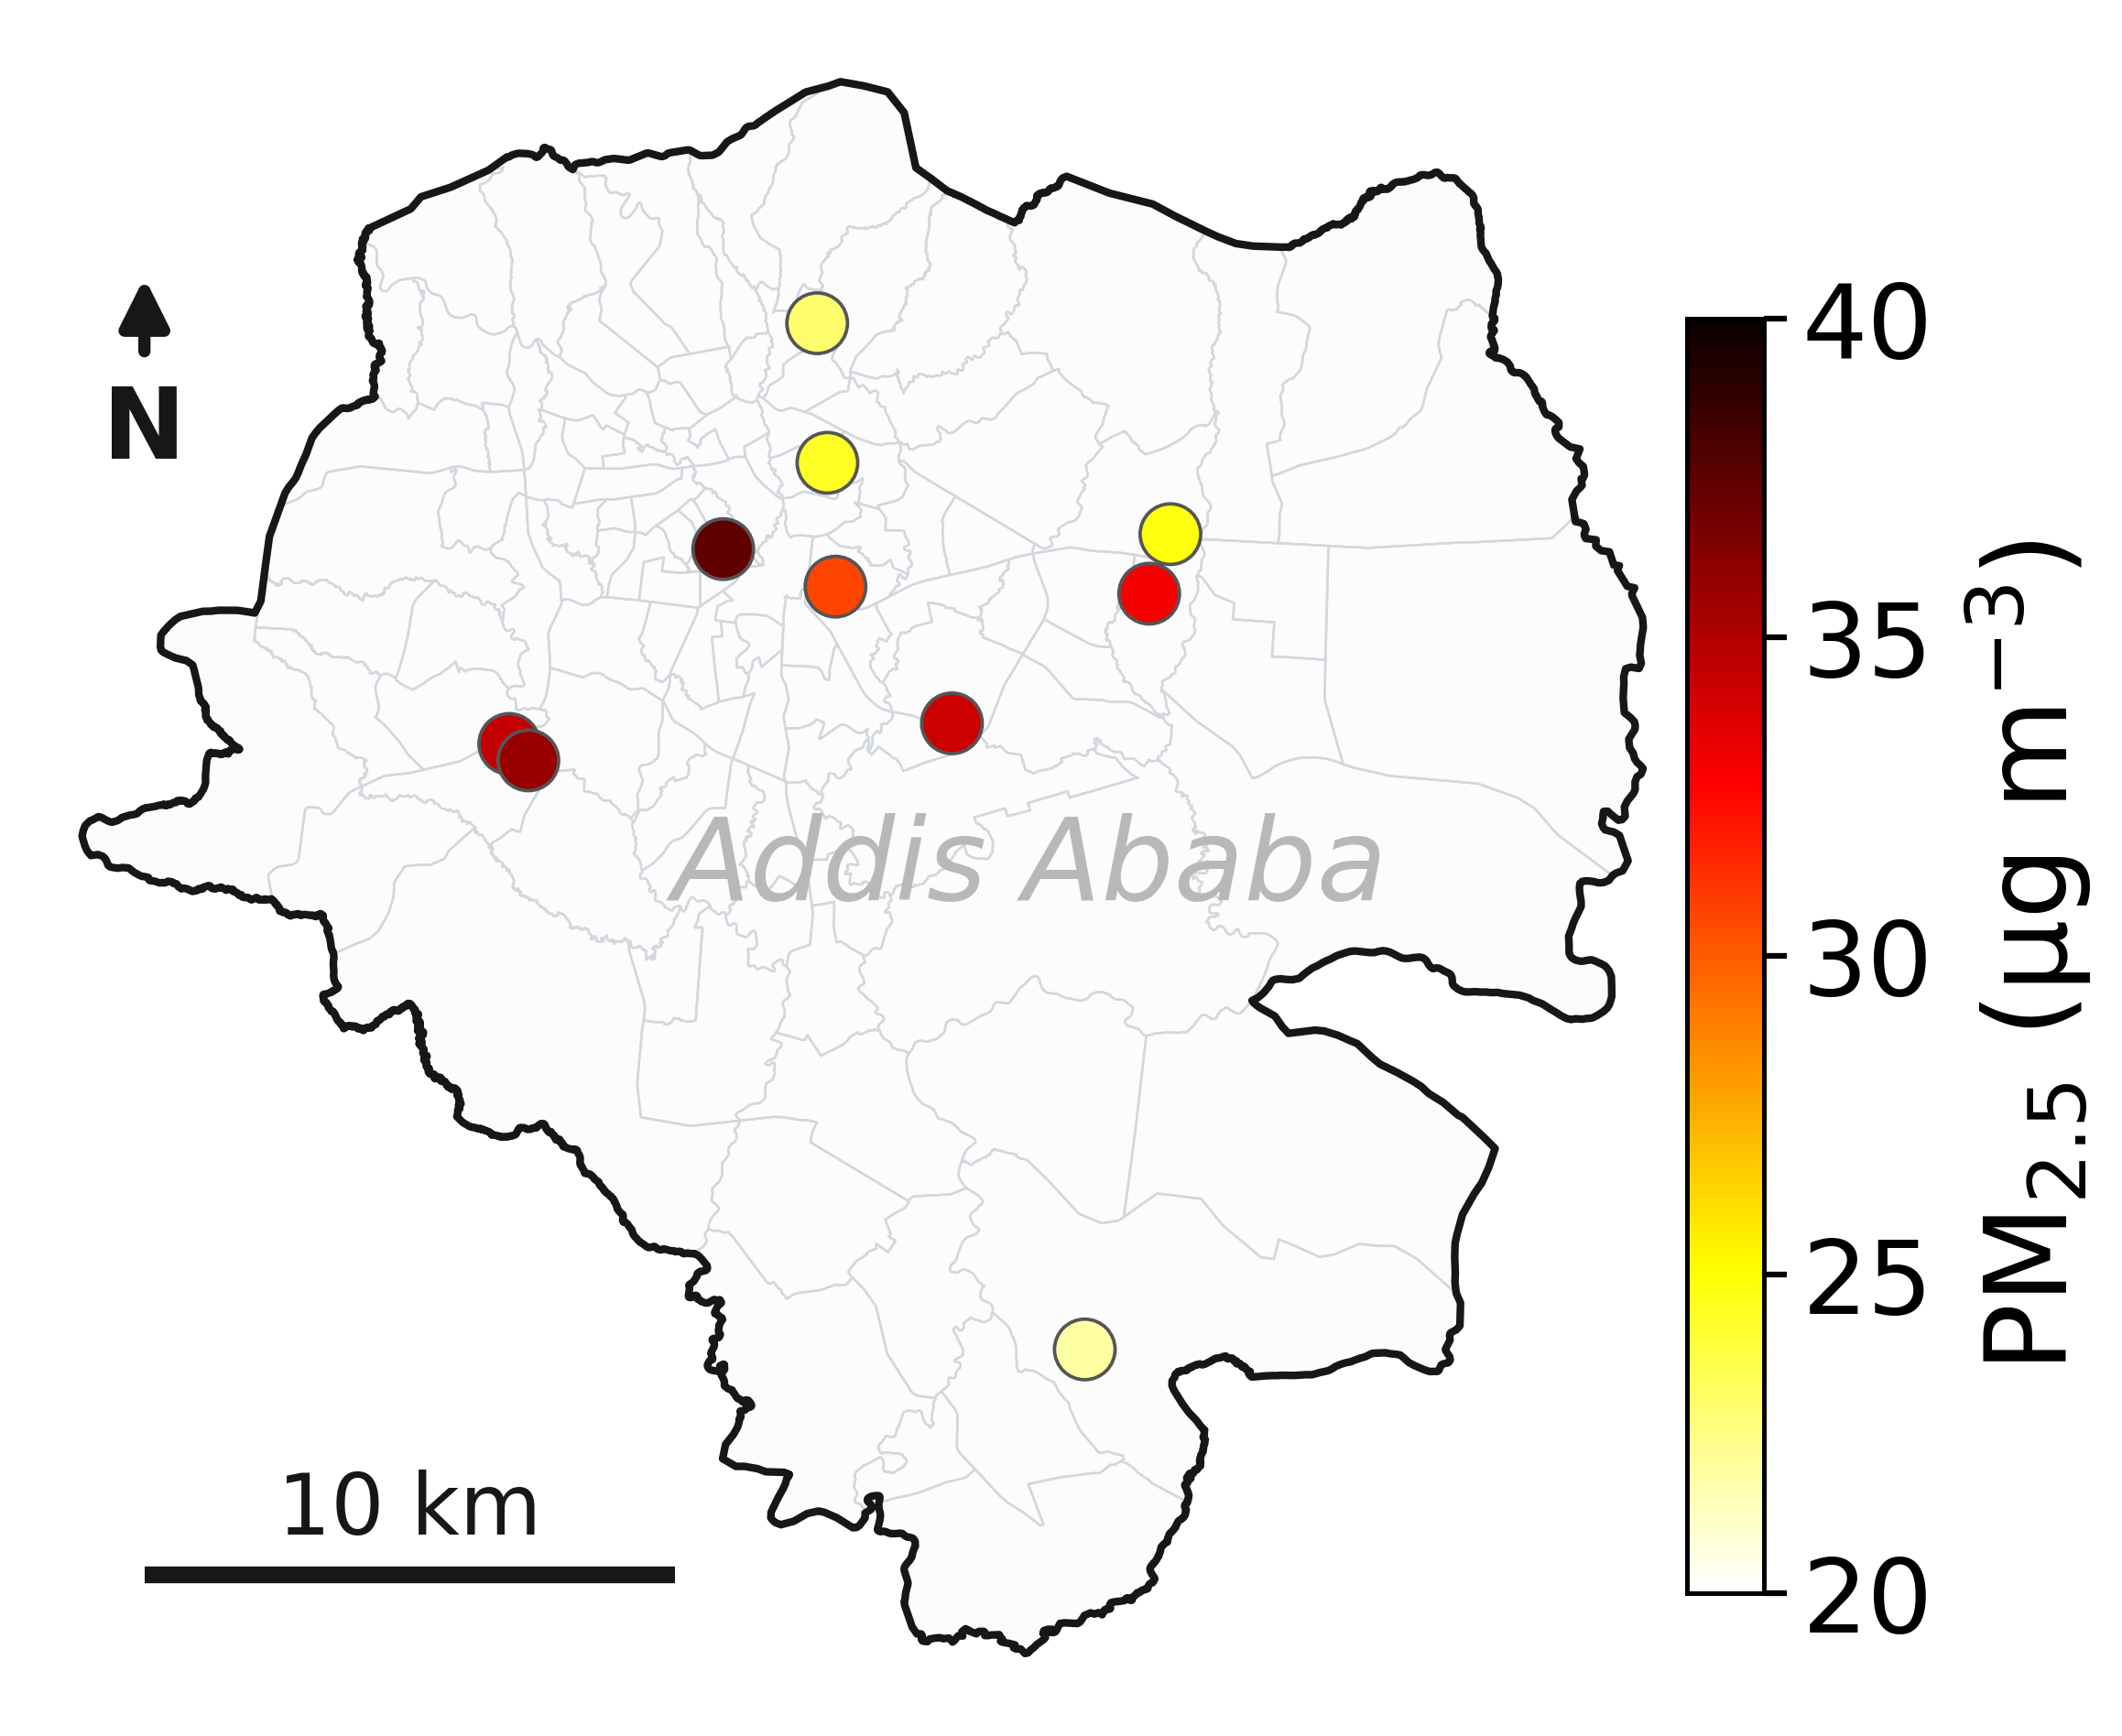
In a new paper published in ES&T: Air, scientists analyzed data collected throughout Addis Ababa between 2022 and 2025 from 10 air-quality monitoring sites deployed by NASA’s Multi-Angle Imager for Aerosols (MAIA) project.
The research comes as Ethiopia is taking steps aimed at improving air quality. In 2024, the country became the first in the world to ban the import of internal combustion engine vehicles, while cities have been adding bike lanes and electric vehicle infrastructure. The MAIA project’s measurements provide researchers with a baseline for understanding how air quality changes over time as Addis Ababa continues to grow and evolve.
The study focuses on particulate matter that is 2.5 micrometers or less in diameter, also known as PM2.5. The 2025 State of Global Air Report, cited in the paper, estimates that exposure to PM2.5 is associated with approximately 4.9 million deaths globally each year. Among the many kinds of PM2.5, black carbon has been has been studied for its potential effects on human health.
The paper found that Addis Ababa’s three-year average PM2.5 concentration was 30 micrograms per cubic meter, which is more than three times the level of the U.S. Environmental Protection Agency’s health-based annual PM2.5 standard. The new paper cites data from MAIA’s ground sensors indicating that average black carbon levels in Addis Ababa were approximately four to nine times higher than those measured in the three U.S. metropolitan areas the mission is monitoring.
This roof-mounted air sensor in Addis Ababa, the capital of Ethiopia, is one of 10 used by NASA’s MAIA mission to study the city’s air quality. MAIA’s air sensors provide a detailed look at PM2.5, one of the world’s deadliest forms of air pollution.
NASA/JPL-Caltech
“To our knowledge, this is the first long-term, multisite study of continuous PM2.5 and black carbon measurements in Ethiopia,” said Sina Hasheminassab, a coauthor of the paper and MAIA’s deputy principal investigator at NASA’s Jet Propulsion Laboratory in Southern California. “Many rapidly growing cities have limited long-term monitoring, so these measurements provide an important baseline for understanding how pollution changes across space and time.”
The composition and sources of PM2.5 can differ substantially between cities, depending on their local geography, traffic, industries, and more. Desert cities, for example, may have more dust, while those near coal-fired power plants may have higher concentrations of sulfate. Long-term surface measurements remain limited in many parts of the world.
NASA is supporting MAIA’s air pollution research in a dozen metropolitan areas around the globe, including three in the U.S.: Los Angeles, Atlanta, and Boston. The mission consists of a ground-based network of sensors already in operation as well as a space observatory, which uses a JPL-built camera that will be launched by the Italian Space Agency (ASI) on an ASI satellite no earlier than late 2027.
The camera is designed to identify different types of PM2.5 aerosols based on how they reflect light, making it possible to map particle concentrations over each city that the mission studies. Mounted on a gimbal, the camera captures data from multiple angles using JPL-pioneered technologies that make particles stand out more prominently against the surface background to provide valuable information about their shape and size.
The MAIA mission is the first NASA project to include public health researchers among a space mission’s team. These researchers will use MAIA’s PM2.5 concentration maps alongside health data to study potential relationships between different particle types and health outcomes. By developing a better understanding of particulate matter pollution, researchers can potentially advance how air quality is studied and managed.
“This paper shows how valuable the air sensor data is on its own, but combining the sensor network and satellite observations will be a game-changer,” said, Kyan Shlipak, the paper’s lead author, who worked on the research while interning at JPL.
Tracking black carbon
The greater Addis Ababa urban area is home to nearly 6 million people, and according to United Nations projections, that figure is expected to surpass 10 million by 2050.
This map of Addis Ababa, the capital of Ethiopia, shows the locations of 10 air sensors that NASA’s MAIA mission is using to provide one of the most detailed looks ever at the city’s air pollution.
NASA/JPL-Caltech
“It’s a cosmopolitan city with many international communities,” said Araya Asfaw of Addis Ababa University, a coauthor of the paper and the MAIA project’s lead Ethiopian collaborator. “Think of it as Africa’s version of Brussels, where the European Union is based.”
“Even at night, when traffic dies down, you see high emissions from the burning of charcoal and other fuels,” Asfaw said.
The MAIA sensor network detected increases in black carbon during two major holidays in Addis Ababa that involve bonfires and was able to distinguish between particles originating from the fires and those from fossil fuel combustion. The findings demonstrate how detailed measurements can help researchers identify different sources of particulate matter and better understand how air quality varies across a city and over time.
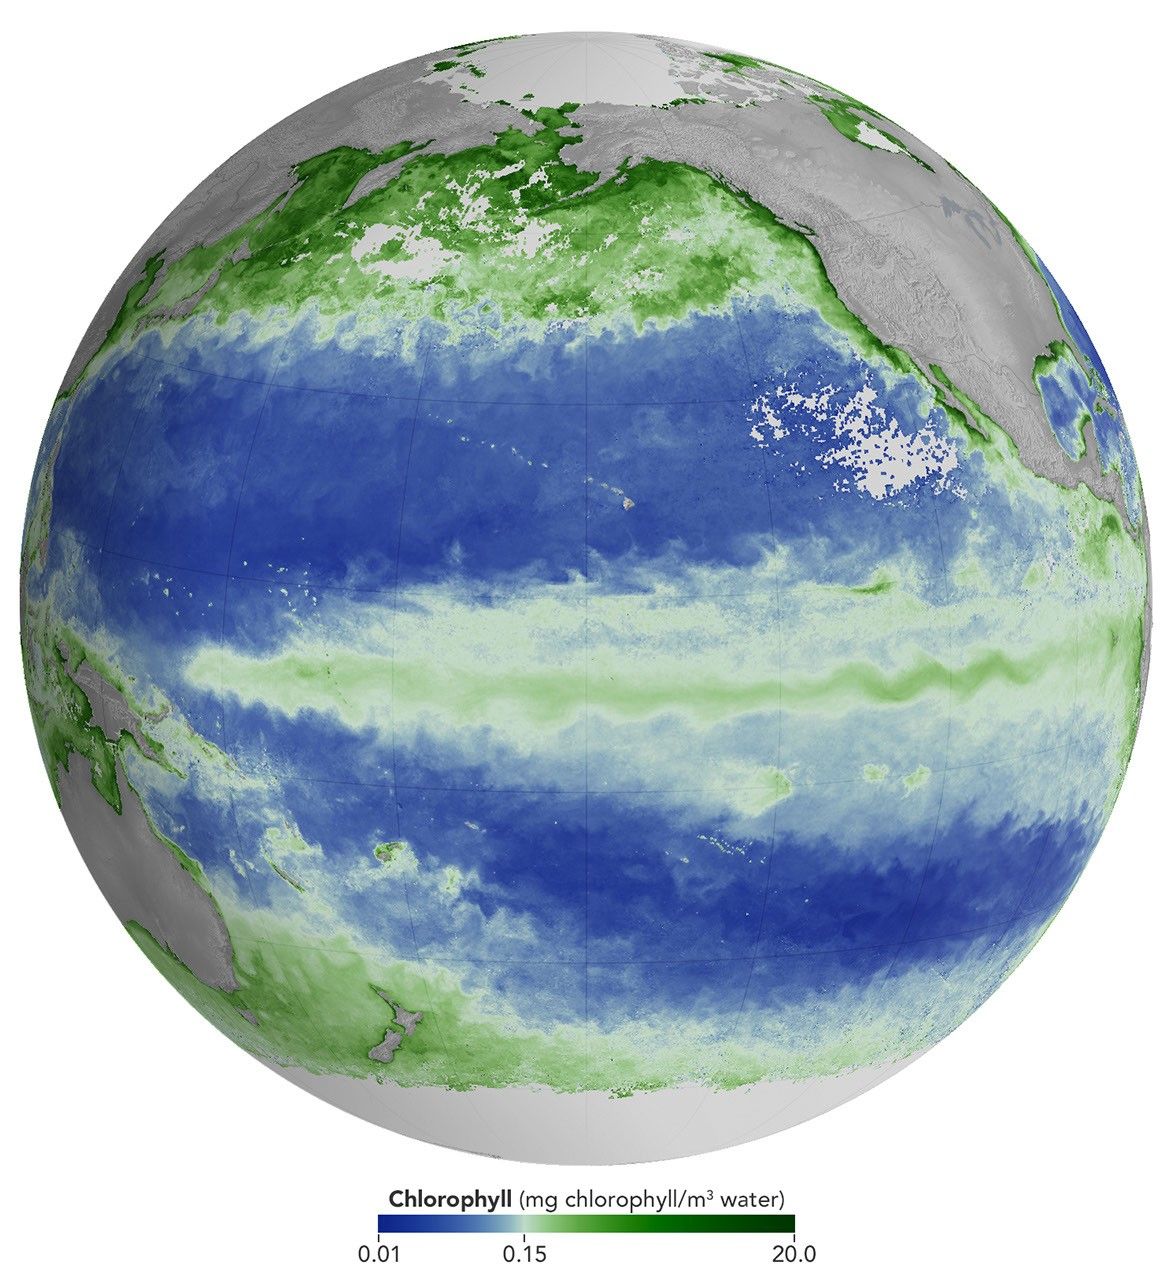
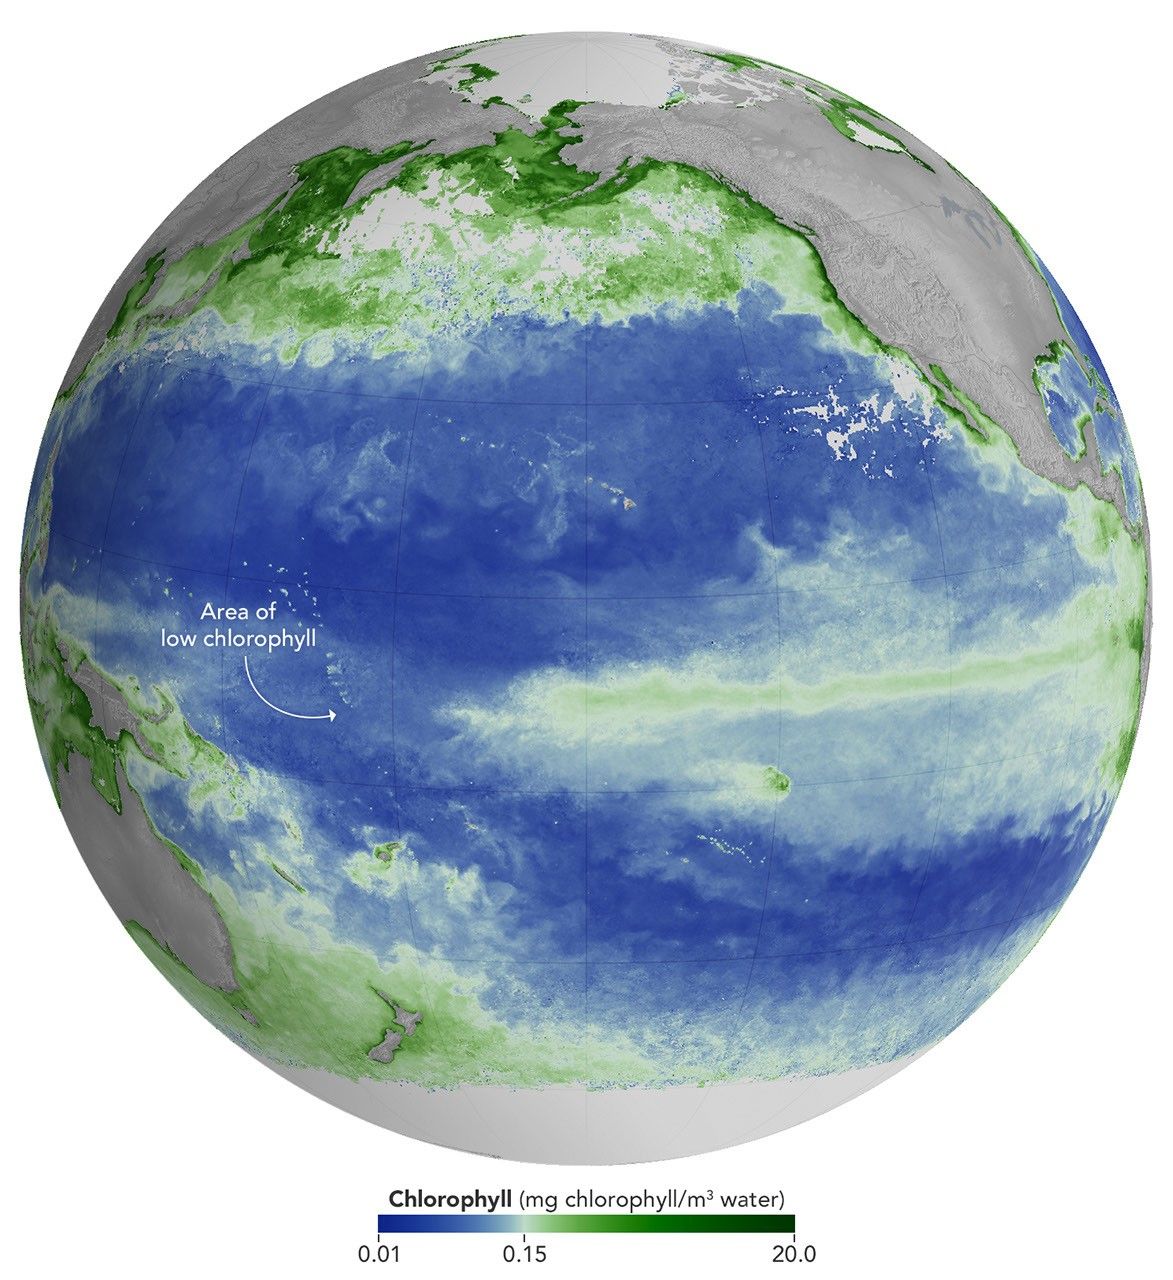
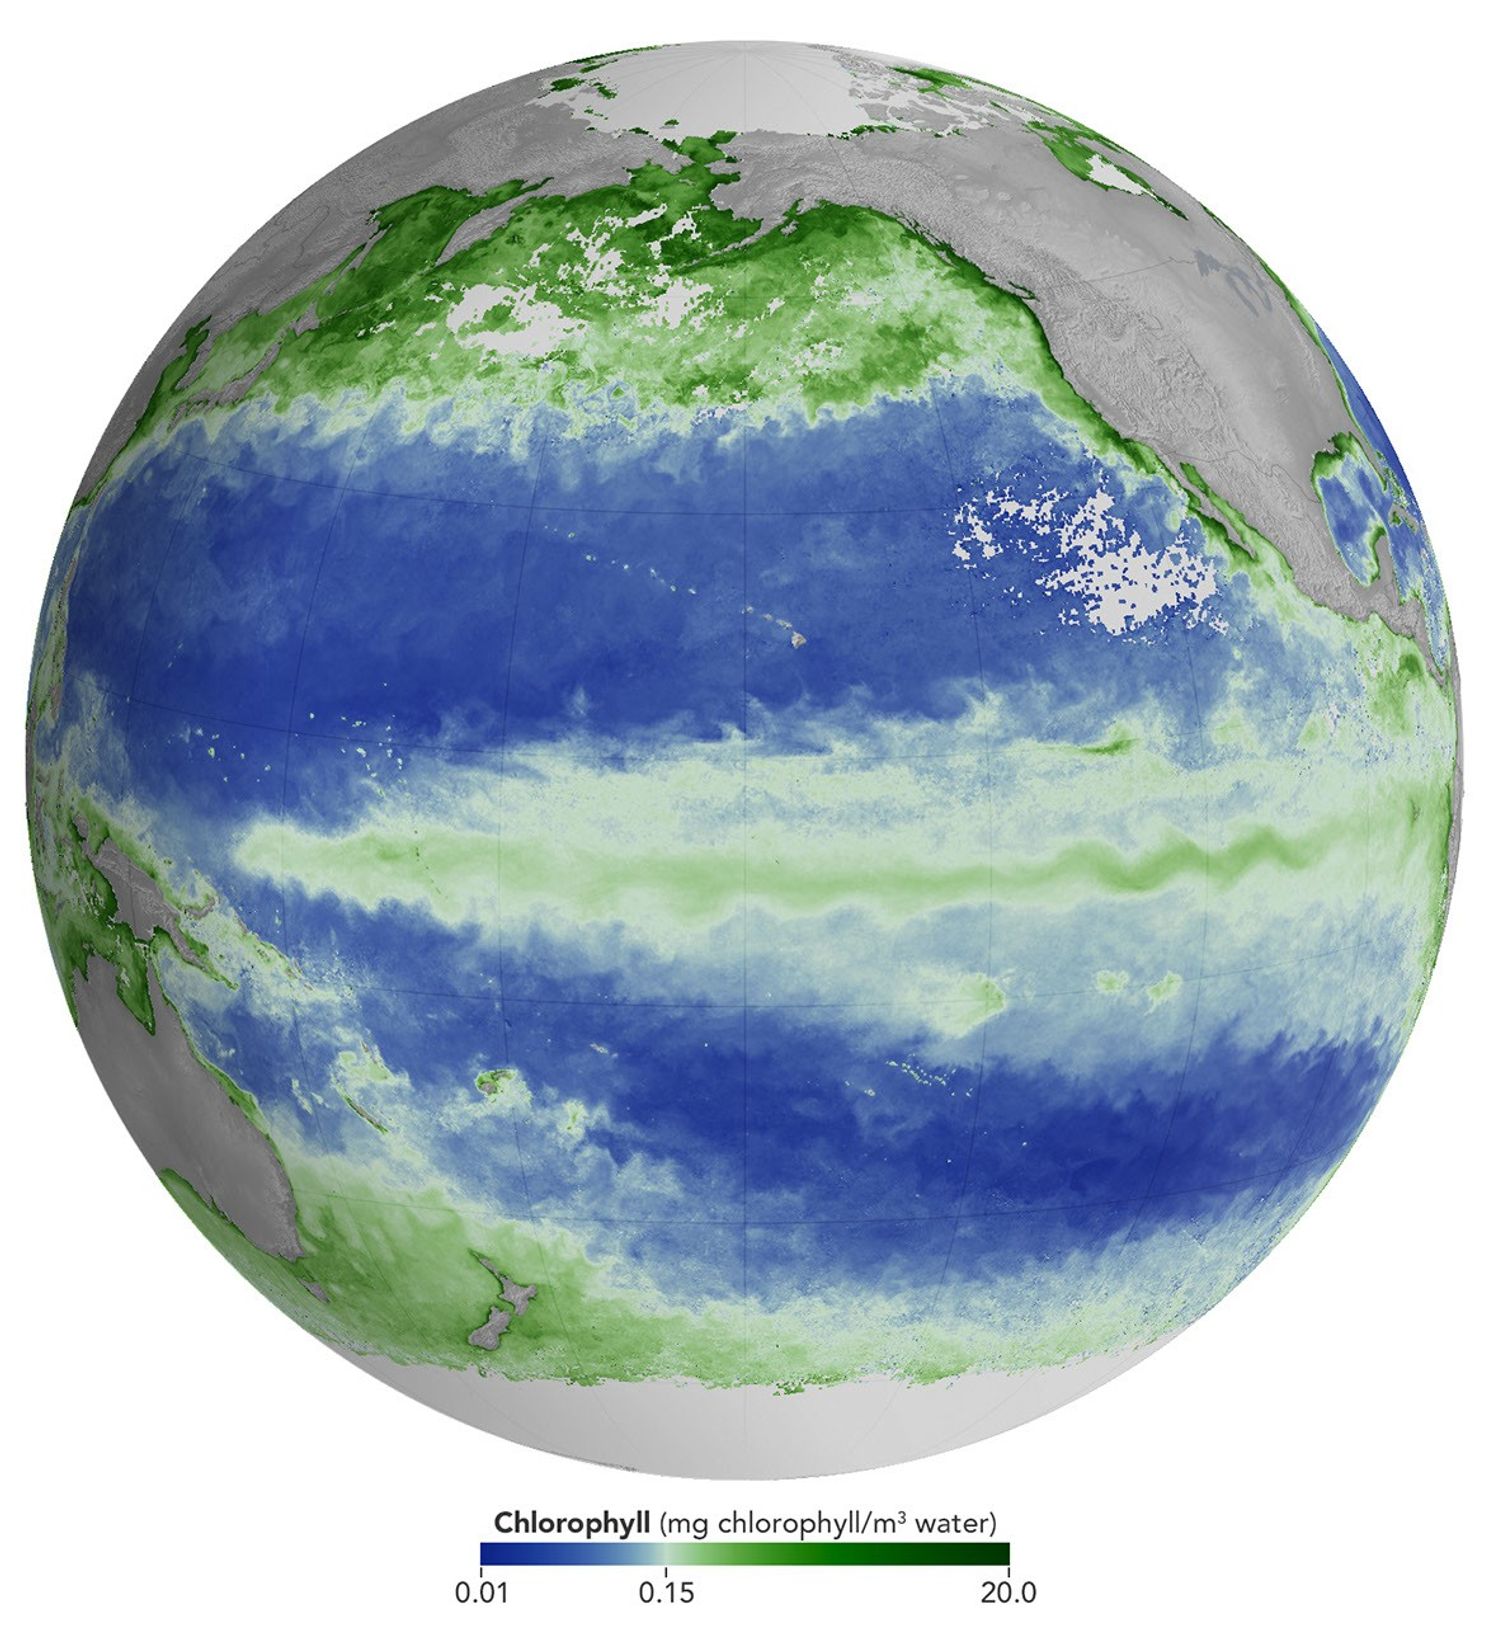
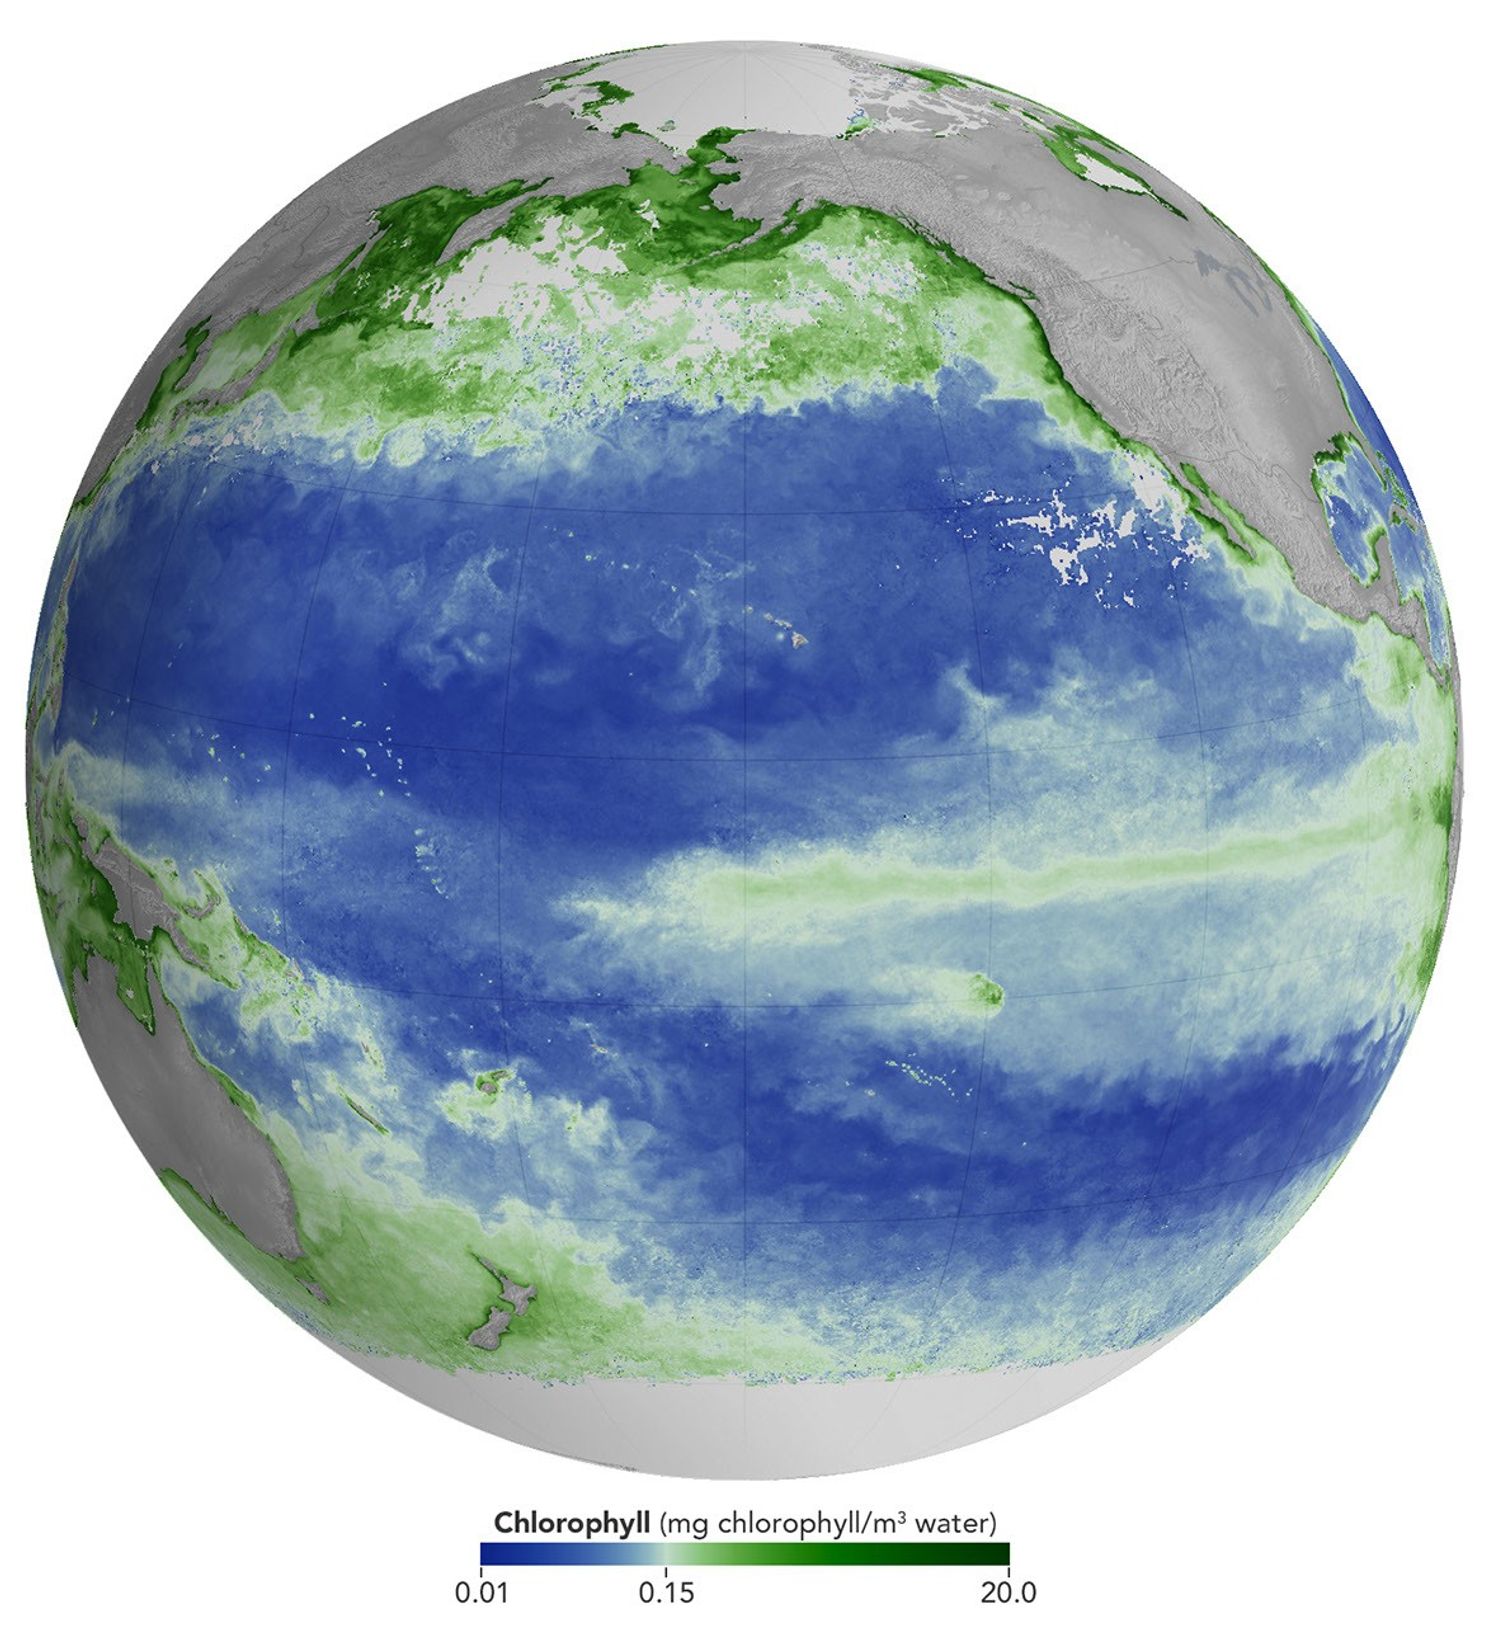
Concentrations of chlorophyll in the equatorial Pacific deviate from normal during El Niño events. These maps depict monthly average chlorophyll concentrations for June 2025 (left), under neutral conditions, and June 2026 (right), as El Niño was strengthening. Data come from the OCI (Ocean Color Instrument) on NASA’s PACE (Plankton, Aerosol, Cloud, ocean Ecosystem) satellite and are based on measurements of green and blue light from the ocean reflected back to the sensor. NASA Earth Observatory images by Michala Garrison.
As of June 2026, El Niño has officially arrived. This naturally recurring phenomenon is characterized by warmer-than-normal water temperatures in parts of the equatorial Pacific along with changes to atmospheric and oceanic circulation patterns. Its regional effects range from desert floods to delayed monsoons to shifts in where tropical cyclones are more likely to form.
NOAA’s Climate Prediction Center expects the current El Niño to continue to strengthen through the end of 2026, with a 97 percent chance of lasting through early Northern Hemisphere spring 2027. Even during El Niño’s early stages, satellites have observed characteristic changes along the equatorial Pacific, such as warmer-than-normal sea surface temperatures and higher-than-normal sea surface height.
Among the first ecological downstream effects are changes to the marine food web. The maps above show chlorophyll-a concentrations—the pigment present in most phytoplankton—as observed by the OCI (Ocean Color Instrument) on NASA’s PACE (Plankton, Aerosol, Cloud, ocean Ecosystem) satellite. In June 2025 (left), conditions were neutral, while in June 2026 (right), El Niño was strengthening.
The most noticeable difference appears in the central Pacific, around the equator due north of New Zealand: chlorophyll concentrations, an indication of phytoplankton abundance, are substantially lower in 2026. This change is expected, said Matthew Kehrli and Graham Trolley, oceanographers in the Ocean Ecology Laboratory at NASA’s Goddard Space Flight Center. That’s because during an El Niño, easterly equatorial trade winds weaken, the warm surface layer of the ocean extends deeper, and the upwelling of cool, nutrient-rich water that typically fuels phytoplankton growth is suppressed.
As the El Niño progresses, the scientists anticipate the differences in the central Pacific will become more pronounced. “This may manifest as a greater difference in values across the current region, as a broadening region of reduced surface chlorophyll-a concentration, or both, depending on the behavior of the equatorial trade winds,” they said.
Reductions in phytoplankton have ripple effects through the marine food web, including in coastal regions. Less food is available for zooplankton, as well as for fish, seabirds, and marine mammals. Peru’s anchovy fisheries have seen profound declines in catch during past El Niños, driven similarly by warmer surface waters, reduced upwelling, and lower phytoplankton abundance. In 2026, Peru’s Ministry of Production repeatedly suspended the fishery to safeguard the country’s main fishing resource. Pelicans have been seen venturing into Peruvian ports and urban areas in search of food.
Although the disruptions to marine life can be severe, a post-El Niño “chlorophyll rebound,” with higher-than-normal concentrations in the equatorial Pacific, can occur. Research suggests that higher iron concentrations delivered in ocean currents, as well as dust arriving from drier land in parts of Central and South America, help fuel the resurgence—a rebound that doesn’t require a follow-on La Niña. La Niña, which often follows El Niño events, can also produce elevated chlorophyll concentrations. A strong La Niña in 1998–1999 set off a large phytoplankton bloom in the eastern Pacific and a dramatic increase in fish populations.
Scientists have new tools available for studying this sort of variability. The PACE mission launched in February 2024, making this the first complete El Niño event for which the satellite will gather global, near-daily hyperspectral measurements. “The scientific community will be able to observe the 2026 El Niño with data across more wavelengths of light than ever before,” Kehrli and Trolley said.
To better understand effects on life in the ocean, researchers hope to use PACE data to gauge the responses of specific phytoplankton communities to El Niño. And the possibilities extend beyond the marine realm, the scientists note. PACE’s sensors can measure plant pigment composition on land and clouds and aerosols in the atmosphere, all of which are influenced by El Niño.
Preparations for Next Moonwalk Simulations Underway (and Underwater)
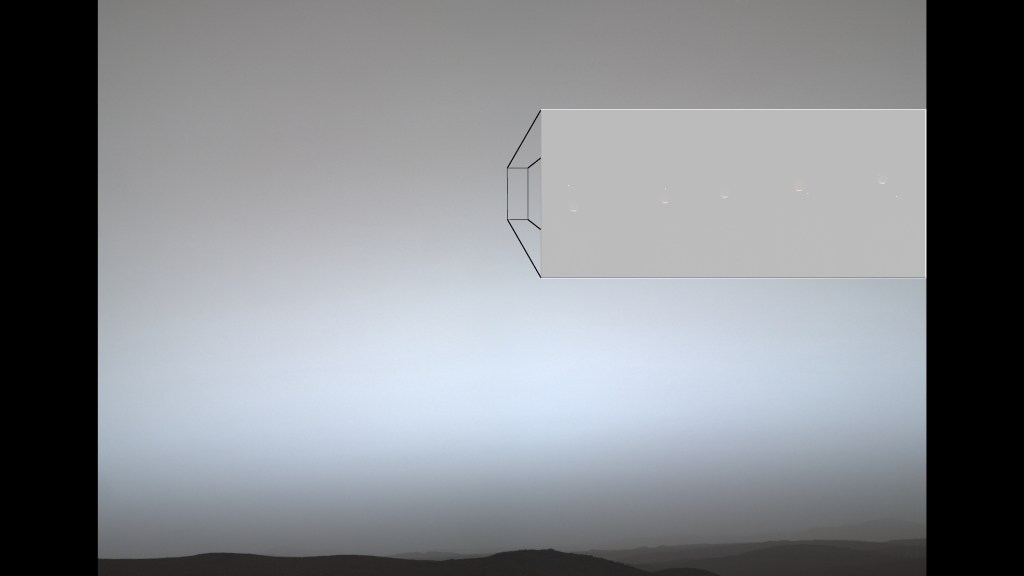
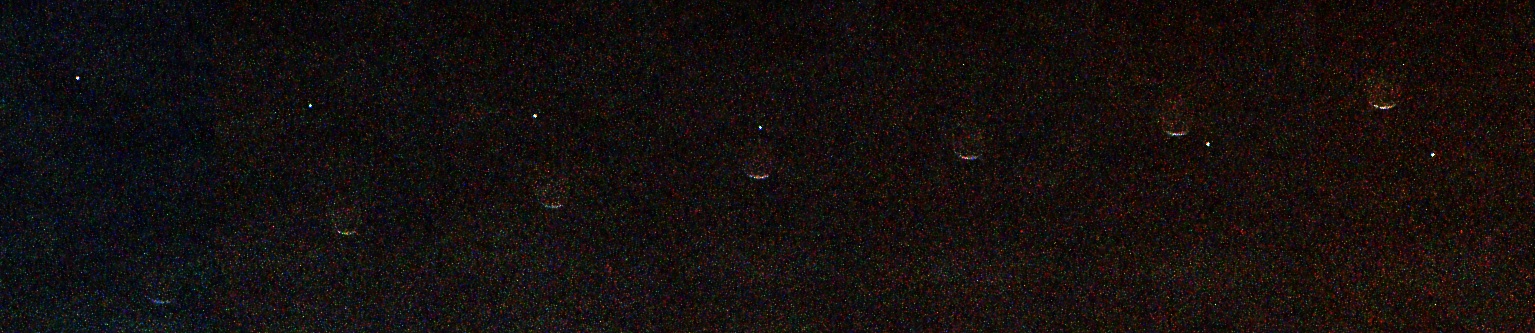
This annotated composite of nine images taken by Perseverance’s Mastcam-Z on July 2, 2026, shows Earth — the small bright dot moving from upper left to lower right — passing behind the Martian moon Phobos. The images in the inset were captured from the same rectangular patch of sky outlined in black.
NASA/JPL-Caltech/ASU/MSSS/SSI
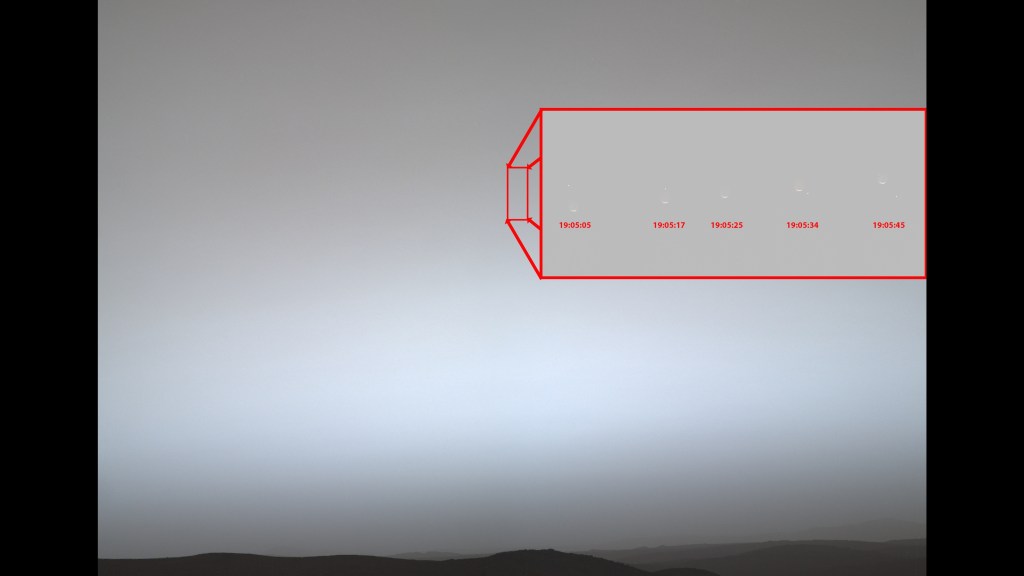
The timecode annotations in the inset show the local solar time on Mars during which five individual images of the occultation were captured by NASA’s Perseverance on July 2, 2026. Earth disappears — and then reappears — behind the Martian moon Phobos.
NASA/JPL-Caltech/ASU/MSSS/SSI
Earth and the Martian moon Phobos dance together in a series of images recently acquired by NASA’s Perseverance Mars rover. Earth appears as a point of light in the Martian sky, disappearing behind the crescent of Phobos, the larger of Mars’ two moons.
This is the first time humanity has captured from the surface of another planet an observation of Earth disappearing behind an object.
The image sequence was taken by the rover’s Mastcam-Z instrument at about 7 p.m. local solar time (the Martian evening time where the rover is located) on July 2, the 1,907th Martian day, or sol, of the mission. In the composite image, Earth travels from the upper left of the frame toward the lower right while Phobos, moving from lower left to upper right, sweeps across its path. In the third frame of the sequence, the two meet, and our planet winks out behind the little moon’s shadowed edge.
“The composite image makes for a unique Earth self-portrait, taken from the surface of another planet, with a Phobos photobomb,” said Justin Maki, the Mastcam-Z deputy principal investigator and imaging scientist for Perseverance at NASA’s Jet Propulsion Laboratory in Southern California.
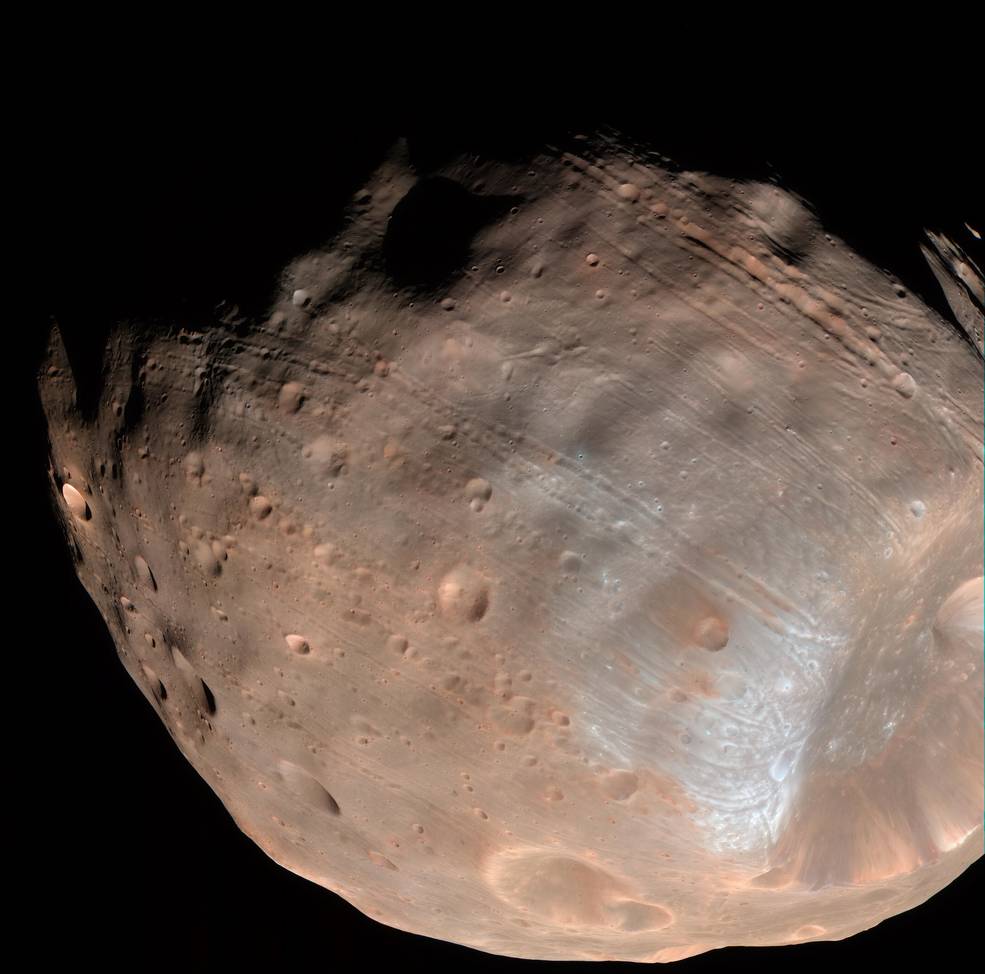
From where Perseverance sits on the rim of Mars’ Jezero Crater, the two objects could hardly look more different. Phobos, a lumpy, potato-shaped moon about 17 miles (27 kilometers) across at its widest, orbits so close to Mars (4,850 miles, or 7,800 kilometers, away) that when the images were taken, Phobos appears roughly one-third the width of Earth’s Moon as seen from our planet. Some 195 million miles (314 million kilometers) away at the time, Earth is reduced to a single, pixel-size dot.
“Phobos crosses the Martian sky three times a day, and Earth is visible for months at a stretch, but catching one directly behind the other takes planning and a little luck,” said Mark Lemmon, a Mastcam-Z co-investigator at the Space Science Institute in Boulder, Colorado, who planned the observation and assembled the composite.
This composite of seven images of Earth passing behind the Martian moon Phobos was acquired from data taken on July 2, 2026, 1,907th Martian day, or sol, of the mission. The black background is the result of image processing that removed extraneous light in the background to enhance detail.
NASA/JPL-Caltech/ASU/MSSS/SSI
Transits, occultations, eclipses
Astronomers call the event captured in this observation an occultation: when a larger-appearing body completely blocks the one behind it from the viewer’s standpoint. By contrast, an eclipse occurs when one object moves into the shadow of another. When the Moon passes through Earth’s shadow, it’s called a lunar eclipse; when one object that appears to be the same size as another blocks it, like when the Moon passes before the Sun, it’s known as a solar eclipse.
When the roles are reversed, with a smaller-looking object crossing the face of a larger-looking one, astronomers call that a transit. Perseverance has observed those, too: when Phobos or Deimos crosses the disk of the Sun as seen from Mars. These are sometimes described informally as “Martian solar eclipses.”
More about Perseverance
NASA’s Jet Propulsion Laboratory in Southern California, which is managed by Caltech, built and manages operations of the Perseverance rover on behalf of the agency’s Science Mission Directorate in Washington, as part of NASA’s Mars Exploration Program portfolio. Arizona State University leads the operations of the rover’s Mastcam-Z instrument, working in collaboration with Malin Space Science Systems in San Diego, on the design, fabrication, testing, and operation of the cameras.

 Login
Login













.jpg)