Morgan Stanley became the first global systemically important bank to launch a spot Bitcoin ETP and it crossed $600 million within months of its April debut. Amy Oldenburg, Head of Digital Assets at Morgan Stanley, joins host Spencer Nichols to explain how that product came together, why it was priced below competing spot Bitcoin ETFs, and what still stands between clients and their first Bitcoin allocation. She also details the firm’s 0–4% allocation framework across three investor risk profiles and why Morgan Stanley has no equivalent gold allocation. Plus: whether Bitcoin could land on Morgan Stanley’s own balance sheet.
Host: Spencer Nichols — Bitcoin Magazine Amy Oldenburg, Head of Digital Assets at Morgan Stanley
Chapters: 0:00 — Morgan Stanley on Putting Bitcoin on Its Own Balance Sheet 1:14 — 26 Years at Morgan Stanley: Emerging Markets to Head of Digital Assets 2:10 — First Major Bank to Launch a Spot Bitcoin ETP Tops $600 Million 3:14 — Education, E-Trade Spot Crypto, and What Clients Actually Own 4:49 — Why Morgan Stanley Priced Its Bitcoin ETP So Low 6:40 — The 0–4% Allocation Framework and the Digital Gold Thesis 8:52 — Correlation Regimes: Digital Gold, High Beta Tech, and Volatility 11:41 — Gold 2.0, Market Cap, and Bitcoin on the Balance Sheet 14:37 — Institutional Market Structure, Quantum Risk, and Client Trust 18:02 — Global Off-Ramps, Tokenization, Stablecoins, and Morgan Stanley Research
DISCLAIMER: The views and opinions expressed in this show are those of the participants and do not necessarily reflect the official policy or position of BTC Inc., Bitcoin Magazine, or any affiliated entities. This content is provided for informational and educational purposes only and should not be construed as investment, legal, tax, or accounting advice. Nothing contained in this show constitutes a solicitation, recommendation, endorsement, or offer to buy or sell any securities or financial instruments. Viewers should consult their own advisors before making financial or business decisions.
Nasdaq-listed bitcoin treasury Strive now holds 25,000 BTC — worth nearly $2 billion — following its latest buy.
The company said Monday that it bought 469 bitcoins at an average price of approximately $77,954. It is still the fifth biggest publicly traded bitcoin company, according to Bitcoin Treasuries. Strategy, Twenty One, Metaplanet, and MARA all hold more bitcoin than Strive.
CEO Matt Cole wrote on X Monday that 100% of the capital raised during the week came through sales of SATA, Strive’s perpetual preferred stock.
Dallas, Texas-based Strive’s stock (ASST) was trading more than 6% higher following the news.
Strive debuted as an official bitcoin treasury last year. The company was founded by former Ohio gubernatorial candidate and tech entrepreneur Vivek Ramaswamy.
In January 2026, it completed the acquisition of Semler Scientific in an all-stock deal — the first instance of a publicly traded Bitcoin treasury company acquiring another such company.
Like with other digital asset treasuries, the idea is that investors can get amplified returns from Strive’s stock. The company buys bitcoin with equity, and maintains a debt-free balance sheet: no bonds, no credit lines, and no leveraged positions that could trigger forced liquidation in a downturn.
The company is different to other major bitcoin treasuries because it has no debt.
Other major bitcoin treasuries — like the biggest, Strategy — have used leverage to buy the leading cryptocurrency.
Strive CEO Matt Cole has described the company as debt-free with zero margin requirements and zero encumbered bitcoin.
Strive has purchased 469 Bitcoin for about $36.6 million, raising its corporate treasury to exactly 25,000 BTC as of Sep. 11. According to Strive’s Form 8-K filing with the U.S. Securities and Exchange Commission, the company bought Bitcoin (BTC) between…
Bitcoin treasury Strategy held off buying bitcoin again last week. The Nasdaq-listed company said it instead bought $139 million of its preferred stock STRC.
A Monday filing with the Securities and Exchange Commission on Monday showed that the company repurchased 1.42 million STRC preferred shares for around $139.3 million between September 8 and September 13.
The company still owns 845,050 bitcoins worth $66.2 billion at today’s prices, and has two cash balances: USD Reserve and USD Cash, holding $5.1 billion and $1.3 billion, respectively.
Strategy, which is the largest corporate holder of bitcoin, this year switched from predictably buying the biggest cryptocurrency this week to buying back its stock and building a cash reserve.
On some occasions, the company even sold small bits of its BTC stash — despite founder and chairman Michael Saylor famously preaching to “never sell your bitcoin.”
After a 10-week hiatus, the company started buying bitcoin again in the final week of August, scooping up nearly $370 million in the leading cryptocurrency.
It hasn’t bought any bitcoin since.
Its Nasdaq-listed shares (MSTR) were 3% trading higher on Monday. The stock has lost over 75% of its value since notching a record in November 2024 — one month before bitcoin passed the once mythical and long-awaited $100,000 mark.
Strategy — formerly MicroStrategy — is an enterprise software company that pivoted to buying and holding bitcoin in 2020.
It first bought the cryptocurrency to protect its shareholders from inflation but has since aggressively bought the asset and pivoted to being a bitcoin treasury.
Strategy has defended its recent bitcoin sales, with CEO Phong Le saying that the company now has a “bullet-proof balance sheet.”
In the company’s quarterly earnings in July, Strategy posted a $8.22 billion loss. But Le reassured investors that the firm’s current paper loss was nothing to worry about.
“We’re the J.P. Morgan of the crypto economy, so whether we sell 1,000 bitcoin out of 840,000 to me is irrelevant to the conversation,” Le said in a subsequent interview.
Core inflation ran a tenth hot, odds of a September rate increase jumped from a coin flip to near-certainty in a single session, and crypto rallied across the board. The market did not buy the Fed’s direction. It bought the end of the argument.
Generated using Nano Banana 2
The Verdict
Bitcoin — short term (3–5 months). $77,466, up 0.67% on a day that by yesterday’s logic should have hurt it badly. The Sept 16 FOMC is now priced at roughly 90% for a 25bp hike, which inverts the setup this digest has been describing all week. The hike is no longer the risk — it is the base case. The risk is a hold, and a hold would arrive as a shock into positioning that has stopped hedging for one. $83,000 on a daily close confirms the range; $72,000 breaks it, and the two are now equidistant at about 7% either way.
Bitcoin — long term (1–3 years). For most of its history bitcoin’s deepest structural advantage was that you could read the holders. Cost basis, dormancy, capitulation, accumulation — all of it legible on a public ledger, in a way no equity or commodity has ever offered. That legibility is eroding. On-chain data showed an unusually muted HODL-waves reaction to July’s break below $58,000, an anomaly sharp enough to raise questions about whether that level ever functioned as a bear-market floor at all #16. The mechanical reason is simple: as coins migrate into ETFs, custodians, wrapped products and treasury companies, the decision to sell stops touching the chain. An ARKB redemption is a share transaction. Over three years you are underwriting an asset whose transparency premium is being quietly spent down — the ledger stays public while the behaviour it used to record moves off it.
Ethereum — short term. $2,550.62, up 4.60% — roughly seven times bitcoin’s move, on no Ethereum-specific news whatsoever. Treat that as a positioning outcome rather than a rerating: an asset that outruns the benchmark sevenfold without a story of its own is being covered, not accumulated. The practical effect is that the $2,300 invalidation line, which sat 5.7% away on Thursday, is now 9.8% below spot. The cushion that did not exist yesterday was rebuilt in a single session, and it was rebuilt by short sellers rather than buyers.
Ethereum — long term. Standard Chartered published a forecast this week that Sky will pass roughly five times as much value to token holders by 2028 as USDS adoption and borrowing capacity expand, putting a $0.325 target on SKY #17. Set aside whether the number is right and notice its shape: a global bank modelling an application token as a claim on a growing stream of distributed value. That model does not exist for ETH, because ETH lacks the mechanism it describes. Over three years the base asset competes for the same institutional dollar against things built on top of it that can be underwritten with a spreadsheet. The app layer is learning to pay. The chain is not.
Cardano — short term. $0.2073, up 0.28% — the weakest major for the third consecutive session, and this time it happened on a fully green board. The previous two sessions could be explained as macro beta, since ADA falls hardest when everything falls. That explanation is now spent. On a day when every other major caught a bid of 0.67% to 4.60%, ADA caught 0.28%, which is what thin two-way books look like when the flow arrives and routes elsewhere. Nothing Cardano-specific broke. Nothing Cardano-specific showed up either.
Cardano — long term. Bitwise is closing its Dogecoin ETF less than a year after launch, with trading halting October 14 #18. The fund did about $3 million of volume on its opening day and never came close again. Much of the institutional case for every large altcoin — Cardano included — rests on the assumption that a listed wrapper eventually unlocks demand sitting on the sidelines. Dogecoin just ran that experiment to completion: the wrapper existed, the access was real, and nobody showed up. The question for ADA over three years is not whether a product gets approved. It is whether there is a buyer waiting behind it. Cardano’s market cap is $7.78B. Draw your own conclusion about which of those two is the binding constraint.
Solana. $101.43, up 2.29%, back above the $100 handle it lost on Thursday. Reclaiming a round number in two sessions says the break was liquidation rather than a change of view.
BNB and XRP. $727.82 (+3.13%) and $1.37 (+1.70%). Both mid-pack, which is the whole story — on a day driven by a macro release, the majors sorted themselves by how much leverage had to unwind, not by anything either network did.
Why The Market Is Here
August CPI landed at 0.4% for the month and 3.4% year over year, both in line with consensus #2. Core, which is the number the Fed actually watches, rose 0.3% against a 0.2% forecast — a tenth hot, with the 12-month core at 2.4% #1. That single tenth did the work. Rate-hike odds for Wednesday’s meeting went from roughly a coin flip to about 90% inside one session #3. Bond yields printed fresh multi-decade highs intraday on the release #5.
And then everything went up.
The S&P added 1.00%, the Nasdaq 1.12%, gold 0.91%, and every major crypto closed green. The 30-year Treasury yield touched 5.36% and finished lower on the day at 5.349%. Most telling of all, the VIX fell 11.04% to 15.87 — a volatility crush, on the day the Fed’s path turned hawkish.
Yesterday this digest argued that crypto is the most junior claim in the macro stack — no earnings underneath it, so it absorbs a discount-rate shock in full and then some. Today the discount-rate news got unambiguously worse and bitcoin went up. The juniority thesis does not survive that tape in its simple form.
Here is the repair, and it is the more durable frame. Crypto is not priced off the level of the policy rate. It is priced off the variance around it. On Thursday you owned a coin flip four days out from a decision — the single most expensive thing a portfolio can hold, because it cannot be hedged cheaply in either direction. On Friday you own a decision. The rate is worse and the distribution is narrower, and for risk assets the second of those was worth more than the first cost. An 11% volatility crush on a hawkish print is not a market that disagrees with the Fed. It is a market that has stopped paying for insurance against an argument that just ended.
That framing has one weakness, and it belongs in the open rather than in a footnote. The argument has not ended — it has only been priced as though it has, and the revision markets made on Friday was performed on a chair who has never endorsed it. Kevin Warsh’s preferred inflation gauge continues to tell a materially different story from the headline CPI #4. Ninety percent is not a forecast of what Warsh believes. It is a forecast of what the market thinks an energy shock will force him to do. That gap is the widest it has been all cycle, and the entire volatility crush is standing on top of it.
The geopolitics delivered the same lesson from the opposite direction. Houthi forces took control of essentially the whole of Yemen’s Red Sea coastline #8, a development serious enough that the live question is now whether they can close the Red Sea outright rather than merely harass it #9. Brent fell 2.32% to $105.13 on the news. A chokepoint changed hands and the barrel went down.
Two events that should have hurt, and neither did. The common thread is not optimism. It is that both were already carried in the price — the hike since Tuesday, the Bab el-Mandeb risk premium for weeks. Markets stop responding to a risk at the point where they have finished buying it, not at the point where it stops being real.
Underneath the rally, the household transmission kept tightening. Fuel costs are still doing the squeezing #10, and the 30-year mortgage rate crossed 7% for the first time in over a year while home sales hit their 2026 low against a seven-year inventory high #11. A tape can crush volatility and a housing market can freeze in the same week. They are answering different questions.
Institutional Pulse
The flows went the other way from the price. US spot bitcoin ETFs shed roughly $449 million across three sessions, with Thursday’s $282.6 million the largest single-day outflow since July. ARK 21Shares accounted for $164 million of it, ahead of Grayscale at $36 million and Fidelity at $33.6 million; ether and solana funds also ran net negative #7.
So the visible institutional channel was a net seller into a week that ended green. Whoever bid Friday’s tape was not the ETF investor. CoinDesk attributed part of bitcoin’s recovery toward $77,300 to zcash leverage unwinding #6 — which is to say, a chunk of the move was positions closing rather than capital arriving, the same mechanic driving ETH’s outperformance above.
The sharpest print of the day was a company destroying its own paper. Metaplanet cut its executive reward pool by 41%, extinguishing about $220 million in value and scrapping its employee warrant plan, after the stock fell roughly 17% across two sessions #13. A bitcoin treasury company’s compensation structure is a leveraged claim on its own share premium, and when the premium compresses the incentive package stops functioning before the balance sheet does. The coins on Metaplanet’s books did not move. The instrument built on top of them lost a fifth of its value in two days.
Meanwhile India’s SEBI launched its Demat 2.0 pilot with more than $100 million of tokenized corporate bonds settled via wholesale CBDC #19. A sovereign regulator now has a working tokenized settlement stack with a central-bank money leg and no public chain anywhere in it.
On what the flow tables miss. The ETF numbers above measure one access route — the retail-and-advisor wrapper — not the whole building. A sovereign bond pilot, a compensation restructuring at a treasury company and a leverage unwind on a privacy coin all moved capital through crypto this week, and none of them appear in a netflow chart.
Calendar Watch
Three events, one week, and they overlap.
FOMC, Sept 15–16. Roughly 90% priced for a 25bp hike. The trade is no longer directional — it is about whether the resolution the market bought on Friday actually gets delivered.
Bank of Japan, Sept 16–17. MarketWatch makes the case that the BoJ, not the Fed, is the more likely source of next week’s genuine shock #12. With USDJPY at 153.68 and the Fed expected to tighten the day before, the yen carry trade gets repriced twice in twenty-four hours.
CLARITY Act, Senate vote Sept 15. Senate Republicans circulated a revised draft ahead of the initial vote, adding registration requirements for controlled trading protocols while leaving ethics provisions largely intact #14. The vote lands the day before the Fed decision, which means the most consequential crypto legislation of the cycle will be scored by a market whose attention is elsewhere.
Signals Worth Watching
The hold is now the shock. This is the cleanest asymmetry on the board. If Warsh holds on Wednesday against 90% pricing, the volatility crush reverses instantly and crypto is positioned wrong in the direction that usually hurts most — long into an unhedged surprise. A hike delivers what is priced and should be close to a non-event.
A second quantum result landed in one day. Yesterday’s note here was that one halved benchmark is not a crisis but a pattern of them is a schedule, and to watch for a second result this quarter. It arrived the next morning: an AI-agent challenge cut a resource benchmark for one component of a quantum attack on bitcoin by 86% #15. Two results, two days, 50% then 86%. The relevant variable is no longer cryptographic research throughput — it is how much of that research AI agents can do unsupervised.
Zcash wrapper premium — concluded. This tracker was opened on Sept 8 and ran three quiet sessions. It has now resolved, in the least interesting way available: the leverage unwound, as noted above. No structural signal, no persistent premium, just positioning that got too large and then did not. Dropping it.
Bab el-Mandeb freight and war-risk insurance — still no print. An entire coastline changed hands and there is still not a single published war-risk premium or freight spread in the feed to price it with. When that number finally appears it will not confirm what the oil price already told you; it will be the first honest read on whether shipping treats this as a spike or a new base.
If I Had $100 This Month
A green board on a hawkish print, four days before a central bank meeting that is 90% priced and one day before a second central bank that is not, is not a setup that rewards conviction sizing. It is a setup that rewards being already positioned and not touching it.
$60 → BTC. The volatility crush is doing the work right now, and buying after a crush and before two central banks is worse timing than buying on schedule regardless of either.
$25 → ETH. A 4.6% day on no news is a positioning move, not a rerating — treat the higher price as noise around the same accumulation plan, not as a signal to hesitate.
$15 → ADA. Third straight session as the weakest major, this time on a day when everything else worked, which is a liquidity fact rather than a Cardano one.
Hold actual coins. Not ETF shares, not equity proxies.
This is how I’d think about it. Make your own call.
Sources
#1 — Core CPI rose a faster-than-forecast 0.3% in August, setting up possible Fed rate hike — CoinDesk
#2 — Inflation persisted in August, potentially locking in a Fed interest rate hike — CNBC
#3 — Fed rate hike odds surge to 90% on monthly jump in core prices — Yahoo Finance
#4 — Hotter CPI complicates Fed hold as Warsh’s preferred inflation gauge tells different story — CoinDesk
#5 — Bitcoin spikes toward $80K as US CPI data delivers new 22-year high in bond yields — CoinTelegraph
Equity, gold, oil and yield figures are intraday prints as of 12:26pm ET — the US cash session was still open at the close of this data window. Fear & Greed fell 13 points on a day every major rose, the mirror image of yesterday’s divergence; a sentiment survey lagging a two-day reversal is doing exactly what a sentiment survey does.
Chain of Thought is a daily crypto and macro market digest. Not financial advice.
Bitcoin’s 4-year halving cycle built its reputation — but ETFs, shrinking returns, and macro forces are rewriting the playbook for 2028.
Bitcoin Halving Cycle 2028 — History vs. What’s Different
Every four years, a single line of code fires, and the entire crypto market holds its breath.
It’s called the halving. It has preceded every major Bitcoin bull run since 2012. And it has turned a decade of skeptics into believers, because the pattern looked almost too clean to be coincidence: halving, rally, euphoric peak, brutal crash, repeat.
But in 2026, something is different. Bitcoin trades in the high-$70,000s, roughly 40% below its October 2025 all-time high near $126,000 — and instead of the market simply “waiting for the next halving” like it always has, a real debate has broken out among analysts, on-chain researchers, and Wall Street desks: is the four-year cycle still driving Bitcoin’s price, or has it quietly died, replaced by something closer to a traditional macro asset?
If you’ve ever typed “when is the next Bitcoin halving” or “does the 4-year cycle still work” into Google, this is the article that actually answers it — with the historical data, the current on-chain reality, and the honest uncertainty that most “guru” content skips.
What Is the Bitcoin Halving, Exactly?
Bitcoin’s supply isn’t controlled by a central bank. It’s controlled by code written by Satoshi Nakamoto in 2009. Roughly every four years, or every 210,000 blocks mined, the reward paid to Bitcoin miners for validating transactions gets cut in half.
That’s it. That’s the whole mechanism. But the implications are enormous, because it directly throttles how much new Bitcoin enters circulation.
Here’s the halving schedule so far:
2012 — Block reward drops from 50 BTC to 25 BTC
2016 — Block reward drops from 25 BTC to 12.5 BTC
2020 — Block reward drops from 12.5 BTC to 6.25 BTC
2024 — Block reward drops from 6.25 BTC to 3.125 BTC (this happened on April 20, 2024)
2028 (projected) — Block reward drops from 3.125 BTC to 1.5625 BTC, expected around block 1,050,000, likely in spring 2028
Every 210,000 blocks, new issuance is cut in half again — a slow march toward Bitcoin’s hard cap of 21 million coins, with the final fraction of a coin expected to be mined around the year 2140.
The economic logic is straightforward: if demand stays constant while new supply entering the market gets cut in half, price should, in theory, rise. For three consecutive cycles, that’s more or less exactly what happened.
What History Actually Says: The Pattern That Built Bitcoin’s Reputation
This is the part most explainers get wrong — they treat the halving cycle as one story, when it’s really four increasingly different stories.
Cycle 1 (2012): Bitcoin traded around $12 at the halving. Within about a year, it was pushing toward $1,000. That’s a roughly 100x move — a number so extreme it’s only possible in a market that small and immature.
Cycle 2 (2016): Bitcoin sat near $650 at the halving. By the euphoric peak of December 2017, fueled by retail mania and the ICO boom, it touched almost $20,000 — about a 30x multiplier.
Cycle 3 (2020): Bitcoin was trading around $8,500 at the halving, in the depths of pandemic uncertainty. It went on to hit roughly $69,000 in late 2021 — close to an 8x return.
Cycle 4 (2024): Bitcoin was already near $64,000 on halving day — itself remarkable, since previous halvings had happened in bear or recovery markets, not near record highs. It later touched a new all-time high near $126,000 in October 2025. The multiplier from halving day to peak: roughly 2x.
Lay those four numbers next to each other — 103x, 30x, 8x, 2x — and the trend is unmistakable. Each cycle has delivered a dramatically smaller percentage return than the one before it. That’s not a bug in the data; it’s the natural result of a market that keeps getting bigger, deeper, and more institutionally owned.
The other consistent historical pattern: every halving has been followed by a new all-time high within roughly 12–18 months. That streak is intact — four for four. The open question is whether it stays intact for a fifth time in 2028.
What’s Genuinely Different This Time
Three structural shifts separate the current cycle from everything that came before it, and they’re worth understanding individually rather than lumping them together as vague “this time it’s different” talk.
1. The Supply Shock Is Now Almost Meaningless
In 2012, the halving removed about 3,600 BTC per day from new issuance — a massive deal in a market where daily trading volume was thin and illiquid. By the 2024 halving, that number had shrunk to roughly 450 BTC per day, worth around $28 million against a market moving billions of dollars daily. By the 2028 halving, daily issuance drops again, from roughly 450 BTC to about 225 BTC.
Compare that 225 BTC/day figure to spot Bitcoin ETF demand, which has swung between 5,000 and 20,000 BTC per day in active buying months. The math is stark: the halving’s direct supply impact is now a rounding error next to institutional flows. CryptoQuant CEO Ki Young Ju has publicly argued the cycle theory is effectively “dead” for exactly this reason — the mechanism that mattered in a thin 2012 market is arithmetically trivial in a multi-trillion-dollar one.
2. Institutions Set the Price Now, Not Retail Mania
The approval of spot Bitcoin ETFs in January 2024 fundamentally rewired how demand enters the market. For the first time, pension funds, RIAs, and corporate treasuries could buy Bitcoin exposure through a regulated brokerage account instead of a crypto exchange. That pulled demand forward — Bitcoin hit its cycle-four all-time high before the traditional post-halving euphoria phase even really got going, breaking the old script where prices climbed for a year-plus after the halving before topping out.
This also means Bitcoin now correlates more tightly with traditional risk assets, interest-rate expectations, and global liquidity conditions than with its own internal supply schedule. When the Fed cut rates in December 2025, Bitcoin didn’t rally the way old playbooks predicted — a signal that macro forces are now competing with, and sometimes overriding, crypto-native catalysts.
3. A Rival Theory Has Emerged: The Two-Year Cycle
A growing camp of analysts now argues Bitcoin has shifted from one long four-year cycle to shorter, overlapping cycles driven by global liquidity expansion and contraction — compressed boom-bust patterns that front-run the halving rather than follow it. Under this framework, institutional access and faster information flow mean the market “prices in” the halving’s effects well before the event itself, making the old calendar-based timing models far less reliable for entry and exit decisions.
None of this means the halving is irrelevant. Every analyst tracking this debate agrees it still shapes long-term scarcity. What’s changed is whether it’s still the dominant short-term price driver — and the honest answer, based on the data, is probably not anymore.
Where Bitcoin Stands Right Now in the Cycle
As of September 2026, Bitcoin trades in the upper-$70,000 range, roughly 40% below its October 2025 peak near $126,000. Based on the structure of prior cycles, several analysts place the current bear-market bottom window somewhere between October 2026 and January 2027 — though, as always with Bitcoin, that’s a pattern-based estimate, not a guarantee.
The next halving is projected for around April 2028, with block 1,050,000 marking the moment the reward falls to 1.5625 BTC. If the historical 12–18 month post-halving rally pattern holds a fifth time, that points toward a potential cycle peak sometime between late 2029 and early 2030 — though given how dramatically cycle four already deviated from the script, treating that as a confident prediction rather than a rough historical echo would be a mistake.
What This Means for Anyone Watching Bitcoin Right Now
The takeaway isn’t “the halving doesn’t matter” or “the four-year cycle is dead.” It’s more nuanced, and more useful:
The halving still enforces genuine scarcity — it’s the mechanical backbone of Bitcoin’s entire monetary policy, and that hasn’t changed.
Its short-term price impact has shrunk with every cycle — and by 2028, it will be smaller still, dwarfed by ETF and institutional flows.
Macro conditions now compete directly with crypto-native catalysts — interest rates, global liquidity, and risk appetite increasingly drive Bitcoin’s price action alongside, or instead of, its own supply schedule.
Diminishing percentage returns are the new normal — a maturing, trillion-dollar asset simply cannot replicate 100x or even 30x moves, and expecting it to is a recipe for disappointment.
Every past halving has been followed by a new all-time high within 12–18 months — a streak that remains unbroken, even as the size of the move keeps shrinking.
Bitcoin isn’t repeating its history. It’s rhyming with it — same underlying mechanism, wildly different market wrapped around it. Understanding that distinction is the difference between using the halving as one useful data point among many, and treating it as a crystal ball it was never built to be.
Frequently Asked Questions
When is the next Bitcoin halving?
The next halving is projected for around April 2028, at block height 1,050,000, when the block reward drops from 3.125 BTC to 1.5625 BTC. The exact date shifts slightly based on network hash rate and block times.
Does the Bitcoin four-year cycle still work?
It’s genuinely debated. The pattern of a new all-time high within 12–18 months of each halving has held for four consecutive cycles, but the percentage returns have shrunk dramatically each time, and institutional/ETF demand now overshadows the halving’s direct supply impact.
Why does each Bitcoin halving cycle produce smaller returns?
Because Bitcoin’s market has grown from a thin, illiquid niche market in 2012 to a multi-trillion-dollar asset class. The same fixed percentage cut in new supply has a much smaller relative impact on a much larger, more liquid market.
What’s different about the current Bitcoin cycle compared to past ones?
Spot Bitcoin ETFs (approved January 2024) pulled institutional demand forward, Bitcoin hit its cycle all-time high with a much smaller multiplier than prior cycles, and macro factors like interest rates now compete with the halving as primary price drivers.
This article is for informational and educational purposes only and does not constitute financial advice. Cryptocurrency markets are highly volatile — always do your own research before making investment decisions.
Deconstructing the $363M PPI Liquidation and the $76.4K Spot Defense
Why algorithmic selling following the 5.4% PPI print met immediate institutional absorption, confirming the strength of the $76,000 structural base.
by Sheni Ogunmola
Daily Morning Logic | Institutional Equity Research
The Macro Collision: Hotter PPI Meets Spot Order Books
Financial feeds opened the session under aggressive selling pressure following the latest Producer Price Index (PPI) print, which rose 0.4% month-over-month, pushing annualized wholesale inflation to 5.4%. Systematic trading desks immediately priced in hawkish interest rate risks, triggering an automated risk-off impulse across major derivative platforms.
The knee-jerk reaction was sharp and mechanical: Bitcoin plummeted 2.2% to an intraday low of $76,464, wiping out $363 million in leveraged long positions within hours.
Social feeds instantly turned defensive, with retail analysts warning of an imminent breakdown toward $70,000 and the invalidation of the late-summer recovery. Yet, by mid-session, the entire move was aggressively absorbed, with price snapping straight back toward the $78,680 mark.
Separating paper leverage reactions from physical order-book clearing reveals that this flush was an execution event rather than a regime change.
Anatomy of the Tape: Leverage Capitulation vs. Spot Inelasticity
Examining cross-exchange order flow and on-chain cost bases exposes three critical mechanics that prevented a deeper cascade:
The $363M Long Liquidation Flush: The initial drop beneath $77,000 was driven by cascading margin calls on high-leverage perpetual contracts. The speed of the move purged late breakout momentum traders and reset perpetual funding rates to flat, clearing excess derivative froth.
SOPR Neutrality at 1.01: On-chain data indicates that while short-term holders moved roughly 549,000 BTC across exchanges during the volatility, the Short-Term Output Profit Ratio (SOPR) held firm at 1.01. Short-term allocators were taking marginal profits or breaking even — they were not capitulating at a loss into the bid.
Spot ETF Absorption Momentum: Despite localized intraday chop, broader balance-sheet demand remains structurally sound. Regulated spot Bitcoin ETFs have absorbed over $3.8 billion over the past three weeks, providing a consistent liquidity floor that drains liquid float directly off OTC desks.
The $76,400 Structural Defense: The rapid bounce from $76,464 demonstrates that the dense limit buy orders resting between $76,000 and $76,900 functioned as intended. Institutional buyers stepped in to provide immediate liquidity, refusing to allow price to settle below previous weekly range support.
Valuation Asymmetry: The Flaw in the Inflation Breakdown Narrative
The prevailing retail assumption is that any uptick in inflation prints must trigger a secular bear trend for digital assets.
Applying the Dhandho mental model — anchoring decisions on bounded downside and asymmetric expansion — highlights the logical failure of that perspective:
Downside Is Strictly Defined by Spot Blocks: The aggressive defense of $76,400 establishes a clear boundary. Selling pressure required an unexpected inflation surprise and $363 million in forced liquidations just to push price down 2.2%, only for that drop to be erased within six hours.
Programmatic Supply Scarcity Outweighs Macro Noise: Global central banks and sovereign debt dynamics are constrained by surging fiscal borrowing costs, while Bitcoin’s programmatic post-halving issuance remains mathematically fixed at ~450 BTC per day. Macro debt concerns continue driving sovereign and corporate balance sheets toward non-debasable assets.
Overhead Liquidity Vacuum: With leverage flushed from the system and bears repeatedly punished for shorting into the $76,000 demand shelf, the resting liquidity pools above $80,300 and $82,500 remain magnetic targets for the next expansion.
Strategic Portfolio Allocation
“Macro headlines generate the volatility; structural balance sheets provide the absorption. Never confuse a rate-expectation margin flush with an institutional exit.”
Holding scarce monetary assets and dominant infrastructure tollbooths remains the optimal posture in an environment defined by persistent inflation and high fiscal deficits. As long as spot order books continue absorbing headline-driven flushes above $76,000, current price action represents accumulation within a tightening structural range.
Legal Notice: This research report is compiled strictly for educational and informational purposes. We are not licensed financial advisors. Digital asset investments carry substantial risk of capital loss. Conduct independent due diligence before allocating capital.
The Macro Inflation Flush was originally published in Coinmonks on Medium, where people are continuing the conversation by highlighting and responding to this story.
You can borrow against Bitcoin, stake it, trade it on-chain, post it as margin for perpetuals, supply it to a liquidity pool, convert it into stablecoins to pay someone, and use it to buy tokenised stocks. Two of those are worth doing for most holders, two are worth doing for a specific kind of trader, and three are worth skipping unless you have a reason. None of them happen on Bitcoin’s own chain, so every one of them starts with moving value somewhere else.
Why would anyone want Bitcoin in DeFi?
Bitcoin holds more value than anything else in crypto and does less with it than almost anything else in crypto. At roughly $78,482 per coin on 8 September 2026, its market capitalisation sits near $1.57 trillion — 57% to 59% of the entire asset class, depending on the tracker. It is the deepest and most widely held pool of capital in the industry.
Almost none of it is doing anything. Spark’s BTCFi research, published 29 May 2026, put Bitcoin’s DeFi footprint at 91,332 BTC — 0.46% of circulating supply, or about 0.8% counting every wrapped variant and all of Babylon’s staking. Threshold’s July 2026 follow-up measured roughly 91,000 BTC. The same research puts Ethereum’s DeFi penetration near 15% of ETH supply.
So the gap is roughly thirty-fold, and it is not a demand problem. Holders want liquidity without selling; the tax event and the lost position are both real costs. The gap exists because of where Bitcoin lives.
Why can’t you do any of this on Bitcoin itself?
Bitcoin’s base chain has no lending markets, no perpetuals, no automated market makers and no stablecoins, and that is a design decision rather than a missing feature. Bitcoin Script can verify a signature, enforce a timelock and check a hash preimage. It cannot run the persistent, composable contract state a money market or an order book needs. Ten-minute blocks make anything price-sensitive slow, and there is no native dollar to price a loan in.
So every use case below has the same first step: value has to move to a chain that can execute it. That step is the part most guides skip, and it is where the real cost and the real risk live. Once value is there, you no longer hold Bitcoin. You hold a token that tracks its price, whose risk is the issuer’s or the bridge’s.
What can you actually do with Bitcoin in DeFi?
1. Borrow stablecoins against it
Borrowing against Bitcoin is the most used thing you can do with it, and the only one here that leaves your position intact. You deposit a Bitcoin-denominated token as collateral, borrow USDC or USDT against it, and repay later. No sale, so in most jurisdictions no disposal at the point of borrowing.
Aave is the biggest venue: over $14.6 billion in total value locked as of mid-2026, more than $3 billion of it in Bitcoin markets. It accepts WBTC and cbBTC, with WBTC carrying a 73% maximum loan-to-value and a 78% liquidation threshold. Morpho is second at over $1.5 billion in BTC vaults.
The honest part: this is a margin loan, and margin loans liquidate. Borrow at 50% LTV against a 78% threshold and your collateral only has to fall about 36% before the protocol sells it for you, at a price you did not pick. Bitcoin has produced that drawdown repeatedly.
2. Stake it
Bitcoin staking pays a yield for locking BTC in a timelock script on the Bitcoin chain itself, without wrapping or bridging it anywhere. The coins stay under your keys; the stake secures other proof-of-stake networks, and those networks pay for it.
Babylon is the category, not just the leader: over $4 billion in TVL and roughly 57,000 BTC as of May 2026, close to 80% of everything counted as Bitcoin DeFi. Lombard, at about $1.5 billion, issues the liquid staking token most people use to keep the position tradeable.
The honest part: yields are low single digits, lockups are real, and the liquid staking wrapper reintroduces exactly the token risk native staking was meant to avoid. Solv Protocol, another large player in the category, was exploited in March 2026.
3. Trade with it
Once Bitcoin is on an EVM chain or Solana you can trade it against anything else on-chain, at any hour, without an account. Uniswap is the largest decentralised exchange by volume and the deepest venue for WBTC and cbBTC pairs against ETH and stablecoins.
The honest part: for the plain trade of Bitcoin into dollars, a centralised exchange is almost always cheaper. On-chain trading earns its keep when the thing you want is not listed anywhere else — a token on a rollup, a new asset, something that never reaches an exchange.
4. Post it as margin for perpetuals
Perpetual futures venues let you take leveraged directional positions, and the largest on-chain one is Hyperliquid, which processed $633 billion in volume in Q1 2026, holds roughly 70% of decentralised perp volume and about 6.2% of the global perps market including centralised exchanges.
The honest part, and it is the whole story: Hyperliquid margins in USDC, not in Bitcoin. Putting BTC to work there means converting it first, which is a disposal, after which you hold dollar collateral and a synthetic position that can be closed against your will. A legitimate trade, but not the trade of holding Bitcoin.
5. Supply it to a liquidity pool
Supplying Bitcoin to an automated market maker earns a share of trading fees on the pair. Uniswap v3 and Curve are the two venues that matter.
The honest part: for most holders, this is the worst option on the list. Bitcoin pools are thin — the WBTC/cbBTC pool on Base showed roughly $270,000 of liquidity against $135,000 of daily volume in 2026. And a volatile pair carries impermanent loss, so a large BTC move can leave you with less than holding would have. Fee income on a thin pair rarely covers it.
6. Convert it and pay someone — Lightning, or stablecoin rails
If the goal is to send value rather than hold a position, Bitcoin has two working answers and neither is a DeFi protocol. Lightning settles small BTC payments in seconds for cents, and is the right tool when both sides want bitcoin. For paying someone who wants dollars, converting to USDC or USDT and sending on a cheap chain is the standard route.
The honest part: spending Bitcoin is selling Bitcoin. A card, a payment processor and a stablecoin conversion are all disposals, taxable in most jurisdictions, and a year of small ones is worse to account for than a single sale.
7. Buy tokenised stocks and real-world assets with it
Tokenised equities are the newest destination, and Bitcoin is a legitimate funding source for them. On Solana, Kamino Lend handles 82.6% of tokenised stock lending — $31 million of the $53 million of tokenised stock collateral on the network as of late July 2026. Robinhood’s own chain is building in the same direction.
The honest part: $53 million across an entire chain is a small market. The rails work, the depth does not exist yet. Early rather than established.
Which of these are actually worth it?
How do you get Bitcoin onto an EVM chain, Solana or a rollup?
Four routes exist, and they differ mainly in who holds your Bitcoin while you are using the token. Ask that first; the fee difference is usually smaller than the custody difference.
A centralised exchange: Deposit BTC, sell or convert, withdraw the destination asset. For common pairs — BTC to USDC, BTC to ETH — this is frequently the cheapest route available and worth checking before anything else. It costs you an account, KYC and the exchange holding your coins in between, and it fails outright for most rollups, which exchanges do not support as withdrawal networks.
Mint directly from the issuer:Coinbase issues cbBTC, BitGo WBTC, Kraken kBTC, Binance BTCB, and Circle launched cirBTC on Ethereum on 8 June 2026. You are trading Bitcoin for a claim on that institution’s reserves, which buys the deepest liquidity and the widest acceptance in lending markets. Threshold’s tBTC is the decentralised alternative: 51-of-100 threshold signers, about $5 billion of cumulative bridge volume, no losses in six years.
Cross-chain swap protocol:Garden Finance, THORChain, and Chainflip all move native BTC to other chains without an exchange account, and they differ more in coverage than in what they enable. THORChain reaches the most standalone L1s; Chainflip runs a short, deliberate asset list across six chains. Garden’s catalogue on 8 September 2026 listed 26 assets across 15 chains, including Lightning, Solana, Starknet, Spark, Ink and Hyperliquid, 13 of those entries a form of Bitcoin across seven tickers. In a nine-swap cost snapshot on 20 August 2026, Garden quoted lowest on all nine and Chainflip highest, the gap widest on $100 swaps.
Bitcoin-native layer 2: Spark and Stacks run BTC as the network’s own asset rather than a company’s token — less counterparty concentration, thinner liquidity, fewer applications waiting. Botanix, often named in this category, announced a full wind-down on 9 June 2026.
What to check before you move anything
Check the token, not the ticker. WBTC on Starknet is a different token from WBTC on Ethereum, and cbBTC is three separate contracts across Ethereum, Base, and Solana.
Have gas on the destination. Arriving with a Bitcoin token and no ETH, SOL or STRK is the most common way a first attempt stalls.
Size to the destination’s liquidity, not to your balance. Caps exist on every route, and inside them the far side’s depth sets your slippage.
Assume the conversion is taxable. In most jurisdictions giving up BTC for a token is a disposal, and coming back is a second one.
FAQ
Can I use Bitcoin in DeFi without wrapping it? Yes, in one case. Babylon’s staking locks native BTC in a timelock script on the Bitcoin chain, so the coins never leave and are never wrapped. Every other use case here needs a representation of Bitcoin on another chain.
Is wrapped Bitcoin the same as Bitcoin? No. It is a token on another chain representing BTC held elsewhere, and its risk is the issuer’s rather than Bitcoin’s. cbBTC is a claim on Coinbase, WBTC on BitGo, kBTC on Kraken.
What is the safest way to earn yield on Bitcoin? Native staking through Babylon has the fewest moving parts, because the BTC stays on Bitcoin under your own keys. Lending on Aave is more liquid and adds smart-contract and wrapped-token risk on top.
How much Bitcoin is actually in DeFi? About 91,000 BTC, or 0.46% of circulating supply, per Spark’s May 2026 research and Threshold’s July 2026 update — roughly 0.8% counting every wrapped variant and all Babylon staking.
Can I use Bitcoin in DeFi on Solana? Yes. cbBTC is the main Bitcoin representation on Solana, and Kamino is the largest money market there at around $3.2 billion in TVL, with Jupiter Lend second.
Is a bridge cheaper than an exchange? Often not, for common pairs. Exchanges usually win on BTC to USDC or BTC to ETH. Bridges win when the destination is a rollup the exchange does not support, which is most of them.
Why did Bitcoin DeFi shrink in 2026? Layer-two and sidechain TVL fell 74% in Q1 2026, and the broader ecosystem about 10%, from 101,721 BTC to 91,332. Threshold’s read is that capital rotated toward verifiable custody and a dependable route back to native BTC.
Do I have to sell my Bitcoin to trade perps? Effectively yes. The major perp venues, Hyperliquid included, margin in USDC rather than Bitcoin, so the conversion is unavoidable.
Bitcoin price extended its pullback toward $77,000 as rising oil prices, stubborn US inflation and higher Treasury yields reduced demand for risk assets. Technical charts now place BTC near a major weekly support level, while short-term momentum remains bearish. Bitcoin…
Rootstock co-founder Sergio Lerner has called for Bitcoin bridges to adopt mandatory withdrawal delays after about 4,000 BTC left Liquid Network’s federation wallet through an unauthorized peg-out. Sergio Lerner, chief scientist and co-founder of RootstockLabs, told crypto.news that immediate settlement…
Coinbase CEO Brian Armstrong has said that bitcoin’s bottom is in and reiterated that the coin will hit $400,000 by 2030.
Speaking on CNBC Thursday, the head of America’s biggest crypto exchange said that he was confident the long-awaited crypto Clarity Act would pass next week.
Bitcoin was trading sluggishly throughout June and July but started surging in August, spurred on by positive regulatory news. Over a 30-day period, the largest cryptocurrency is currently up over 20%.
JUST IN: Coinbase CEO Brian Armstrong tells CNBC the Bitcoin "bottom is in" and BTC hitting $400,000 by 2030 is a "reasonable target" pic.twitter.com/RYfipYCNDk
“[$400,000] is a reasonable target by 2030, and if you follow crypto, you know it typically goes through these four-year-ish cycles: there’ll be a run-up, some euphoria, there’ll be a down period,” Armstrong said.
“Most of the down periods last about a year, and we’ve actually just come across the one-year mark for this down period, so I personally believe that the bottom is in.”
Bitcoin was recently trading for close to $77,318 per coin. It hit a new all-time high of $126,080 in October.
Market observers have been paying attention to the long-awaited Clarity Act this year. The bill drafts a framework to formally divide oversight between regulators, distinguishing which digital assets are securities, commodities or stablecoins. The crypto industry has long called for such rules to be in place.
Senators will vote on the long-awaited legislation next week after an August delay.
U.S. President Trump helped spur a surge in the bitcoin price when he hosted crypto executives and traditional finance bigwigs at the White House and urged lawmakers to move forward with the bill.
Armstrong said on Thursday that he was confident the bill would get through — and help unlock new capital as a result.
“We saw with the Genius Act that passed last year for stablecoins: in the wake of that legislation passing, we saw well over 150 large companies integrate stablecoins within just a three-month period,” he said.
“And I think something similar could happen with the Clarity Act passing — it’s a regulatory checkbox, it’d be a big milestone certainly to unlock institutional capital and to bring things like tokenized equities and perks to the United States, which would be very good.”
Bitcoin price extended its decline below $78,000 on Sept. 10 as fading momentum, elevated Treasury yields and caution before U.S. inflation data kept buyers on the sidelines. Bitcoin price falls below $78,000 According to data from crypto.news, Bitcoin (BTC) price…
Brian Armstrong, Coinbase’s CEO, said Bitcoin reaching $400,000 by 2030 is a reasonable target, and described the $300,000-$400,000 range as very likely to be hit within that window, in a CNBC Squawk Box Asia segment. The call is Armstrong’s personal read on where Bitcoin’s price could land, not a formal Coinbase corporate forecast or a consensus market call.
Armstrong is the CEO of the largest U.S. crypto exchange, and his outlook carries weight because it’s grounded in policy developments he’s directly involved in shaping, not a spreadsheet model he’s publishing for Coinbase clients.
Coinbase CEO Brian Armstrong says Bitcoin could realistically reach $400,000 by 2030.
That would put BTC at nearly 5x its current level, reflecting his long-term conviction in institutional adoption and Bitcoin’s growing role in the global financial system. pic.twitter.com/AHn42RaKLB
In the clip, Armstrong walked through the CLARITY Act and what greater regulatory clarity could mean for the crypto industry as a whole, tying the legislation to the pace at which institutional capital moves into digital assets. He also said he believes the Bitcoin trade has already bottomed and expects upside as pressure continues to build in global bond markets.
That bond-market framing is the more interesting piece for traders parsing his logic. Armstrong is effectively arguing that stress in sovereign debt markets pushes capital toward scarce, non-sovereign assets, a thesis long-time Bitcoin holders have made for years.
Coinbase itself sits at the center of that flow, and Armstrong’s comments arrive as the exchange continues pushing regulators toward a clearer rulebook for digital assets, a topic covered in more detail in our look at how regulatory clarity could unlock institutional capital.
Neither the CNBC segment nor Armstrong’s remarks lay out a specific valuation model, a probability weighting, or a precise timeline for the bottom he says has already formed; the forecast is directional conviction.
The CLARITY Act has become shorthand in these conversations for the broader push to define how digital assets get regulated in the U.S. Armstrong’s decision to lead with it signals where he thinks the real re-rating catalyst sits.
JUST IN: Coinbase CEO Brian Armstrong says crypto wins no matter how the CLARITY Act vote turns out.
“If it passes, we get legislation,”
“If it doesn’t pass, the SEC and CFTC are ready to issue rules.”
His argument, as framed in the CNBC segment, links clearer rules directly to wider institutional adoption. The logic being that large allocators need defined jurisdiction and compliance guardrails before committing larger positions to Bitcoin meaningfully.
That’s a familiar setup for anyone who traded through prior Bitcoin price prediction cycles tied to ETF approvals: the asset doesn’t need the legislation to pass to rally, but sustained institutional flow tends to follow policy certainty rather than lead it.
Armstrong’s comments don’t reference a specific pending vote or implementation deadline, so traders shouldn’t treat passage of any legislation as imminent based on this interview alone. The more relevant variable in the near term is whether Bitcoin can confirm the bottom Armstrong referenced.
Bitcoin (BTC)
24h7d30d1yAll time
Until regulatory outcomes firm up, Armstrong’s $400,000 figure functions as a directional marker rather than a tradable price level, the kind of long-dated target that shapes positioning sentiment more than it dictates entries.
Whether it holds up depends less on Coinbase’s own roadmap and more on how quickly institutional capital and policy clarity actually materialize over the next several years.
Fintech veteran Wojciech Kaszycki has identified three tests for real bank adoption of Bitcoin: client custody balances, credit-funded spot trades and its use as loan collateral, following Standard Chartered’s launch of deliverable BTC and ETH trading for eligible UAE institutions.…
VerifiedX (verifiedx.io), the programmable financial operating system for Bitcoin and intelligent assets, today announced that its Foundation has launched a $15 million financing round and the first institutional investors have already invested. Initial capital will fund VerifiedX’s institutional Bitcoin distribution.
Cantor Fitzgerald is serving as VerifiedX’s investment banking partner in connection with the financing. The Foundation is not yet disclosing the identities or terms of the initial investors.
Part of the capital is allocated to expand custody relationships with partners including BitGo, the digital-asset custodian listed on the New York Stock Exchange, which will hold vBTC (VerifiedX’s Bitcoin-collateralized token) and vBTC.b (its counterpart on Base, Coinbase’s Ethereum layer-2 network). BitGo is a qualified custodian, meaning U.S. custody rules allow registered investment advisers to hold client assets there.
The capital also funds listings. Tier-one centralized exchanges will be listing vBTC and VFX, VerifiedX’s native token, with a first announcement expected within weeks. The round also supports borrow-and-lend programs: facilities that let a holder borrow against Bitcoin, or lend it out for a return, without sacrificing ownership or locking redemption rights.
“Nearly every way to put Bitcoin to work on-chain today asks the holder to swap it for someone else’s IOU. It’s the reason less than 1% of all Bitcoin held by institutions is earning any yield. vBTC is a game-changer in that regard, and this round funds the custody, exchange and lending rails that will allow institutions to use vBTC and natively turn their Bitcoin into productive financial capital,” said Brian May, a member of the VerifiedX Foundation.
With a wrapped Bitcoin token, the industry’s usual route, the holder hands Bitcoin to a custodian, or to a small group of signers acting together, and receives an off-chain representation on another network. The stand-in is only as good as whoever holds the Bitcoin behind it.
vBTC is built the other way around. When a holder creates a vBTC token, the VerifiedX network generates a unique native Bitcoin address inside each token and the holder deposits Bitcoin to their own self-custodial deposit address. The Bitcoin stays in that address, visible on Bitcoin’s own ledger and never leaves the Bitcoin ecosystem. Deposits and withdrawals are authorized by threshold signatures spread across VerifiedX’s validators, so no single party holds the key, and a holder that would rather not rely on the network’s validators can run its own and restrict signing to their own validators exclusively. The holder can redeem to native Bitcoin at any time. A holder can use vBTC for payments, trading, as collateral, in lending or in treasury. vBTC.b puts the same design on Base, so the asset can be used in applications there non-synthetically.
About VerifiedX
VerifiedX is a financial operating system for Bitcoin, intelligent, and alternative assets, enabling self-custodial ownership, instant settlement, programmable finance, native Bitcoin utility, and agentic financial infrastructure. Through products including vBTC, BFLY, and PulseXAI, VerifiedX connects institutions, users, and autonomous systems through a unified blockchain ecosystem framework.
Why Strategy can trade at a 19 percent discount and an 8 percent premium on the same day.
On 5 September 2026, the tracker BitcoinTreasuries.net showed Strategy, the world’s largest corporate holder of bitcoin, trading at 0.81x mNAV. The same page, on the same day, also showed it at 1.08x.¹
One number says the market values the company at a 19 percent discount to the bitcoin it owns. The other says the market values it at an 8 percent premium. Neither is a mistake. They are two of the three formulas in circulation, all wearing the same name.
Anyone trying to understand bitcoin treasury companies runs into mNAV within about five minutes and into the confusion above within about ten. What follows is an attempt to make the metric legible, including where to find the raw numbers so you never have to take a dashboard’s word for it.
What NAV is, and what mNAV is
Net asset value is a dollar amount. For a treasury company, it is roughly the value of the crypto it holds, plus cash, minus debt. A company with 1,000 bitcoin at $100,000 each and $20 million of debt has a NAV of $80 million.
mNAV is a ratio built on top of that idea. It divides what the market says the company is worth by what the company’s crypto is worth.
Notice the sleight of hand in that sentence. The denominator is the gross value of the crypto, not the net asset value just defined. Nothing is subtracted from it. Every argument in this piece is about the numerator, and the debt that a real NAV would net off has to be smuggled into the top of the fraction instead. Strategy says as much in its own glossary, which states that although the metric carries the label NAV, it is not net asset value in the traditional financial sense.²
The acronym also has two competing expansions. Bitcoin Magazine’s glossary entry, the most detailed explainer currently available, defines mNAV as “market net asset value” and presents it as a per-share dollar figure. Its page also discloses that the publisher is a subsidiary of a company that is itself a bitcoin treasury vehicle, which readers can weigh as they see fit.³ Strategy, Metaplanet, and every major tracker use “multiple of net asset value” and present it as a ratio.²If the number has a dollar sign in front of it, you are looking at the first kind. If it ends in an x, you are looking at the second. The rest of this piece uses the ratio.
The formula and a worked example.
The simplest version:
mNAV = market capitalization ÷ (coins held × spot price)
A company holds 1,000 bitcoin. Bitcoin is $100,000, so the crypto is worth $100 million. The company has 10 million shares trading at $12, so its market capitalization is $120 million.
mNAV = $120 million ÷ $100 million = 1.2x
Buyers are paying $1.20 for every dollar of bitcoin the company owns.
The number moves constantly, because both halves move independently. The stock reprices all day, and so does the coin. mNAV is a live figure, not a quarterly one.
Why there is more than one answer
Everyone agrees on the bottom half of the fraction. The argument is about the top half, and specifically about what counts as the company’s value. Three answers are in common circulation, and on 5 September 2026 Strategy had all three at once: 0.81x, 0.82x and 1.08x.¹
Basic mNAV uses market capitalization, meaning today’s share price multiplied by the shares that exist today. It answers a shareholder’s question. If I own the common stock, what am I paying for each dollar of the company’s bitcoin? Strategy’s basic figure of 0.81x says the common stock was priced 19 cents below every dollar of bitcoin behind it.
Fully diluted mNAV keeps the same idea but enlarges the share count to include shares that could exist. Employee options, warrants and convertible bonds all turn into stock under the right conditions, and each new share carves the same pile of bitcoin into thinner slices.
Strategy’s diluted figure of 0.82x sits almost on top of its basic figure, and the reason is worth spelling out. A convertible bond only becomes stock if the share price rises above an agreed level. Below that level, the conversion right is worthless, the bond stays a bond, and the company has to repay it in cash. Bonds in that state are described as out of the money. Most of Strategy’s convertibles were out of the money in September 2026, so the extra shares existed only on paper, and counting them barely moved the ratio.
Enterprise-value mNAV widens the numerator instead of the share count. It adds total debt and the value of preferred stock, then subtracts cash, which is the standard way of asking what the whole business costs rather than what one slice of it costs.
The choice of default matters because it changes what the public sees. BitcoinTreasuries.net, a widely cited public tracker of corporate bitcoin holdings, switched its default to enterprise value in June 2026. It defines the numerator as the market value of all share classes, plus total debt, plus the notional value of perpetual preferred shares, minus cash.¹ Metaplanet, the Tokyo-listed company that has followed Strategy’s playbook most closely, publishes a similar version on its own site: market capitalization plus total debt, divided by bitcoin NAV.⁴
Why 0.81x and 1.08x are both true
The gap between the equity-only figure and the enterprise-value figure comes down to who has a claim on the coins before shareholders do.
Scale the bitcoin down to $100 to make the arithmetic readable. Enterprise value counts everything, meaning the stock plus what the company owes minus the cash it holds, and at 1.08x, the market priced all of that at $108 against $100 of bitcoin. Basic mNAV counts only the stock, and at 0.81x the market priced the shares at $81.
Subtract one from the other, and the difference is $27. The $27 is what the company owes bondholders and preferred shareholders, net of its cash. Lenders sit ahead of shareholders in the queue, so $27 of every $100 of bitcoin is spoken for before common shareholders get anything, leaving $73.
The result is worth sitting with. The shares trade at $81 against a residual claim of roughly $73. The stock that looked like a 19 percent discount to bitcoin is, once the debt is counted, priced at about 1.11 times the bitcoin actually left for shareholders.
Two things cut the other way. Preferred stock enters the enterprise-value numerator at its notional amount, which is what it says on the certificate rather than what it trades for, so if the preferred changes hands below par, the real senior claim is smaller than $27. And shareholders own the operating software business, which sits in neither figure. The residual is therefore somewhat larger than $73, and how much larger is exactly the question mNAV is not built to answer.
So which one should you use?
The choice depends on what you are asking, and the most useful information is in the gap between them rather than in either one.
Use enterprise value to judge the business. It asks what the market thinks the whole enterprise is worth against the coins it holds, without caring how the claims on it are divided. For comparing one treasury company to another, it is the fairer number, which is why the main public tracker adopted it as its default.
Use the basic or fully diluted figure to judge the stock, because it describes the thing you would actually be buying. Just do not read it alone. On its own, it flatters a heavily indebted company, as the $ 81-against-$73 example above shows.
Use the gap between the two to size the leverage. A company where the two figures nearly touch has little debt. A company where they are far apart has a lot, and the wider the gap, the more the shareholder’s outcome depends on what happens to the debt rather than on what happens to bitcoin.
Worth noticing what all of this implies. A treasury company with no debt, no preferred stock, and no options, warrants, or convertibles would have all three figures land on the same number. The whole argument exists only because these companies are leveraged, so the spread between the definitions is not really a flaw in the metric. It measures how much the company owes.
How far the definitions can drift
A single treasury stock can look like a bargain or a bubble depending on nothing but the share count in the denominator. DefiLlama, a crypto data aggregator that publishes three share-count lenses side by side rather than picking one, showed one such stock reading either 0.06x or 5.27x. Both were arithmetically correct.⁵
The disagreement is not confined to obscure stocks either. On 5 September 2026, two widely read trackers reported Metaplanet on the same day. BitcoinTreasuries.net had it at 0.60x. mnav.com had it at 1.21x.⁶ One of those figures says the market values the company at a steep discount to its bitcoin, and the other says it commands a healthy premium. The likely causes are different coin counts, different share counts, yen conversion and timing, and anyone quoting one figure without the other is presenting a choice as a fact.
Convertible debt is the sharpest disagreement of all, because it can land in either half of the fraction depending on who is calculating. Many trackers treat it as equity automatically and fold it into the share count. Greg Cipolaro is Global Head of Research at NYDIG, an institutional bitcoin financial services firm, which makes his objection notable because the criticism comes from inside the bitcoin industry rather than from a skeptic outside it. He argues the automatic treatment is wrong on both accounting and economic grounds, because a holder of an out-of-the-money convertible wants cash back, not shares.⁷
The practical rule: an mNAV figure means nothing without a method and a date attached.
When a company changes the definition mid-game
Everything above concerns disagreements between outside trackers. There is a second problem, and it is why you should be careful with any figure a treasury company publishes about itself. Strategy has redefined mNAV twice, and both times the new definition produced a higher number than the old one.
Strategy’s basic mNAV fell below 1.0x first. The company then moved to the enterprise-value definition, which folds debt and preferred stock into the numerator and therefore reports a larger figure, keeping its published mNAV above 1.0x for a while longer. Enterprise-value mNAV then crossed below 1.0x too, around late June 2026.⁸
On 23 July 2026, the company changed the formula again, this time to share price divided by net bitcoin per share. The new denominator strips out everything owed to senior claimants before counting the bitcoin:
bitcoin reserve                              ~ $55.6 billion
plus USD reserve                             ~  $3.2 billion
minus out-of-the-money convertible debt      ~  $6.8 billion
minus notional preferred stock               ~ $15.5 billion
= net reserve                                ~ $36.6 billion
The $22.3 billion of convertible debt and preferred is what Strategy calls its senior claims, the money that ranks ahead of common shareholders if the company is ever wound up. A smaller denominator produces a bigger ratio, so under the new formula Strategy’s mNAV read just above 1.0x, while outside trackers using the basic method still showed roughly 0.68x.⁹
Here is the awkward part, and it cuts against reading the change as pure spin. The new formula is the same calculation as the $ 81-against-$73 comparison earlier. Both put the share price over the bitcoin that survives the senior claims. The definition Strategy adopted to keep its number above 1.0x is also, arguably, the most honest of the three for a shareholder deciding what a share is worth. Whether the company arrived at it for that reason or for the number it produced is not something the filings can settle.
The same notional problem applies here too, and Strategy’s flagship preferred series was trading below its $100 par at the time, so the deduction is larger than the market’s own view of that claim.¹⁰ Strategy’s own glossary also states that figures published before and after 23 July 2026 are not comparable, so every mNAV the company put out before that date sits on a different basis from the one on its website today.² A company-published mNAV and a tracker-published mNAV are not the same measurement and should never be plotted on the same chart.
Why a premium existed at all
Strategy and Metaplanet both trade at a discount today, but for most of the last three years they did not. Understanding why the premium existed is the fastest route to understanding why it went away.
If you can buy a spot bitcoin ETF, paying $1.50 for a dollar of someone else’s bitcoin needs a reason. Four have been offered.
Reason one: above 1.0x, the premium pays for itself
A company trading above 1.0x can sell new shares, spend the proceeds on coins, and leave every existing shareholder with more bitcoin per share than they started with.
What matters here is that the mechanism is circular. The premium is worth something because it can be converted into bitcoin per share, and only for as long as the premium lasts. A rising price justifies the issuance, and the issuance justifies the price, on the way up and on the way down alike.
Reason two: the equity is a leveraged claim
An ETF holds one dollar of bitcoin for every dollar you put in. A treasury company borrows, so it holds more.
Say a company raises $1,000 from shareholders, borrows another $500, and spends all $1,500 on bitcoin. Your $1,000 is now backing $1,500 of coins.
If bitcoin doubles, the pile is worth $3,000. The company repays the $500 it borrowed, and $2,500 is left for shareholders. You turned $1,000 into $2,500 while the ETF holder turned $1,000 into $2,000.
The same arithmetic runs the other way. If bitcoin halves, the pile is worth $750, the $500 loan still has to be repaid, and $250 is left. You lost 75 percent while the ETF holder lost 50 percent. Borrowed money magnifies both directions, which is the entire trade.
The borrowing was also unusually cheap. Treasury companies raised most of it through convertible bonds, which lenders can swap for shares instead of taking cash back if the price climbs above an agreed level. The swap right is worth more the more the stock jumps around, and Treasury stocks jump around a great deal, so some of these bonds were issued at zero interest. Shareholders got the leverage without paying a coupon for it.
Leverage does not create a premium by itself. In the example above, the market capitalization is $1,000, and the gross bitcoin is $1,500, so the basic mNAV on day one is 0.67x. Borrowing raises the denominator without raising the numerator, so leverage mechanically pushes the basic figure down, which is the same effect visible in Strategy’s $81 against $108. What leverage justifies is paying more than a dollar for each dollar of the residual claim. It cannot on its own explain a market capitalization above the gross value of the coins, which is what a premium means.
Reason three: access
Plenty of money is not allowed to touch crypto directly. Pension mandates, index funds, and various institutional rules block it.
A treasury company is an ordinary listed stock, so it slips past those rules. Once it joins a major index, funds that track the index have to buy it whether they wanted crypto exposure or not.
Analysts at JPMorgan made the same point about smaller investors, noting that Strategy shares offered bitcoin exposure to people who were barred from buying spot bitcoin ETFs.¹¹A premium is what you pay for a door that is otherwise closed to you.
Reason four: products built on top of the stock
Once a stock is popular and volatile, other funds get built on top of it. Several exchange-traded funds exist for no purpose other than to deliver twice the daily move of Strategy’s share price, and to do that they have to own the stock. Every dollar that goes into one of those funds becomes a dollar buying Strategy shares.
The amounts are not small. Analysts at JPMorgan found that those funds took in $3.4 billion in November 2024 alone, and credited them with much of the near 60 percent rise in Strategy’s share price that month.¹¹ A higher share price let Strategy sell new stock on better terms and buy more bitcoin with the money. Demand for the funds fed the company, and the company’s buying fed the story that made the funds popular in the first place.
All four reasons can go away.
The flywheel stalls below 1.0x. Lenders can stop offering cheap terms. Index providers can drop the stock. Funds can shrink as fast as they grew. The premium lasted exactly as long as the reasons behind it did.
Why below 1.0x is the number that matters
Above 1.0x, selling shares to buy coins makes every existing shareholder richer in coin terms. Below 1.0x, the same action makes them poorer.
To see it, take a company simple enough that the numbers stay clean. It holds 1,000 bitcoin, has no debt, and has 1,000 shares. Each share therefore backs exactly 1 bitcoin. With bitcoin at $100,000, each share is worth $100,000.
Now the company sells 100 new shares and spends everything it raises on bitcoin. The only difference between the two cases below is the price the shares fetch.
At 1.5x mNAV, the market values each share at $150,000, even though only $100,000 of bitcoin sits behind it.
sell 100 shares at $150,000   =  $15,000,000 raised
buy bitcoin at $100,000       =  150 bitcoin

bitcoin held    1,000  →  1,150
shares          1,000  →  1,100
per share       1.000  →  1.045     +4.5%
At 0.8x mNAV, the market values each share at $80,000, against the same $100,000 of bitcoin behind it.
sell 100 shares at $80,000    =  $8,000,000 raised
buy bitcoin at $100,000       =  80 bitcoin

bitcoin held    1,000  →  1,080
shares          1,000  →  1,100
per share       1.000  →  0.982     -1.8%
Same company, same action, opposite result for the people who already owned it.
The reason is in the second case. Each new share entitles its buyer to roughly a bitcoin’s worth of the company, but the cash it brings in only buys 0.8 of a bitcoin. The missing 0.2 has to come from somewhere, and it comes out of the shares that already existed.
Nothing about 1.0x is arbitrary. It is simply the point where the cash a new share raises buys exactly the bitcoin that share is entitled to, and the whole curve pivots around it.
The knock-on effects are what actually hurt. The growth story stops, because bitcoin per share can no longer rise through issuance. Interest payments and preferred dividends still come due in cash regardless. And the rational move flips from buying coins to buying back stock, which consumes cash that would otherwise buy coins.
Both major treasury companies have said as much in writing. Strategy filed its capital allocation policy with the SEC in August 2025, and it reads as a straightforward map of what the company does at each level of the metric. Above 4.0x, it actively issues stock to buy bitcoin. Between 2.5x and 4.0x, it does so opportunistically. Below 2.5x it issues stock only tactically, to cover debt interest and preferred dividends. Below 1.0x, it says it will consider issuing credit to buy back its own shares.¹²
Metaplanet followed the same logic in practice, announcing a repurchase of up to 150 million shares, about 13 percent of shares outstanding, backed by a $500 million credit facility, explicitly to address its declining mNAV.¹³
How to check the numbers yourself
Every input is public.
Coin holdings come from company filings. Strategy files a Form 8-K roughly weekly, the filing type used for events rather than fixed reporting dates, stating exact holdings, purchase price, and shares sold under its at-the-market program. The filing covering the week to 19 July 2026 reported no purchases and holdings of 843,775 bitcoin at an aggregate purchase price of $63.69 billion.¹⁴ All of it is free through SEC EDGAR full-text search. Metaplanet discloses this through the Tokyo Stock Exchange and its own site.
Worth pausing on those two figures together. The same 843,775 coins were worth about $55.6 billion four days later, against $63.69 billion paid for them. The company was roughly 13 percent underwater on its bitcoin, which helps explain why the discount has been so stubborn.
Share count comes from the cover page of the most recent quarterly or annual report, the 10-Q and the 10-K, both of which state shares outstanding as of a specific date on the first page. Reaching a fully diluted figure means going further in, to the convertible notes footnote, for conversion prices and share counts. Debt, preferred stock, and cash come from the balance sheet in the same filing, with preferred face values also repeated in the weekly 8-Ks. Spot price and market capitalization come from anywhere live.
For company-published figures, Strategy maintains a dashboard at strategy.com showing mNAV, net bitcoin per share, bitcoin yield, and its full debt and preferred stack, with definitions under a Notes section.¹⁵ Worth knowing: Strategy formally designated that dashboard as an official disclosure channel in its SEC filings, so its self-defined mNAV carries regulatory weight while remaining a number the company itself defines.¹⁶
One honest limitation applies to everyone, including the trackers. Filings are point-in-time, and markets are not, so any hand-calculated mNAV uses last quarter’s share count against today’s price.
What the metric does not tell you
mNAV values the coins and ignores everything else. Strategy still runs an enterprise software business. Bitcoin miners own physical infrastructure worth real money. Cipolaro’s fuller critique is that the metric is, at best, misleading and, at worst, disingenuous, and that it should be replaced by an analysis that values the operating business separately.⁷ BitcoinTreasuries.net now removes mNAV entirely for miners and for companies where crypto is a secondary holding, because the comparison is not meaningful.¹
A discount is also not automatically a bargain. It can be the market pricing in refinancing risk, dividend obligations, or the simple fact that the accumulation engine has stopped. Galaxy Research, the research arm of the crypto financial services firm Galaxy Digital, warned in 2026 that mNAV-driven capital formation resembles the leveraged investment trusts of the 1920s closely enough to make the sector structurally fragile.¹⁷
There is a direct historical precedent, and it is the most useful thing in this article. The Grayscale Bitcoin Trust traded at a premium until February 2021, flipped to a discount, reached nearly 50 percent below the value of its own bitcoin in December 2022, and stayed at a discount for three years. The gap closed to zero only on 11 January 2024, when conversion to a spot ETF finally created a redemption mechanism.¹⁸
Treasury companies have no such mechanism. You cannot hand back your shares and receive bitcoin. Without a way to close the gap by arbitrage, a premium or a discount can persist for years.
How I am setting up for 10–20X returns on my portfolio this cycle
In the 2020/2021 cycle I invested heavily in BTC and ETH options on the Canadian ETF’s back when BTC was just coming out of its bear market blues, and BTC was roughly $29,000. Those options paid off over 10X returns, even while having been bought 2X off the bottom. As importantly, they involved zero altcoin specific risk, minimum counterparty risk (regulated ETF’s) and no trading and constant position management .. AND could be bought in my retirement account or tax free savings account.
I bought, I held about 2 years, and I sold at 10–12X the price. Original article written in July 2023 below:
I managed those returns despite buying the BTC and ETH options after Bitcoin had doubled from its bear market Bottom in Oct of 2022. Now, we are roughly 35% off the bottom (which I think is very likely THE bottom), and the opportunity is on par with the previous cycle.
How I am building my position:
I am not ready to divulge all the specifics just yet, as my strategy is likely to evolve as we near the end of the bear market. That said, here is the gist of it:
I have purchased 30% of my portfolio into spot BTC, ETH and SOL.
I maintain about 10% of my portfolio in Altcoins I have held through the bear, and newly acquired ones soon to be launched ($XBG, $PROPR, $JUP, $BORG mainly)
I have started to accumulate my options positions, in a careful measured manner as I still expect some volatitlity heading into the midterm US elections (could see a short term pullback in crypto)
I will deploy the remaining cash hard into BTCC.B and ETHH and bSOL long dated options (Mar 2029) in the even we get a pullback into the low 70s or high 60’s in Bitcoin.
I will not try to hit the exact bottom, or else I would simply be permanently sidelined for fear of missing it. DCA over the next 4–8 weeks.
In the event we do not get a pullback by mid Nov 2026, I will deploy in fully regardless.
Bullrun Targets:
I do believe Bitcoin will have a solid bull run, but also concede that dimishing returns are a mathematical reality.
BTC Targets:
Bear Case: $200K
Base Case: $250K
Bull Case: $300K
Outside Chance (5–10%) : $500K + , Fundamental structural change yields a massive BTC bull run where sovereign funds are acquiring BTC for national security as fiat money begins to overdose on debt.
ETH and SOL are more difficult to predict, particularly given the capital drain from AI stonks and Meme coins.
That said, I believe ETH has a shot at some redemption here as corporations and large entities gravitate towards L2 chain they can customize and control. I will refine these targets in the coming months as Robinhood chain and Solana play out their game of meme coin capture, and provide them by year-end in an update article.
Conclusion:
To be frank, the real talent at this point is to ignore all the noise on crypto X, and make a plan and stick to it. If you are like me, this big move up caught you somewhat off guard, and perhaps more sidelined that you would like. I have had a battle with the FOMO demons for weeks now, and winning that battle is what will set the stage for huge gains.
The timeline is far too bullish, and my expectation at this point is that we take a bit of a breather and pull back into the low 70K, or high 60K range BTC, at which point I will not try to time my entries but will buy hard in expectation of a big 2027 and 2028. Then sit back, stomach the volatilty, and cash in in a couple years while 90% of crypto X is trying to predict the hourly charts and missing the 300–400% gains on spot BTC (and 1000%–1500% on call options)
Good luck out there, and see you on the next one!
Sovereign Crypto (aka RickyBobby)
I release regular altcoin and crypto updates, subscribe for more info and to keep up to date!
Ref Codes and Deals:
Try a Trading Challenge and Trade up to $100K of Company Funds on PROPR.xyz.
I own or am accumulating the above mentioned tokens/investments.
Not financial advice.
I rebalance my portfolio occasionally and the above may change from time to time.
The Bull Run is Quietly Loading was originally published in Coinmonks on Medium, where people are continuing the conversation by highlighting and responding to this story.
Malone Lam, a 22-year-old Singaporean and recent Miami resident, pleaded guilty in a Washington, D.C. federal court to one count of participating in a RICO conspiracy tied to the theft and laundering of more than $245 million in Bitcoin and cryptocurrency. He faces a maximum sentence of 20 years, according to court proceedings before U.S. District Judge Colleen Kollar-Kotelly.
The case centers on an August 2024 theft of more than 4,100 Bitcoin from a Washington-area victim, executed not through a protocol exploit but through impersonation and credential theft.
Malone Lam, 22, a citizen of Singapore and recent resident of Miami, pleaded guilty today in connection with his role as ringleader of an international cybercrime conspiracy that used social engineering to steal and launder cryptocurrency valued at more than $245 million,… pic.twitter.com/R8Nnz9a7n6
According to prosecutors, two alleged co-conspirators posed as representatives of Google and the Gemini cryptocurrency exchange to manipulate the victim into granting access to his Google Drive and revealing security codes. That access allegedly let Lam siphon off the Bitcoin holdings in one move.
No wallet was cracked; no private key was brute-forced. The attackers simply talked their way past the human layer that sits in front of every custody setup.
Lam is one of 18 defendants charged in the case and the 11th to plead guilty. Prosecutors describe him as an organizer for a network of young men who ran a string of cryptocurrency scams starting in 2023.
From Bitcoin Laundering to a Month-Long Spending Spree
Authorities say Lam helped launder and convert the stolen cryptocurrency into cash, which then funded a fleet of more than 30 cars, including custom Porsches, Lamborghinis, and Ferraris, a $2 million watch, and rented mansions in Miami. Nightclub spending alone reportedly hit $569,000 in a single evening at one Los Angeles club.
BREAKING: Malone Lam is expected to plead guilty today in connection with one of the largest crypto thefts in U.S. history.
Prosecutors say Lam and his associates impersonated Google and Gemini representatives to socially engineer a victim and steal more than 4,100 BTC, later… pic.twitter.com/sno0sEe9xs
The run lasted a month before FBI agents arrested Lam in Miami. Per the indictment, an off-duty law enforcement officer had tipped him off that agents were en route, though the arrest went ahead regardless. In a recorded jailhouse call cited in the indictment, Lam told associates the outcome had exceeded even their own worst-case scenarios for what getting caught might look like.
The mismatch between the crime’s technical simplicity and its financial scale is the real story here. Social engineering doesn’t require exploiting Bitcoin’s underlying protocol. It requires exploiting the people and institutions standing between a holder and their keys. Google Drive access and a leaked security code did more damage here than any blockchain-level attack could.
Judge Kollar-Kotelly had not immediately scheduled Lam’s sentencing hearing at the time of the plea. He faces up to 20 years in prison on the single racketeering-conspiracy count, with the remaining defendants in the 18-person case still working through their own proceedings.
Bitcoin (BTC)
24h7d30d1yAll time
For traders and holders, the takeaway isn’t abstract: large balances sitting behind cloud-linked recovery methods, reused security codes, or support channels vulnerable to impersonation remain the softest target in the ecosystem.
Recovery of stolen funds, when it happens at all, typically comes through law enforcement asset forfeiture rather than any on-chain remedy, a process illustrated by past cases involving long-delayed Bitcoin recovery efforts tied to historic exchange failures.
The Lam case is a reminder that the weakest link in crypto security is rarely the cryptography.

 Login
Login
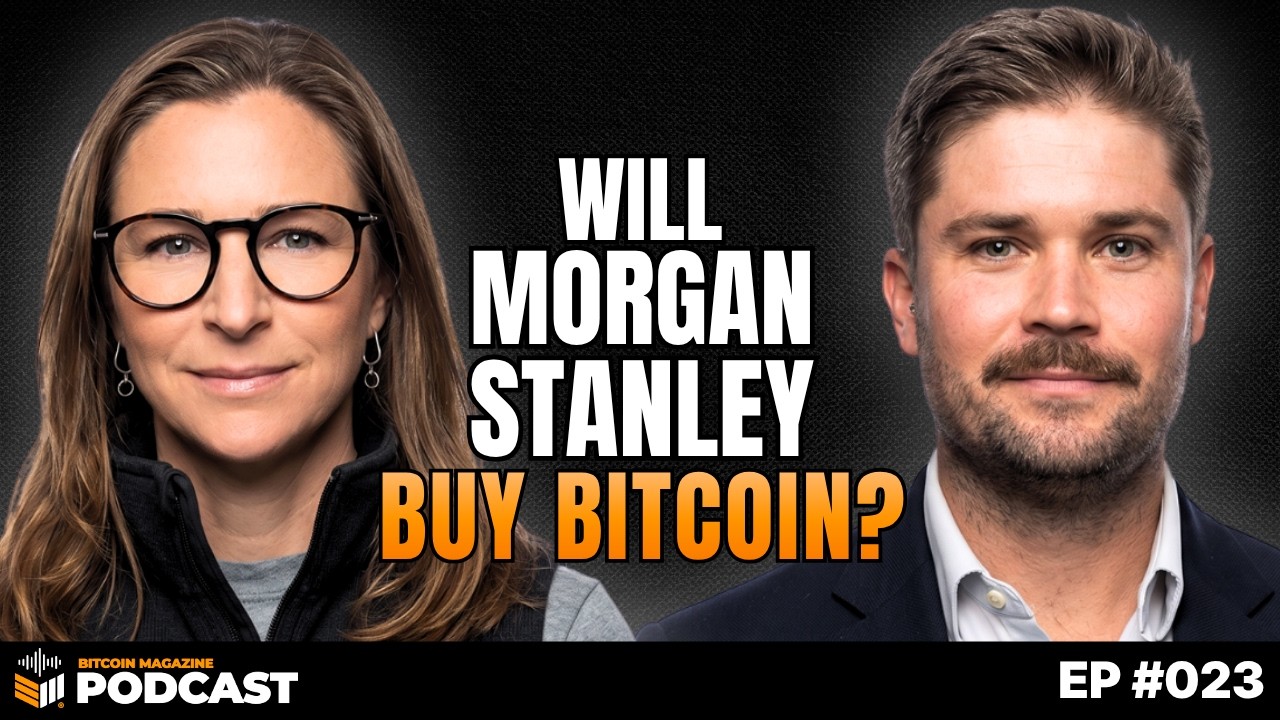
 Host: Spencer Nichols — Bitcoin Magazine










 JUST IN: Coinbase CEO Brian Armstrong says crypto wins no matter how the CLARITY Act vote turns out.