1,000 Museum Visitors Dive Into NASA Sea Level Science on World Ocean Day
Participants reach into an augmented reality sandbox, reshaping the terrain as projected contour lines and colors illustrate topographic features and elevation changes.
University of Georgia Marine Extension and Georgia Sea Grant
More than 1,000 visitors explored NASA sea level science firsthand during World Ocean Day at the University of Georgia Aquarium on Skidaway Island on June 6, 2026. The free event was supported by NASA’s Science Activation program through the Sea Level Education, Awareness, and Literacy (SEAL) project – a national effort that connects NASA sea level rise data with educators and coastal communities, particularly those historically underserved and already experiencing sea level impacts.
SEAL is a partnership between NASA and four NOAA Sea Grant programs working together to expand sea level rise understanding across U.S. coastal regions. By co-developing lesson plans, interactive activities, and place‑based learning experiences, SEAL helps educators engage learners with real NASA observations, models, and projections while strengthening community resilience to climate change.
During World Ocean Day, SEAL partners at Marine Extension and Georgia Sea Grant and the Coastal Equity and Resiliency Hub at Georgia Tech led hands‑on activities that brought sea level science to life. Visitors played the “Tumbling Tower” game, where removing blocks represents different community impacts from rising seas, and made “sea level friendship bracelets” that used colored glass beads to represent observed sea level rise along local coastlines.
The event also marked the debut of a new augmented reality sand box developed through SEAL. Guests shaped sand into coastal landscapes and watched NASA-informed sea level rise projections transform their creations in real time. Participants could experiment with resilience strategies, such as adding dunes or relocating homes, to see how adaptations might help communities prepare for future change.
Educators – formal, informal, home-based, and more – attending the event were able to take home four different SEAL lesson plans designed for both classrooms and informal learning settings. These materials help students explore sea level rise processes, modeling, variation, and impacts through NASA data and interactive STEM activities. SEAL aims to make all lesson plans developed through the project available online, but until then, please email Shannon Matzke to request digital copies.
“World Ocean Day is an annual tradition at the UGA Aquarium,” said Shannon Matzke, Marine Educator and Public Program Coordinator at UGA Marine Extension and Georgia Sea Grant. “With the support of NASA’s Science Activation program, this year’s event was free, which allowed us to reach more people and different audiences than we typically see. Incorporating SEAL activities made the day even more impactful for visitors – many of whom live in coastal communities already experiencing the effects of sea level rise.”
The SEAL project is supported by NASA cooperative agreement award number NNH21ZDA001N-SCIACT and is part of the NASA Science Activation Program portfolio, which connects learners with authentic NASA science experiences through partnerships with educators and community organizations.
Starstruck: NASA Research Shows How Sun’s Ancient History Shaped Earth
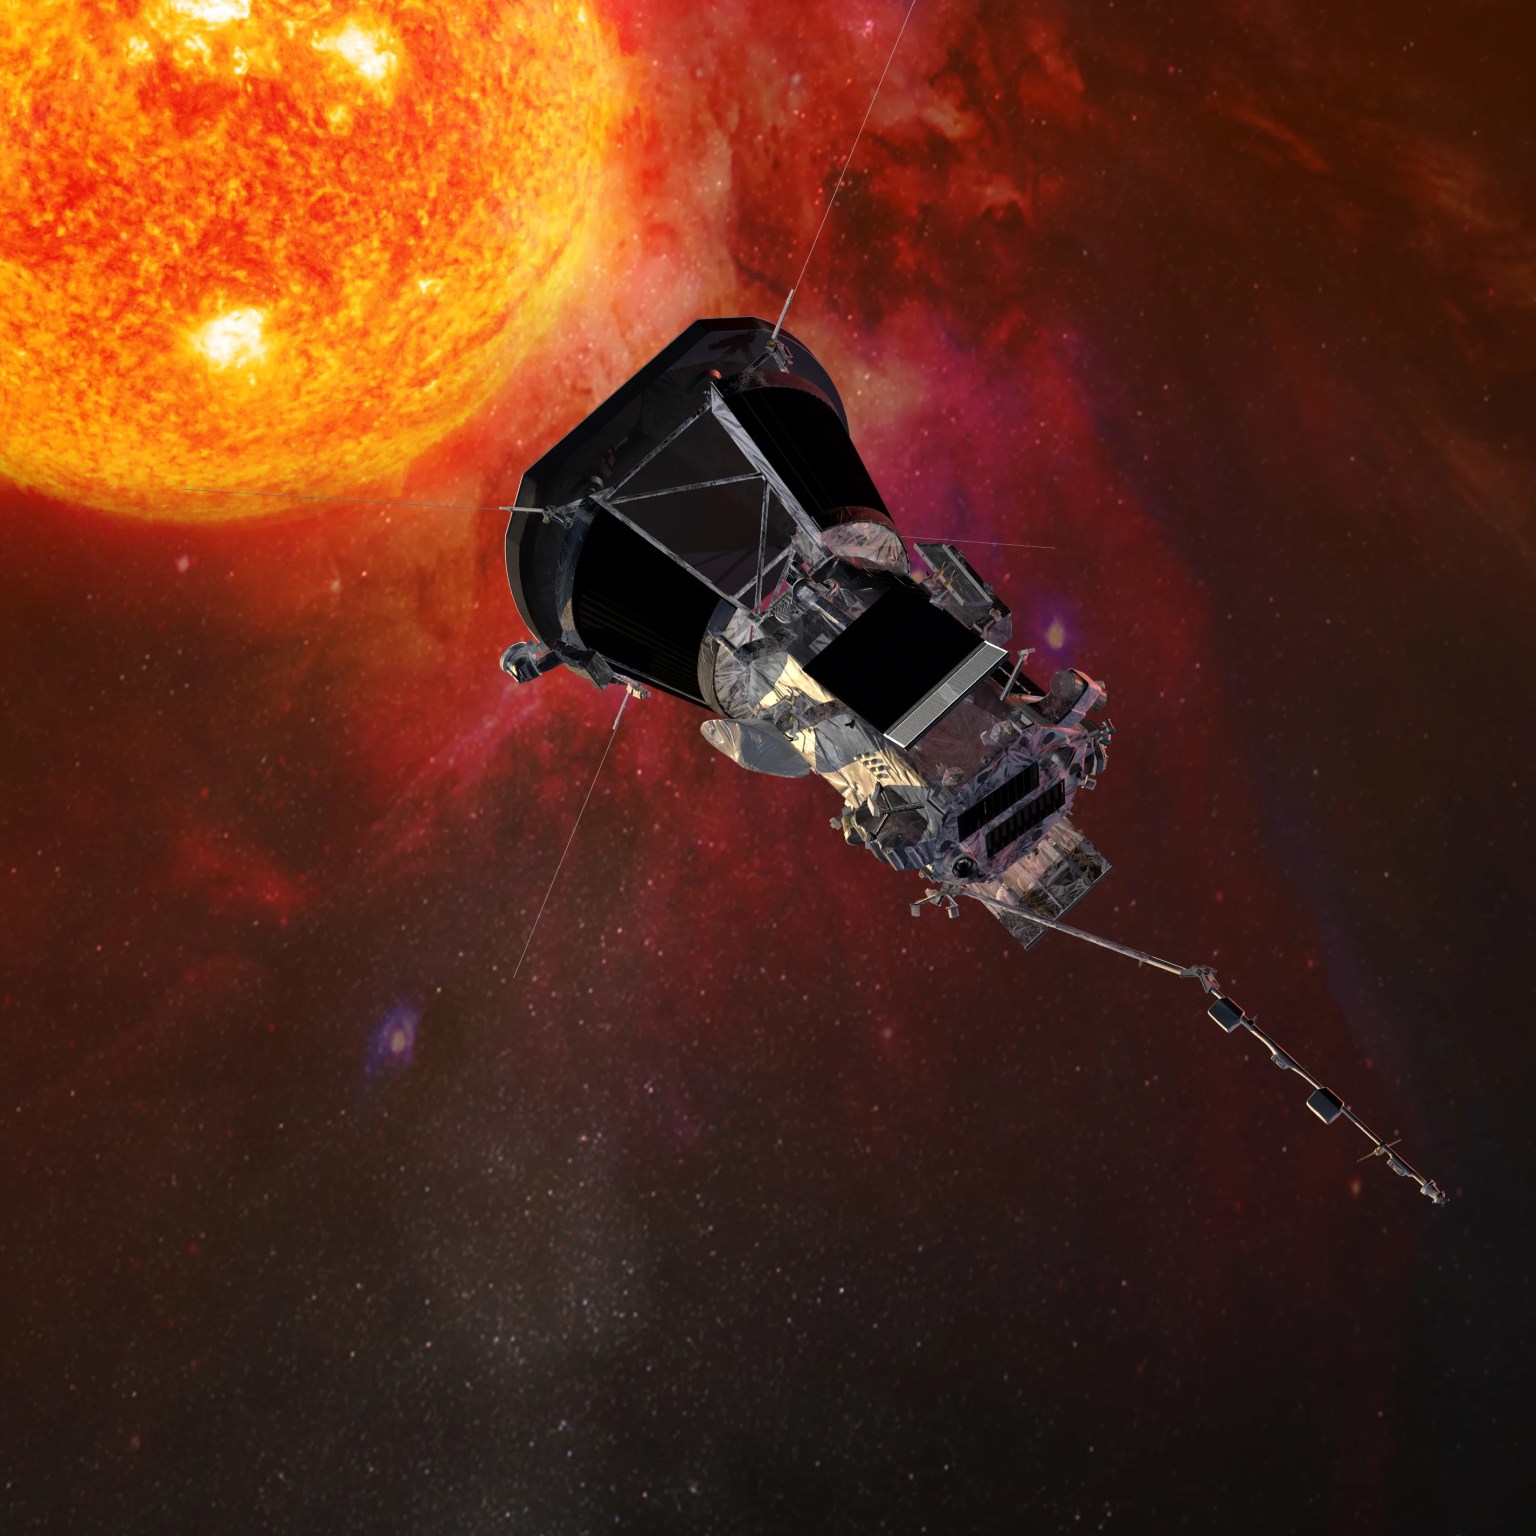
At the center of our solar system, the Sun influences every planet that orbits it. In two recent NASA-funded studies, scientists uncovered how ancient events in the Sun’s history may have helped create Earth’s unique climate and driven previously unexplained climatic shifts.
In new research, scientists at NASA’s SHIELD (Solar Wind with Hydrogen Ion charge Exchange and Large-Scale Dynamics) center — one of NASA’s DRIVE (Diversify, Realize, Integrate, Venture, Educate) Science Centers — trace the trajectory of the heliosphere, the massive bubble created by our Sun that envelops our solar system, as it moved through our galaxy and influenced Earth’s climate along the way. In another paper, a NASA scientist and coauthors investigate how the younger, dimmer Sun managed to heat Earth by seeding the production of potent greenhouse gases.
A Sun on the move
Over the last tens of millions of years, Earth’s climate has undergone significant shifts, including notable ice ages in which the global average temperature temporarily dropped by several degrees. During these periods, more frequent climate swings led Earth to warm and cool. To explain these periods of warming and cooling, scientists looked to factors internal to Earth, including orbital changes, greenhouse gases, and ice. But new research suggests changes to the Sun’s environment may be key to understanding Earth’s temperature swings.
Just as our planet is encased by an atmosphere, so our entire solar system is encased inside a kind of “atmosphere” created by the Sun. This protective bubble, known as the heliosphere, is formed by a continuous solar wind of charged particles streaming out from the Sun in all directions.
This conceptual animation begins with a view of the Milky Way Galaxy. As we zoom in, we travel to the Local Interstellar Cloud, and then to the heliosphere, the protective bubble that surrounds our solar system. The heliosphere is formed by a continuous stream of charged particles from the Sun, called the solar wind.
NASA’s Goddard Space Flight Center Conceptual Image Lab
Our heliosphere orbits around the center of our galaxy, the Milky Way. Throughout the Sun’s 4.6-billion-year existence, our heliosphere has traversed various regions within our galaxy. In a paper published on Aug. 21 in Annual Review of Astronomy and Astrophysics, researchers at NASA’s SHIELD used computer modeling to reverse-engineer the path of the heliosphere through our galaxy, revealing that the environments it passed through may have triggered changes on Earth.
Merav Opher, SHIELD’s principal investigator at Boston University, and her team ran simulations that showed the Sun has encountered frigid expanses of gas and dust at least three different times in the past few million years. In these instances, massive interstellar “cold clouds” pushed against the heliosphere to such an extent that it shrank to smaller than Earth’s orbit, stranding our planet outside the Sun’s protective shield.
These exposures — approximately 2 to 3 million years, 6 to 7 million years, and 13 to 14 million years ago — would have exposed Earth’s atmosphere to totally different surroundings. The simulation results match geologic evidence: Elements prevalent in interstellar dust appear in deep-sea sediment core samples, Antarctic snow, and lunar samples during these timelines.
This animated illustration shows Earth and the Sun protected by the heliosphere, the massive bubble created by our Sun. As our solar system traverses through the galaxy, encounters with massive interstellar “cold clouds” pushed against the heliosphere and caused the heliosphere to shrink past Earth, exposing the planet to cosmic radiation and elements from interstellar space.
NASA’s SHIELD DRIVE Science Center/Merav Opher/Harvard Radcliffe Institute
These heliosphere collapse events may also explain ancient climatic patterns on Earth. In the simulations, when Earth’s atmosphere was exposed to a cold, dense galactic hydrogen cloud, it increased water vapor content and shifted upper-atmospheric dynamics, ultimately altering the conditions at the surface. In summary, our heliosphere’s trips through colder regions in our galaxy may be a key factor in driving some of Earth’s ancient changes in climate, including possible ice ages.
Next frontier in studying heliophysics
The SHIELD center is one of several that NASA funds to unlock the next generation of heliospheric research. As a DRIVE Science Center, SHIELD builds a team of researchers with differing expertise, approaches, and opinions to develop a model, or “digital twin,” of the heliosphere that helps reveal how the heliosphere interacts with its surroundings, including dense interstellar clouds. Understanding our unique, habitable solar system will help unravel the mysteries of life’s evolution on Earth and potentially uncover other habitable star systems.
Young Sun
In another paper, Vladimir Airapetian, a scientist at NASA’s Goddard Space Flight Center in Greenbelt, Maryland, focuses on a long-standing mystery of how the ancient Sun warmed early Earth enough to sustain life. Three billion years ago, the young Sun was 70% as bright as it is today. Under these dimmer conditions, Earth should have been frozen solid. Yet geological evidence shows stable liquid water already existed long before that. This puzzle — a balmy Earth under a cooler, dimmer Sun — is known as the Faint Young Sun paradox.
One clue to resolving the paradox comes from young Sun-like stars elsewhere in the galaxy. These “toddler” stars are prone to throwing fits. Specifically, data from NASA’s retired Kepler space telescope shows that young Sun-like stars regularly erupt with massive superflares, flinging high-energy particles in all directions on a daily basis. If our young Sun was like these other stars, Airapetian proposes, the barrage of high-energy solar particles could have triggered chemical reactions that were key to warming early Earth.
Airapetian’s team simulated early Earth’s atmosphere in a sealed chamber, mixing molecular nitrogen, ammonia, carbon dioxide, and carbon monoxide. They then fired protons into the mixture, simulating the onslaught of particles from superflares. This proton bombardment triggered several changes including the production of nitrous oxide, a greenhouse gas 300 times more potent than carbon dioxide. The research was published in Astrophysical Journal Letters.
This nitrous oxide could help Earth hold onto heat. But not all the nitrous oxide would last. The young Sun’s intense ultraviolet radiation would break some of it down, splitting the molecule back into nitrogen and oxygen. But even if only 10% of the nitrous observed in the experiment survived, Airapetian’s team’s computer simulations confirmed, it would still warm Earth’s equatorial regions to about 41 degrees Fahrenheit (5 degrees Celsius), above water’s freezing point. This smaller amount of nitrous could even accelerate prebiotic synthesis: just-above-freezing temperatures have been found to be more efficient for building complex chains of amino acids than warmer temperatures.
Unearthing secrets of our star-planet system
Together, these two studies show that the Sun can lead to surprising implications for Earth. While our planet stands alone in many ways, it was formed and has always existed as part of a star-planet system. Understanding that unique relationship promises new insights about both Earth and the star that sustains it.
Preparations for Next Moonwalk Simulations Underway (and Underwater)
A busy street in Addis Ababa, Ethiopia’s capital, which is the subject of NASA-led air quality research.
Ninaras (CC BY-SA 4.0)
A NASA-funded air pollution monitoring network has provided one of the most detailed long-term views yet of the role of black carbon, or soot produced by fires, diesel vehicles, and other combustion sources, in Ethiopia’s capital, Addis Ababa. The detailed measurements show how pollution changes by time of day and season, including increases associated with rush-hour traffic and holiday celebrations. The findings are relevant to cities around the world, including in the United States.
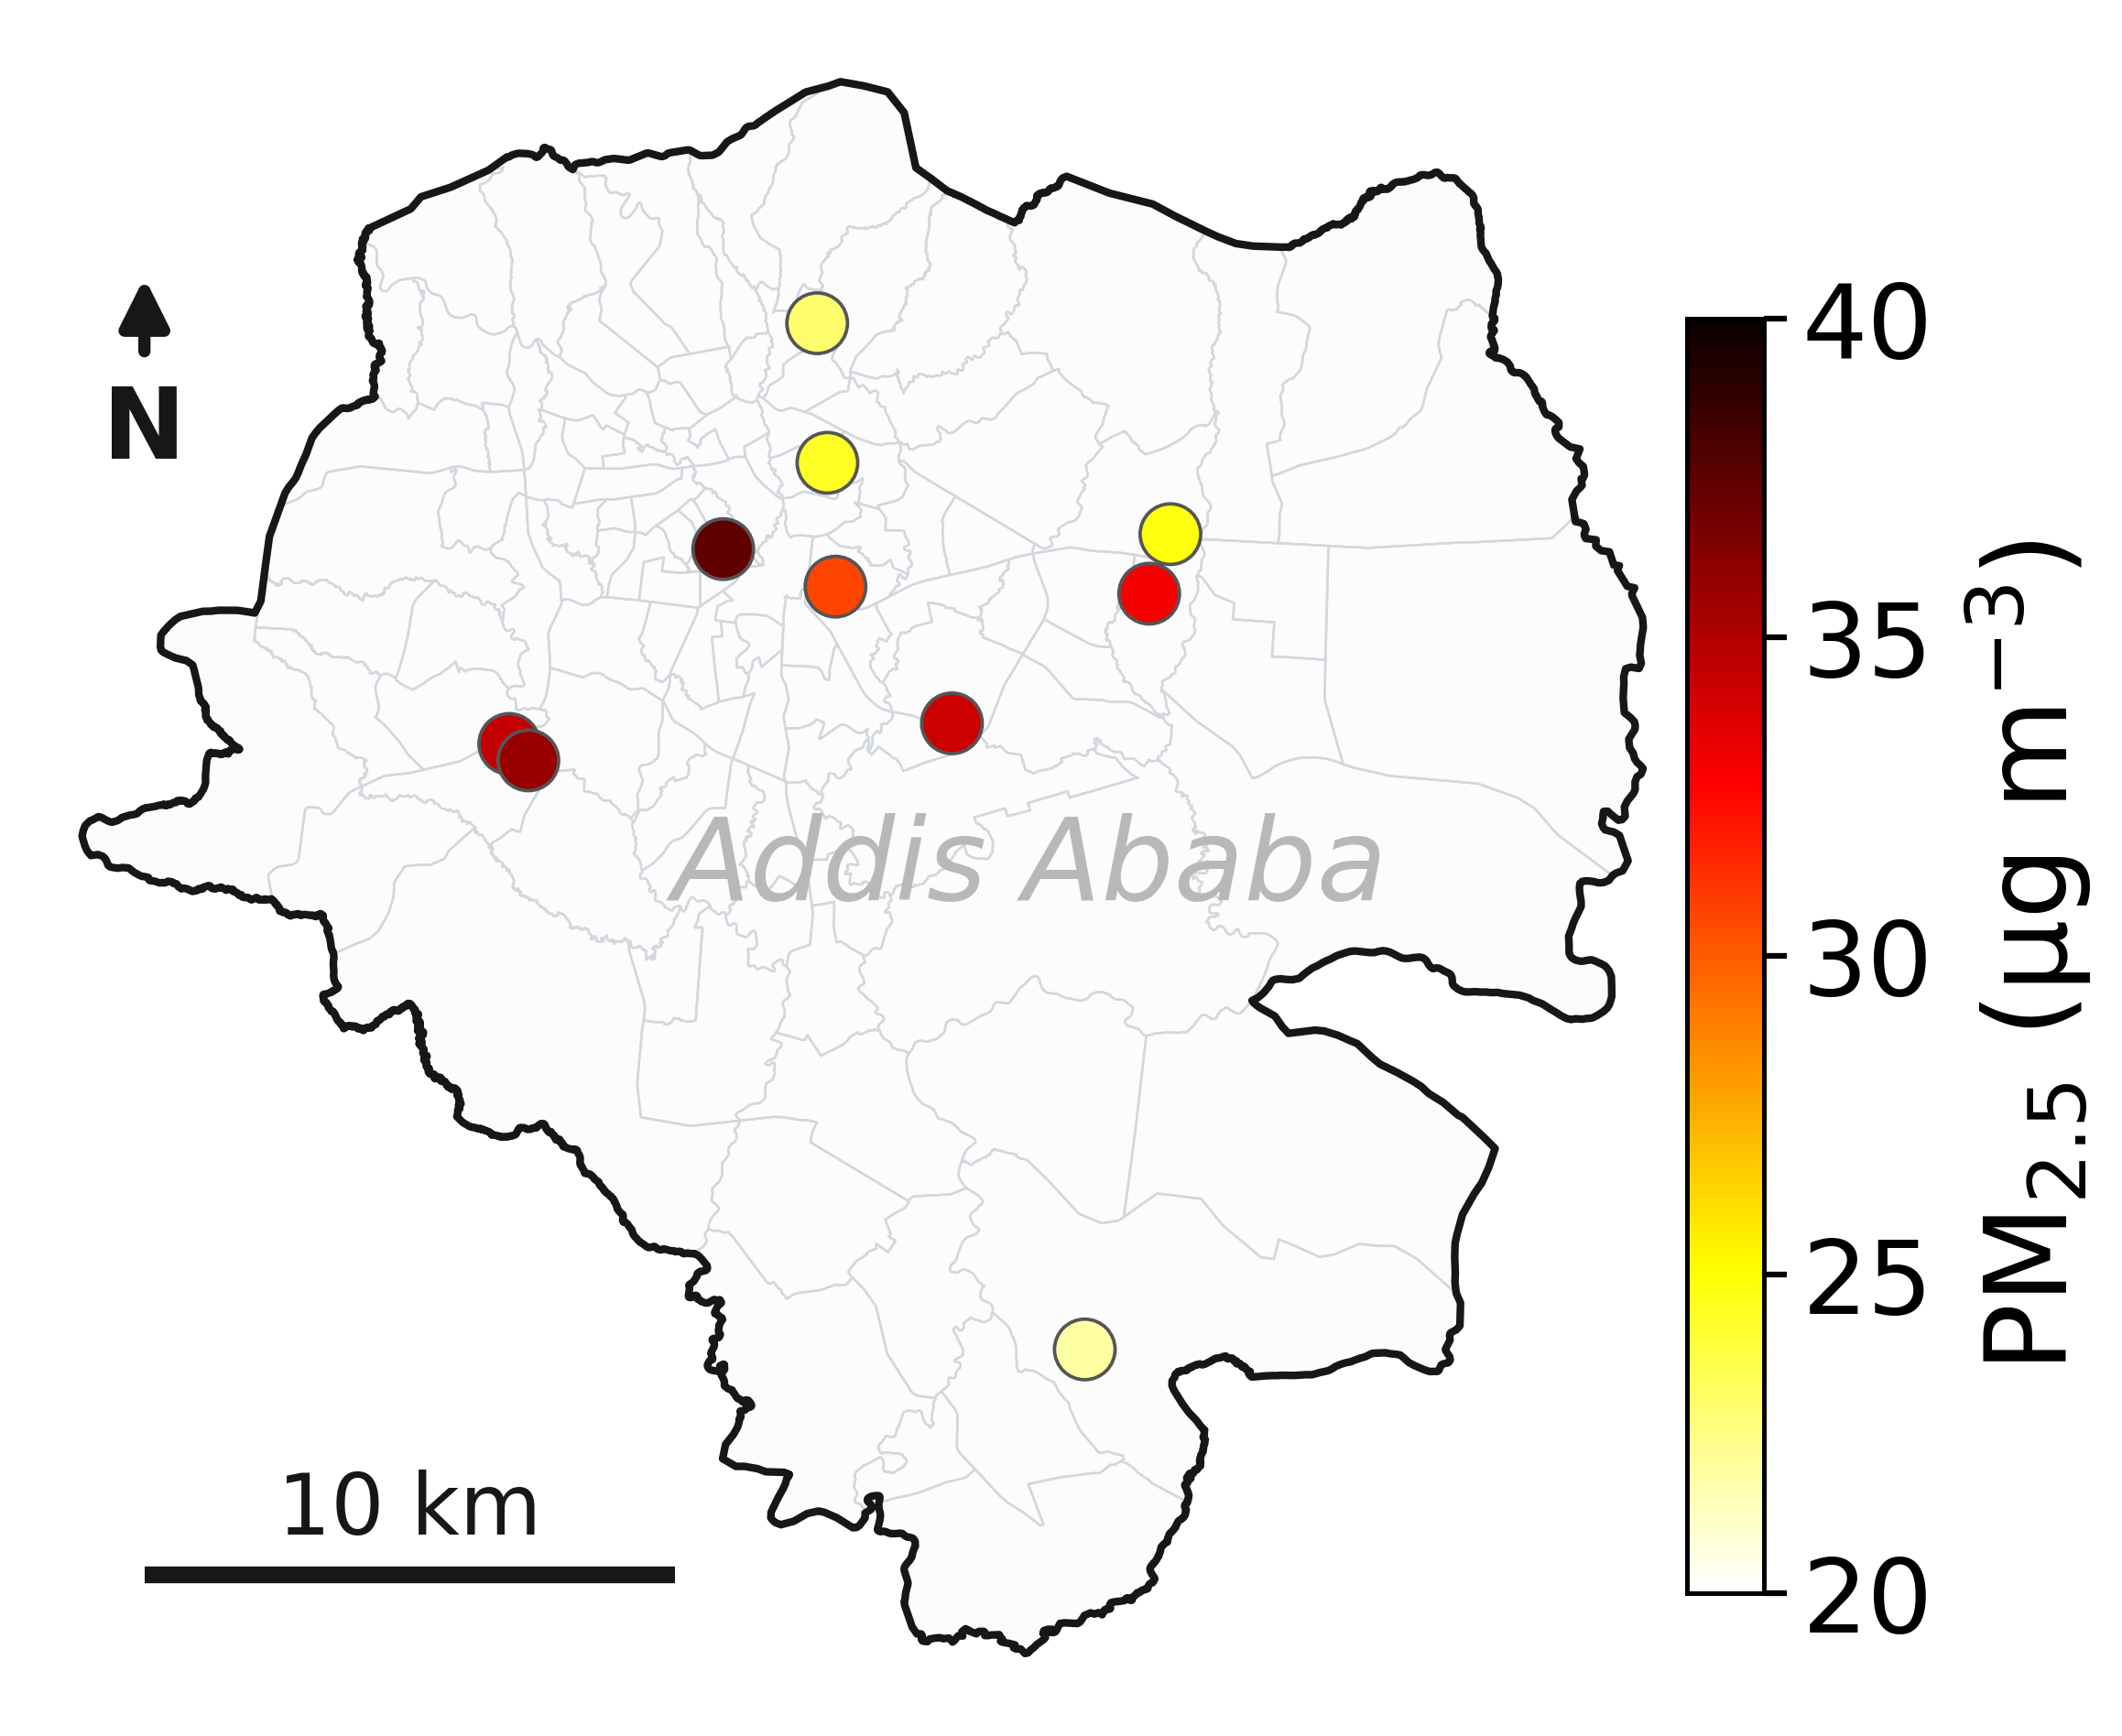
In a new paper published in ES&T: Air, scientists analyzed data collected throughout Addis Ababa between 2022 and 2025 from 10 air-quality monitoring sites deployed by NASA’s Multi-Angle Imager for Aerosols (MAIA) project.
The research comes as Ethiopia is taking steps aimed at improving air quality. In 2024, the country became the first in the world to ban the import of internal combustion engine vehicles, while cities have been adding bike lanes and electric vehicle infrastructure. The MAIA project’s measurements provide researchers with a baseline for understanding how air quality changes over time as Addis Ababa continues to grow and evolve.
The study focuses on particulate matter that is 2.5 micrometers or less in diameter, also known as PM2.5. The 2025 State of Global Air Report, cited in the paper, estimates that exposure to PM2.5 is associated with approximately 4.9 million deaths globally each year. Among the many kinds of PM2.5, black carbon has been has been studied for its potential effects on human health.
The paper found that Addis Ababa’s three-year average PM2.5 concentration was 30 micrograms per cubic meter, which is more than three times the level of the U.S. Environmental Protection Agency’s health-based annual PM2.5 standard. The new paper cites data from MAIA’s ground sensors indicating that average black carbon levels in Addis Ababa were approximately four to nine times higher than those measured in the three U.S. metropolitan areas the mission is monitoring.
This roof-mounted air sensor in Addis Ababa, the capital of Ethiopia, is one of 10 used by NASA’s MAIA mission to study the city’s air quality. MAIA’s air sensors provide a detailed look at PM2.5, one of the world’s deadliest forms of air pollution.
NASA/JPL-Caltech
“To our knowledge, this is the first long-term, multisite study of continuous PM2.5 and black carbon measurements in Ethiopia,” said Sina Hasheminassab, a coauthor of the paper and MAIA’s deputy principal investigator at NASA’s Jet Propulsion Laboratory in Southern California. “Many rapidly growing cities have limited long-term monitoring, so these measurements provide an important baseline for understanding how pollution changes across space and time.”
The composition and sources of PM2.5 can differ substantially between cities, depending on their local geography, traffic, industries, and more. Desert cities, for example, may have more dust, while those near coal-fired power plants may have higher concentrations of sulfate. Long-term surface measurements remain limited in many parts of the world.
NASA is supporting MAIA’s air pollution research in a dozen metropolitan areas around the globe, including three in the U.S.: Los Angeles, Atlanta, and Boston. The mission consists of a ground-based network of sensors already in operation as well as a space observatory, which uses a JPL-built camera that will be launched by the Italian Space Agency (ASI) on an ASI satellite no earlier than late 2027.
The camera is designed to identify different types of PM2.5 aerosols based on how they reflect light, making it possible to map particle concentrations over each city that the mission studies. Mounted on a gimbal, the camera captures data from multiple angles using JPL-pioneered technologies that make particles stand out more prominently against the surface background to provide valuable information about their shape and size.
The MAIA mission is the first NASA project to include public health researchers among a space mission’s team. These researchers will use MAIA’s PM2.5 concentration maps alongside health data to study potential relationships between different particle types and health outcomes. By developing a better understanding of particulate matter pollution, researchers can potentially advance how air quality is studied and managed.
“This paper shows how valuable the air sensor data is on its own, but combining the sensor network and satellite observations will be a game-changer,” said, Kyan Shlipak, the paper’s lead author, who worked on the research while interning at JPL.
Tracking black carbon
The greater Addis Ababa urban area is home to nearly 6 million people, and according to United Nations projections, that figure is expected to surpass 10 million by 2050.
This map of Addis Ababa, the capital of Ethiopia, shows the locations of 10 air sensors that NASA’s MAIA mission is using to provide one of the most detailed looks ever at the city’s air pollution.
NASA/JPL-Caltech
“It’s a cosmopolitan city with many international communities,” said Araya Asfaw of Addis Ababa University, a coauthor of the paper and the MAIA project’s lead Ethiopian collaborator. “Think of it as Africa’s version of Brussels, where the European Union is based.”
“Even at night, when traffic dies down, you see high emissions from the burning of charcoal and other fuels,” Asfaw said.
The MAIA sensor network detected increases in black carbon during two major holidays in Addis Ababa that involve bonfires and was able to distinguish between particles originating from the fires and those from fossil fuel combustion. The findings demonstrate how detailed measurements can help researchers identify different sources of particulate matter and better understand how air quality varies across a city and over time.
Next Generation of Planetary Scientists Learn Public Engagement Skills
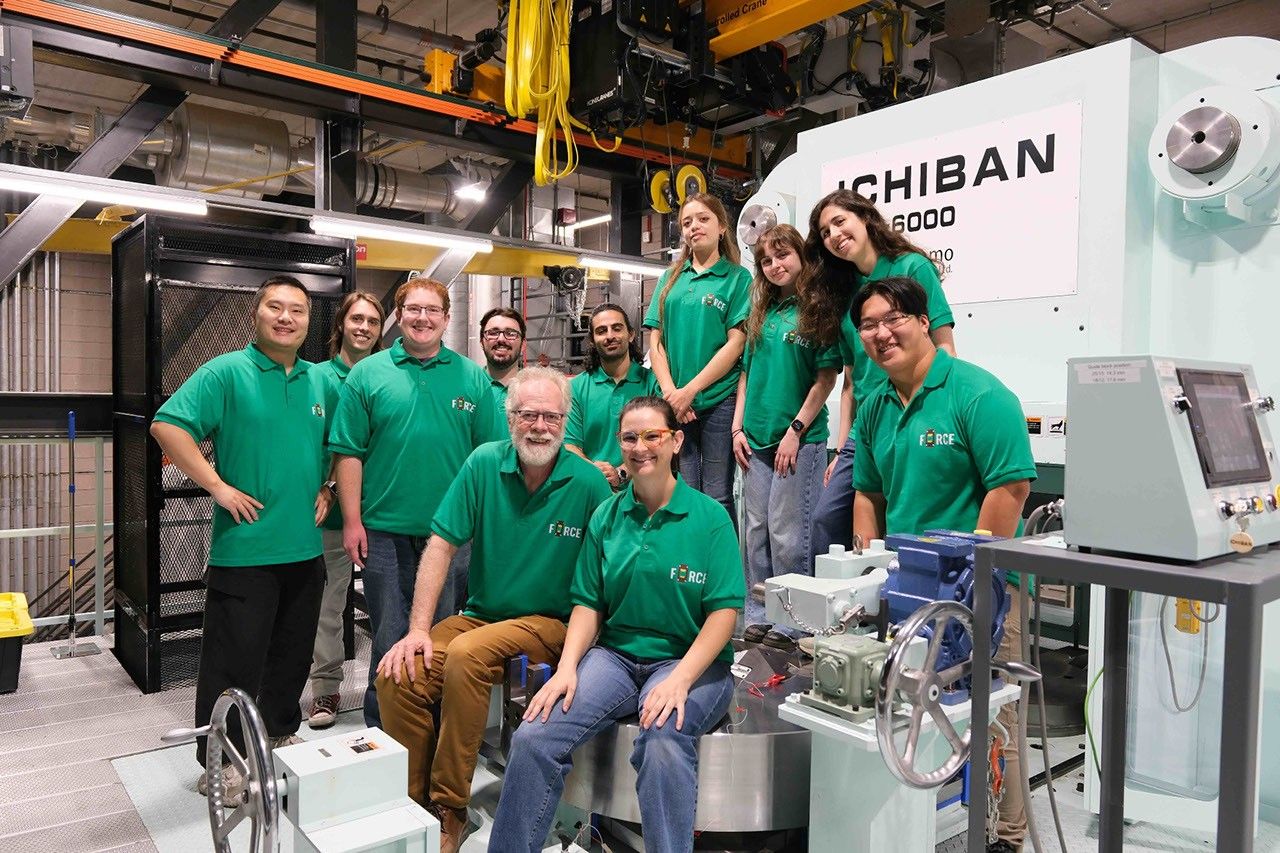
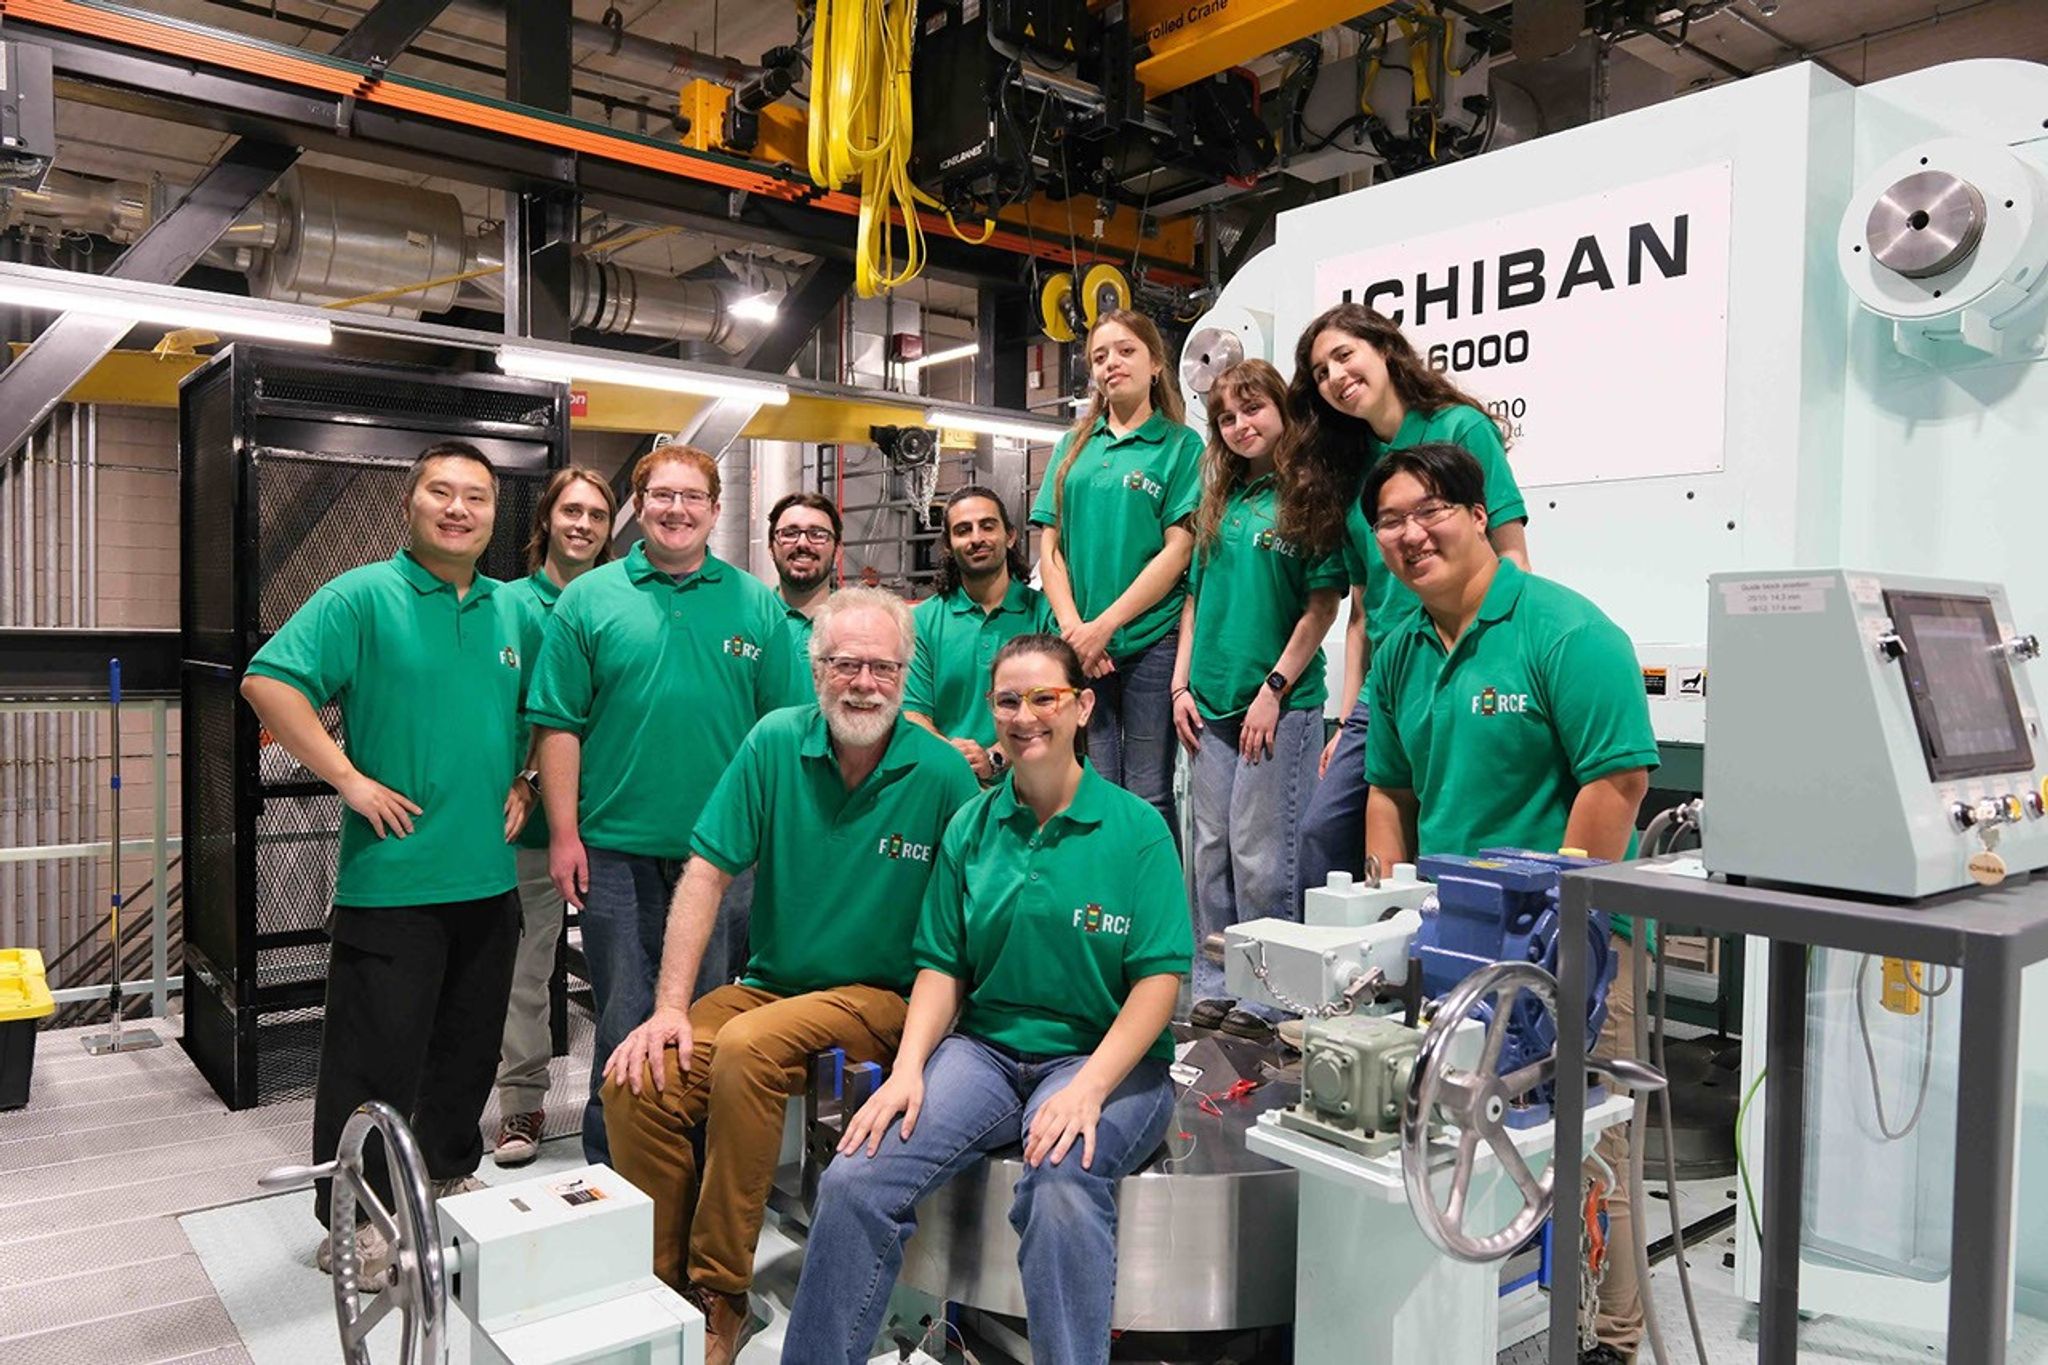
Group photo of undergraduate research interns and FORCE leaders standing together beside the high-pressure laboratory equipment.
The NASA Science Mission Directorate (SMD) Community of Practice for Education (SCoPE) – part of the NASA Science Activation (SciAct) Program portfolio – enables Earth and Space Science and Engineering Subject Matter Experts (SMEs) – especially NASA-funded SMEs – to efficiently and effectively share their science with support from SciAct education experts.
In Summer 2026, NASA SCoPE partnered with Arizona State University’s Facility for Open Research in a Compressed Environment (FORCE) Summer School to help seven undergraduate student interns build the science communication skills needed to share their research with a variety of audiences. FORCE is a world-class laboratory that uses high-pressure experimental equipment to recreate the extreme conditions found deep within Earth and other planetary bodies, enabling researchers to better understand how planets form, evolve, and behave under immense pressures.
As part of the Summer School, SCoPE facilitated two hands-on workshops on June 25 and 26, followed by office hours the following week, to help interns translate their technical research into compelling stories for non-expert audiences. The training focused on identifying the central themes of their work, developing clear and engaging messages, planning effective visitor interactions, and thinking through the logistics of public engagement. Interns also received guidance on preparing both their research posters and individual outreach stations.
The training culminated in two complementary outreach experiences. The first was the FORCE Open House, which welcomed approximately 50 members of the general public for an inside look at the laboratory. Visitors toured the facility, met the research team, explored the specialized equipment used to simulate the interiors of Earth and other planets, and interacted with interns at themed outreach stations designed to explain the science behind the experiments in accessible, engaging ways.
At the second event, a poster session for ASU faculty, staff, and students, the interns presented their research, providing an opportunity to discuss their scientific findings with members of the university community and receive feedback on their presentations.
By integrating science communication training into the Summer School experience, NASA SCoPE helped equip emerging planetary scientists with practical skills for engaging both scientific peers and public audiences. The poster session and Open House demonstrated how thoughtful communication training can strengthen researchers’ confidence while building stronger connections between cutting-edge planetary science and the communities it serves. NASA SCoPE is supported by NASA cooperative agreement award number 80NSSC21M0006 and helps enrich and enhance the impact of the NASA Science Activation Program portfolio, which connects learners with authentic NASA science experiences through partnerships with educators and community organizations.
Certain kinds of clouds are misbehaving – appearing more often and lower in the sky than they used to. To help identify the factors influencing these changes (e.g. shifts in Earth’s long-term weather patterns), scientists have asked people around the world with cameras to submit fresh images of these clouds as a part of the NASA-supported Space Cloud Watch project. Now, one volunteer has developed a new tool to help other Space Cloud Watch volunteers work more efficiently.
The misbehaving clouds are “noctilucent” or “night-shining” clouds (NLCs). These clouds scatter light from the Sun long after sunset and long before sunrise, giving them a silvery glow. But despite this glow, it can be hard to differentiate NLCs from lower-altitude look-alikes. That confusion has meant extra work for project leaders.
Volunteer Namai Chandra shared, “I noticed that NLC images were being manually verified by the project leaders. It felt like a task well-suited for a human-in-the-loop machine learning pipeline, one that could handle the repetitive screening automatically, while keeping human judgment central for the images that matter most.” In other words, Namai found a way to help observers verify when they are indeed seeing NLCs and when they’re not.
Namai reached out to the Space Cloud Watch scientists Drs. Chihoko Cullens and Brentha Thurairajah, who were delighted with his idea. Namai soon developed a machine learning pipeline, training it on a variety of cloud images, including both the NLCs and the lower altitude look-alikes that are often submitted to Space Cloud Watch. The pipeline combines image pre-screening, cloud classification, and confidence-based review routing. After several rounds of development, testing, and refinement, he released his NLC identification tool to the project. This tool is now being used by cloud contributors who are unsure whether they have observed NLCs, as well as project scientists that want to flag images for review.
Grab a camera and join the Space Cloud Watch project today! If you’ve hesitated to contribute to Space Cloud Watch because you were not certain if what you were seeing was a noctilucent cloud, you now have a way to check before you share – thanks to Namai.
Namai Chandra, Space Cloud Watch volunteer and creator of the Noctilucent Cloud Detector tool.
Photo by Surabhi Chandra.
Learn More and Get Involved
Space Cloud Watch
Photograph clouds just after sunset or before dawn to investigate our changing atmosphere.
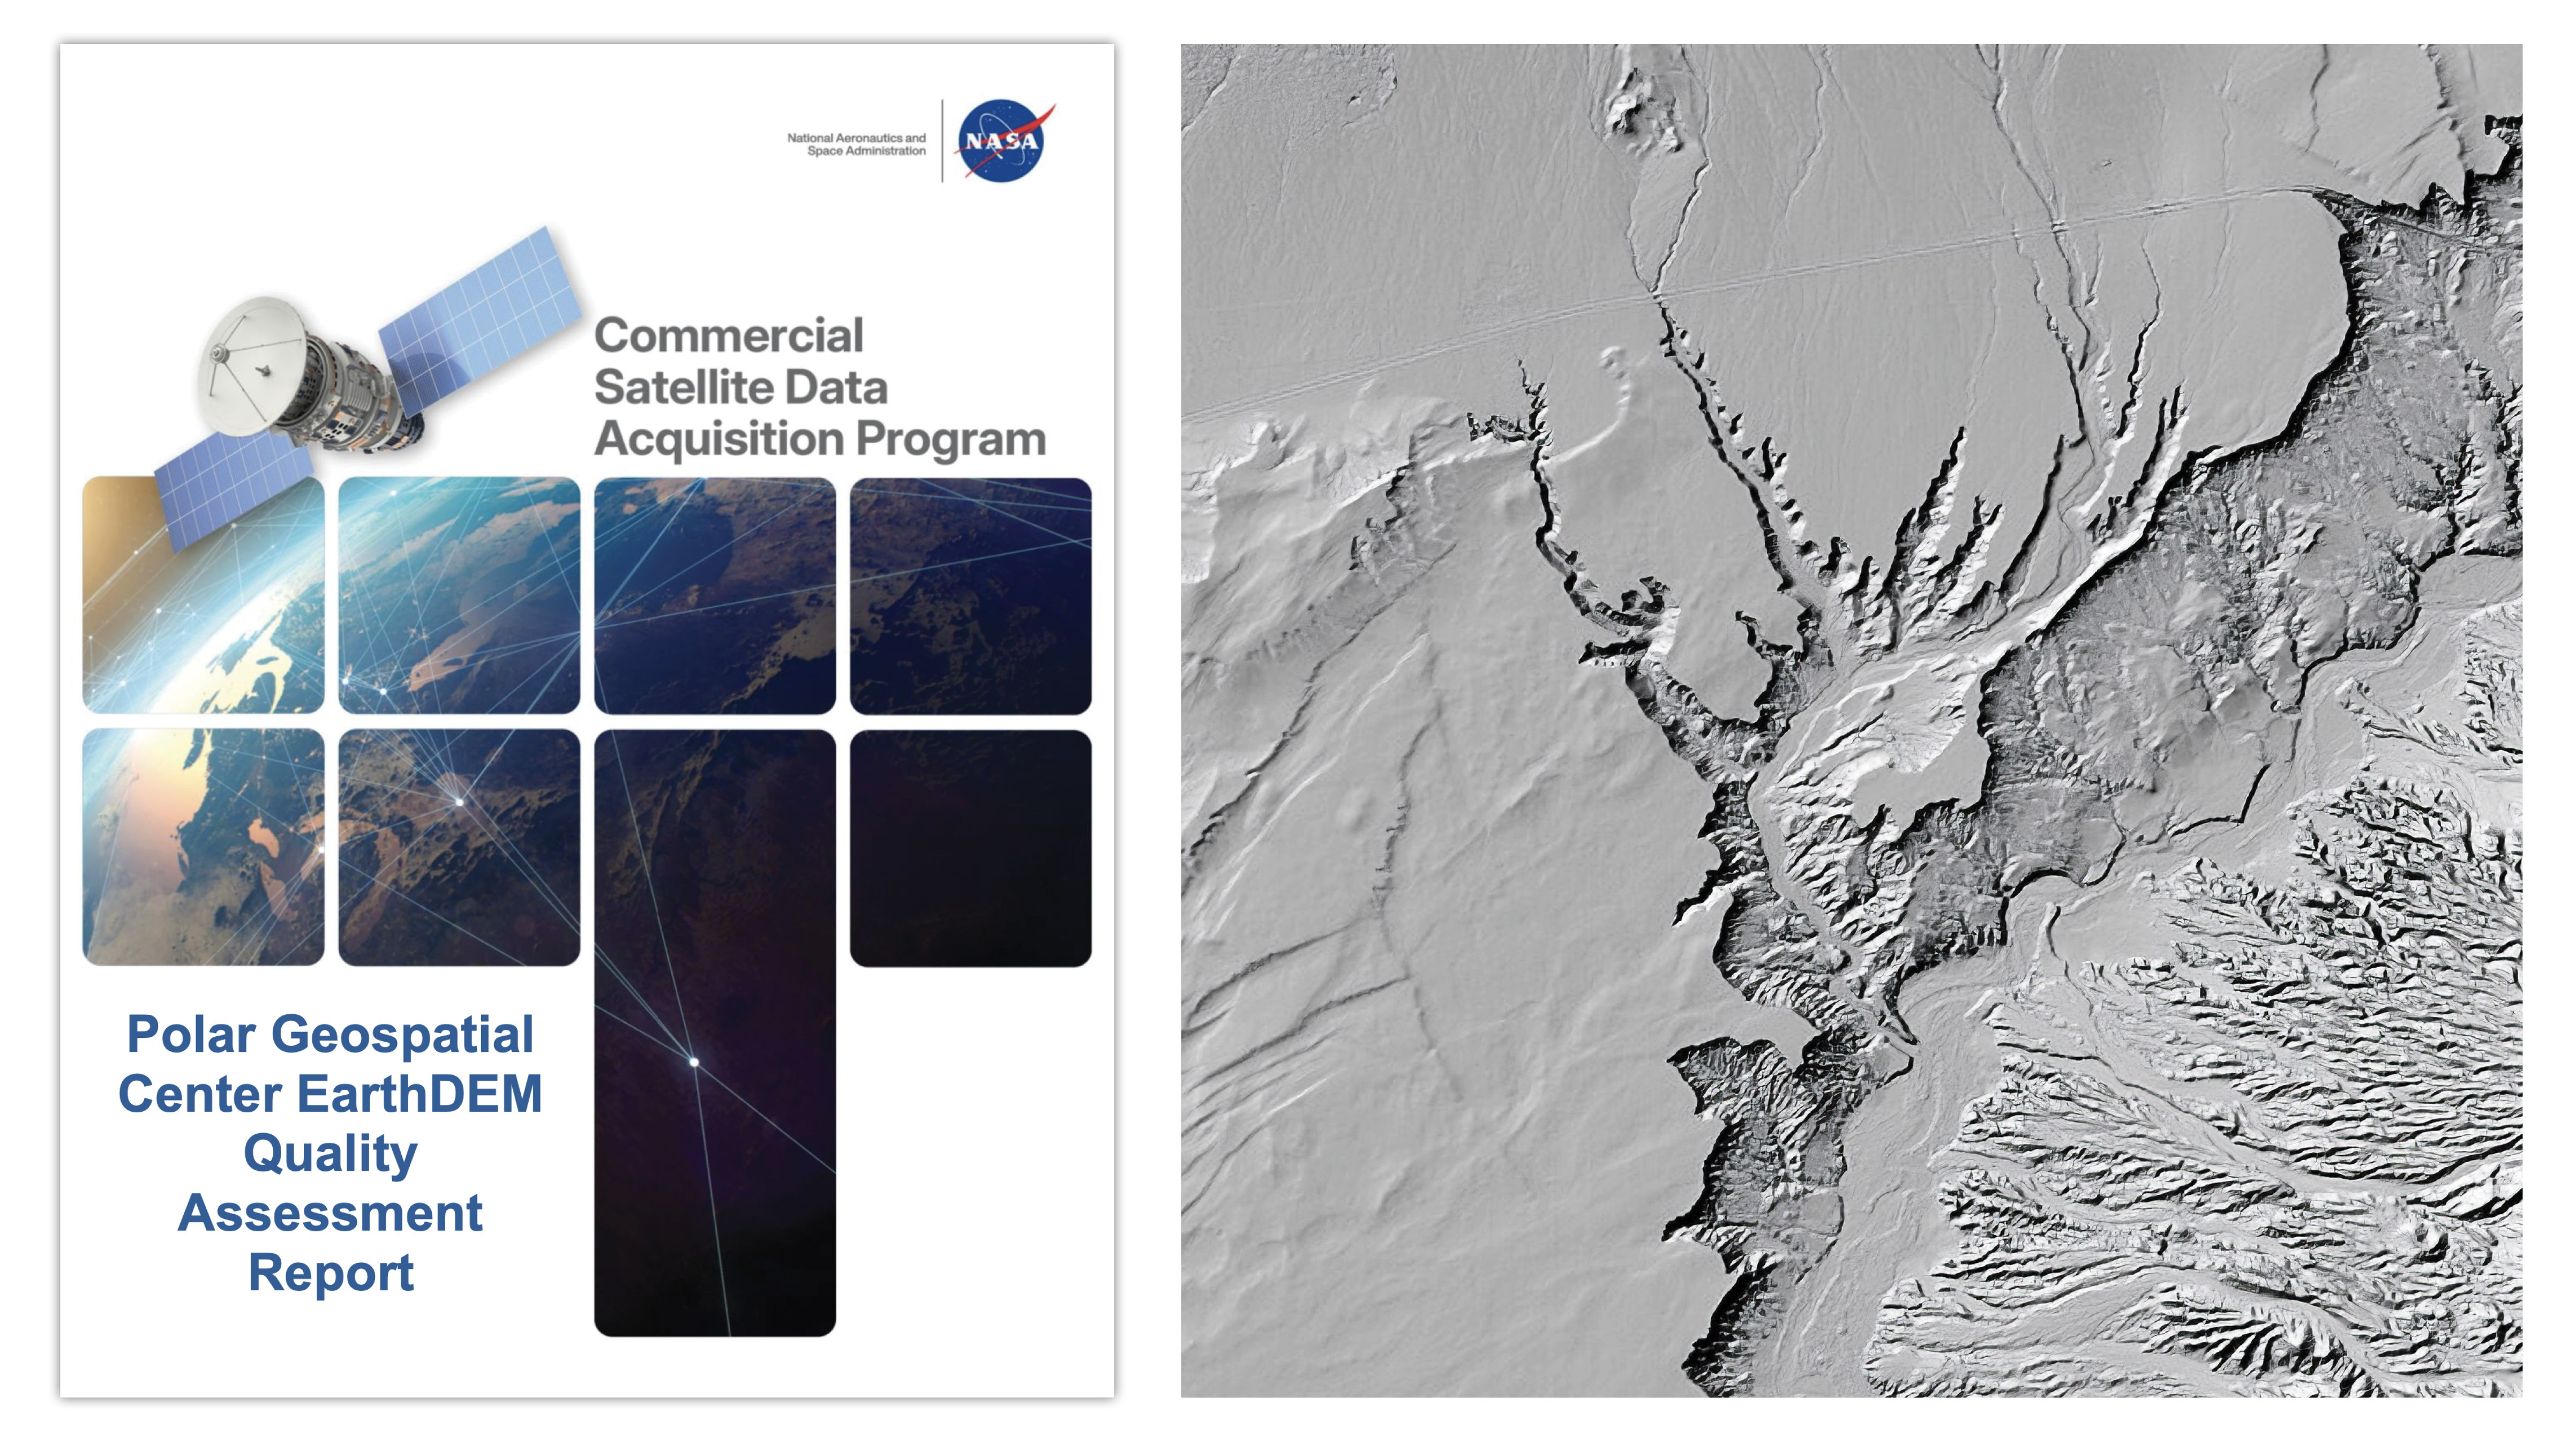
A new quality assessment report from NASA’s Commercial Satellite Data Acquisition (CSDA) program evaluates data from the Polar Geospatial Center’s (PGC) EarthDEM product. The results of the evaluation help inform NASA program management and the user community about the quality of commercial Digital Elevation Models (DEMs) for use in NASA science.
At left, the cover of the Commercial Satellite Data Acquisition programs’s recently released Polar Geospatial Center EarthDEM Quality Assessment Report. At right, a shaded relief rendering of EarthDEM data showing the Virgin River in Nevada. DEM derived from Vantor imagery.
Credit: NASA CSDA program/EarthDEM Project
Issued August 8, 2026, the CSDA Polar Geospatial Center EarthDEM Quality Assessment Report was conducted by NASA Digital Elevation Model (DEM) subject matter experts (SMEs) enlisted to evaluate the horizontal and vertical accuracy of two PGC EarthDEM1 (i.e., Digital Elevation Model) products: the center’s “Mosaic Tile” and “Strip” Digital Surface Models (DSMs).
To assess the vertical and horizontal accuracy of the EarthDEM Strip DSM and Mosaic Tile products over a variety of surface characteristics, the SMEs compared them to airborne lidar data samples from across the United States and Senegal. They found the horizontal accuracy of the EarthDEM products (Strip DSM: 0.5-meter (m) Root Mean Square Error Horizontal (RMSEH); Mosaic Tile: 0.3 m RMSEH) agreed with the specifications provided by the PGC and graded them “Excellent.” The vertical accuracy results of the EarthDEM Strip DSM (5.6 m Root Mean Square Error Vertical (RMSEV)) and the Mosaic Tile (4.9 m RMSEV) products varied by land cover type, with all land cover types exceeding the specification provided by the PGC (0.5 m RMSEV). Strip DSM vertical accuracy was found to vary from 4.6-6.8 m RMSEV depending on the cloud cover metadata field generated by the PGC. Given this variation, the vertical accuracy compliance for the EarthDEM products was graded as “Basic.”
Overall, the assessment report supports the use of EarthDEM data for NASA Earth science research and applications, as long as the data characteristics (e.g., vertical accuracy, poor cloud masking, missing surface features, data voids, etc.) are compatible with the specific science objectives and use cases.
The report also provides a Data Provider Documentation Review for the EarthDEM product that evaluated information from the PGC website, as well as a series of peer-reviewed publications by researchers at The Ohio State University’s Byrd Polar and Climate Research Center. (Only documents listed in this report were considered in the evaluation.) The report’s authors found that, overall, the EarthDEM product is “well documented,” with most information present within the product User Guide, a series of peer reviewed papers, or the PGC GitHub repository.
About the CSDA Program
The CSDA program was established to identify, evaluate, and acquire data from commercial sources that support the NASA Earth science research and application goals. NASA’s Earth Science Division recognizes the potential impact commercial satellite constellations may have in encouraging/enabling efficient approaches to advancing Earth System Science and applications development for societal benefit. Commercially acquired data may also provide a cost-effective means to augment and/or complement the suite of Earth observations acquired by NASA, other U.S. government agencies, and international partners.
1. According the authors of the report, “it should be noted that the PGC EarthDEM product is not technically a commercial product…. EarthDEM is a digital elevation dataset derived from imagery collected from the Vantor (formerly Maxar) fleet of optical satellites.”

 Login
Login