Reading view

There are new articles available, click to refresh the page.

Threat landscape for industrial automation systems. Q1 2026

All threats

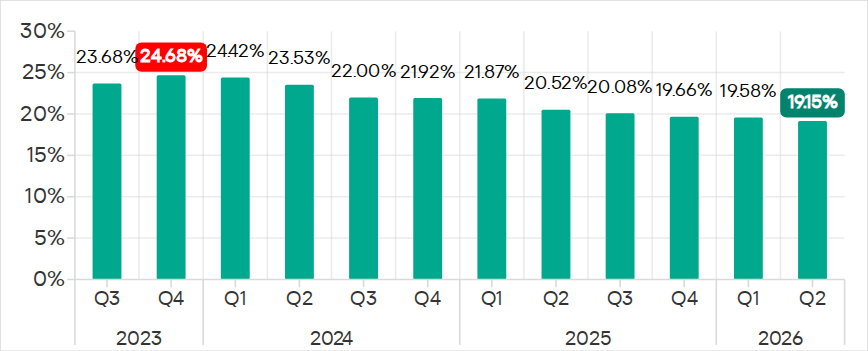
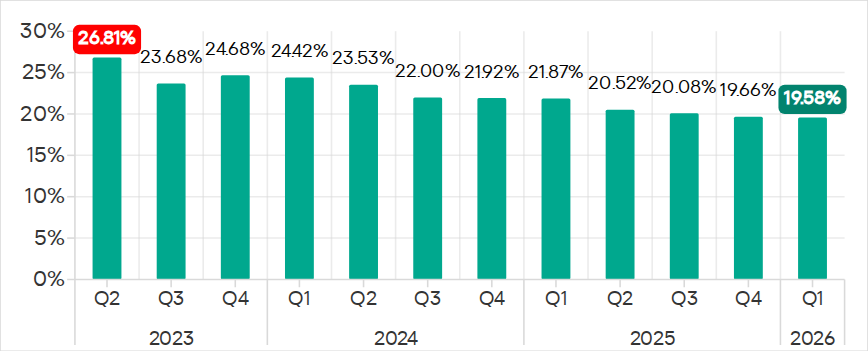
The percentage of ICS computers on which malicious objects were blocked continued to decrease, reaching 19.6% in Q1 2026. This is the lowest value in three years, and it is 1.4 times lower than in Q2 2023.

Percentage of ICS computers on which malicious objects were blocked, Q2 2023–Q1 2026

Percentage of ICS computers on which malicious objects were blocked, Q2 2023–Q1 2026

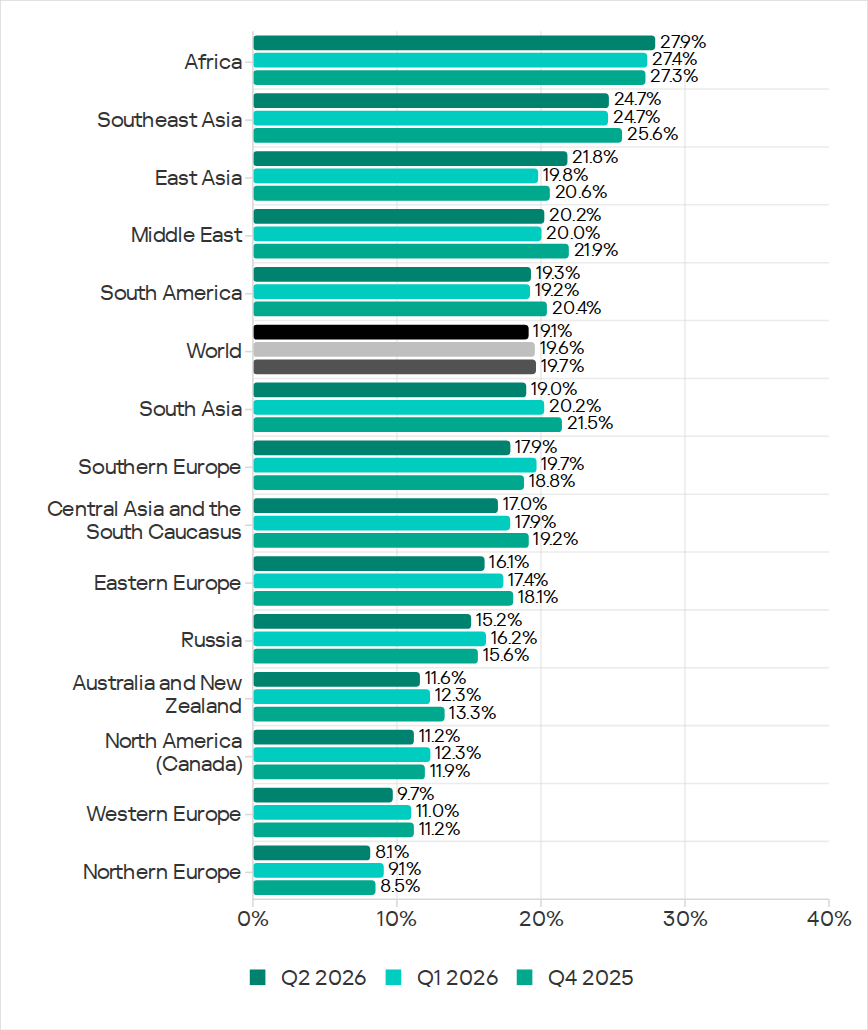
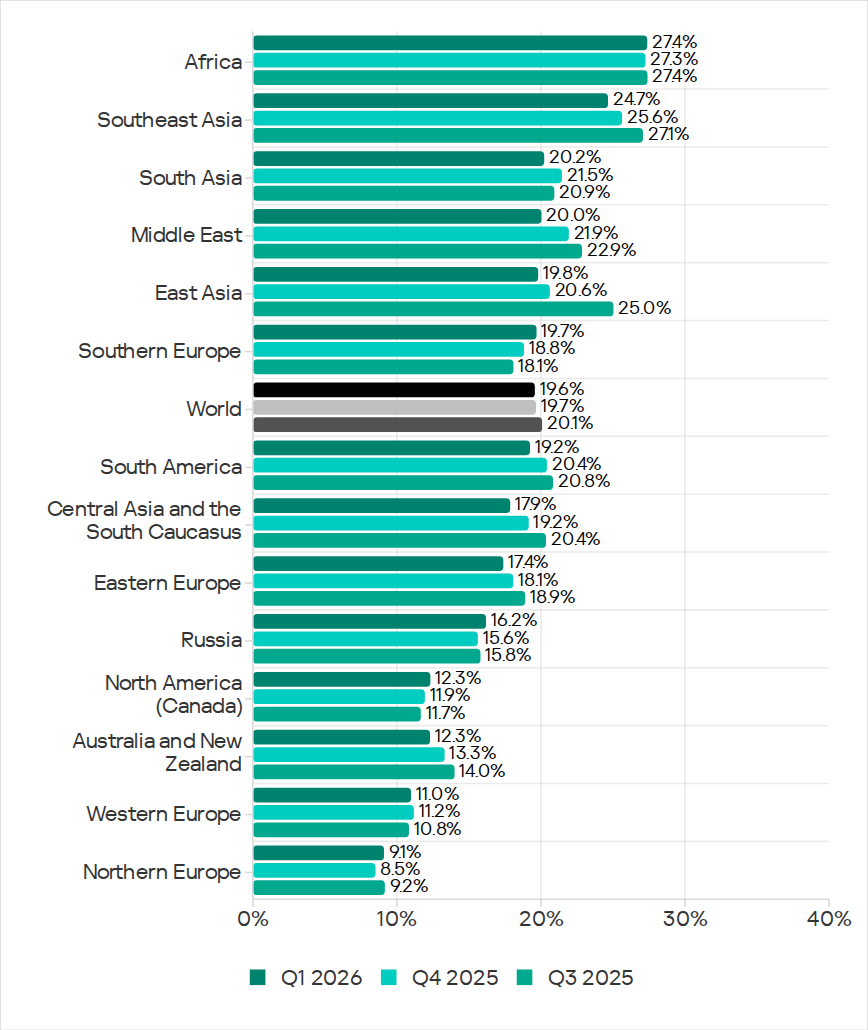
Regionally, the percentages ranged from 9.1% in Northern Europe to 27.4% in Africa.

Regions ranked by percentage of attacked ICS computers

Regions ranked by percentage of attacked ICS computers

The percentage of ICS computers on which malicious objects were blocked increased in five regions over the quarter, most notably in Southern Europe, Northern Europe, and Russia.

In Q1 2026, Southern Europe led the way in growth for internet and email threats. The region also saw the fastest growth in spyware, as well as malicious scripts and phishing pages.

In Russia, the percentage of ICS computers on which malicious objects were blocked exceeded the figures for the previous two quarters. Russia saw an increase in the percentage for threats from the internet, and a slight increase in the figure for threats from email clients (Russia is one of three regions where this figure did not decrease).

Among the threat categories, the greatest increases were observed in the percentages for denylisted internet resources, as well as spyware (distributed in the region via the internet and email clients).

Selected industries

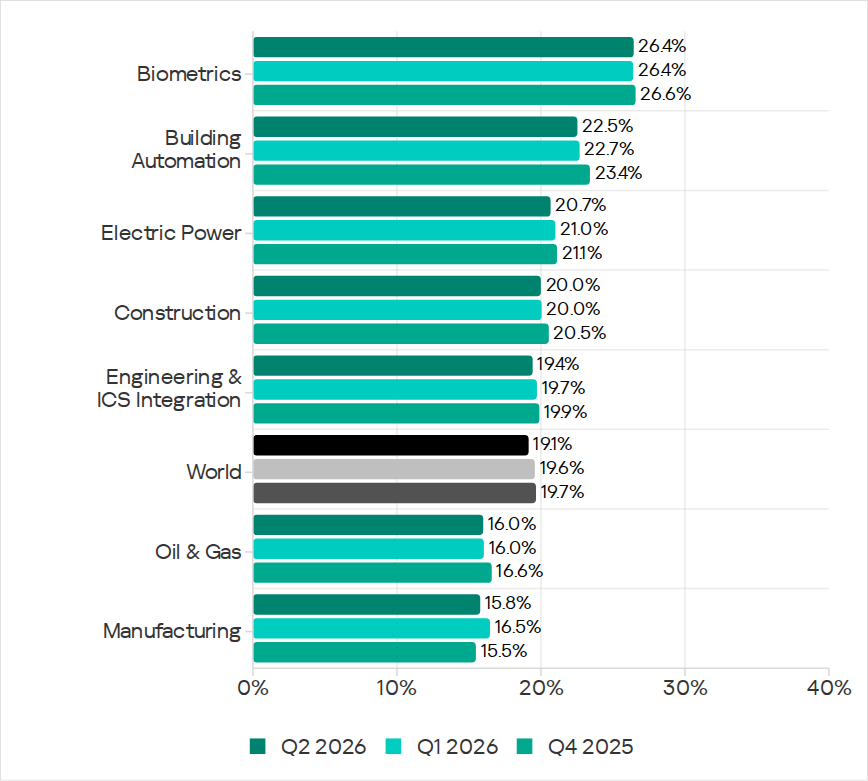
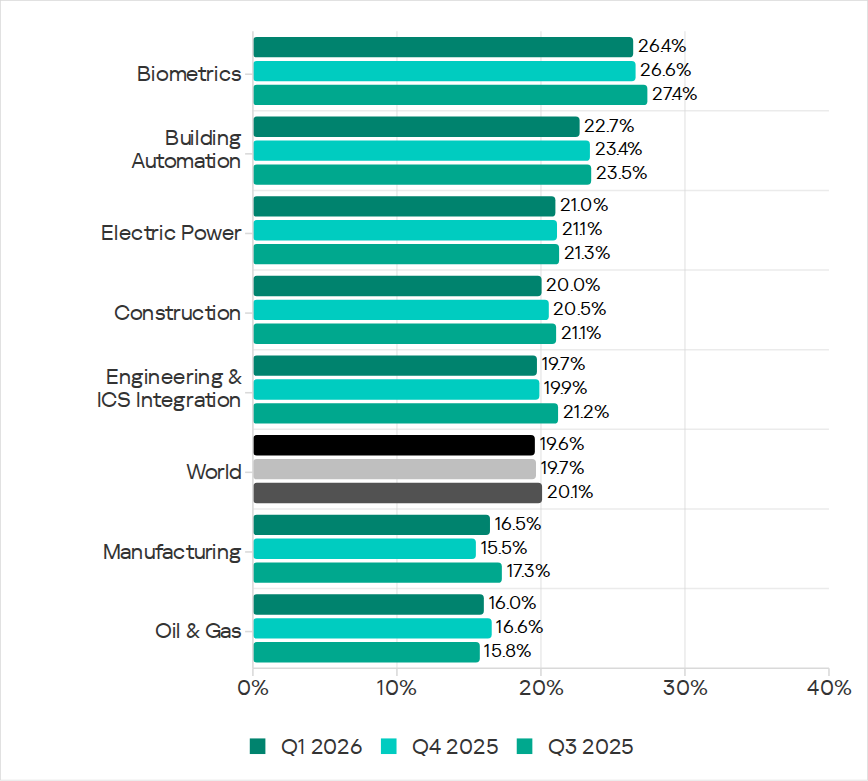
Biometric systems (26.4%) traditionally rank top among the industries and OT infrastructure types covered in this report in terms of the percentage of ICS computers on which malicious objects were blocked. These systems are characterized by internet access, extensive email use for data exchange and approvals (such as access granting), and, in many cases, minimal cybersecurity controls within the organizations that use these systems.

Industries ranked by the percentage of ICS computers on which malicious objects were blocked

Industries ranked by the percentage of ICS computers on which malicious objects were blocked

Biometric systems rank first among industries in terms of email threats. At the same time, unlike other industries, the percentage for email threats in biometric systems exceeds that for internet threats.

In all selected industries, the global average follows a downward trend. In Q1 2026, the percentage of ICS computers on which malicious objects were blocked increased only in the manufacturing sector — by 1.0 pp. The percentages for this industry increased across 10 regions, with the most notable increases in Western Europe, Northern Europe, and Russia.

Threat categories

In Q1 2026, Kaspersky security solutions blocked malware from 10,052 different malware families of various categories on industrial automation systems.

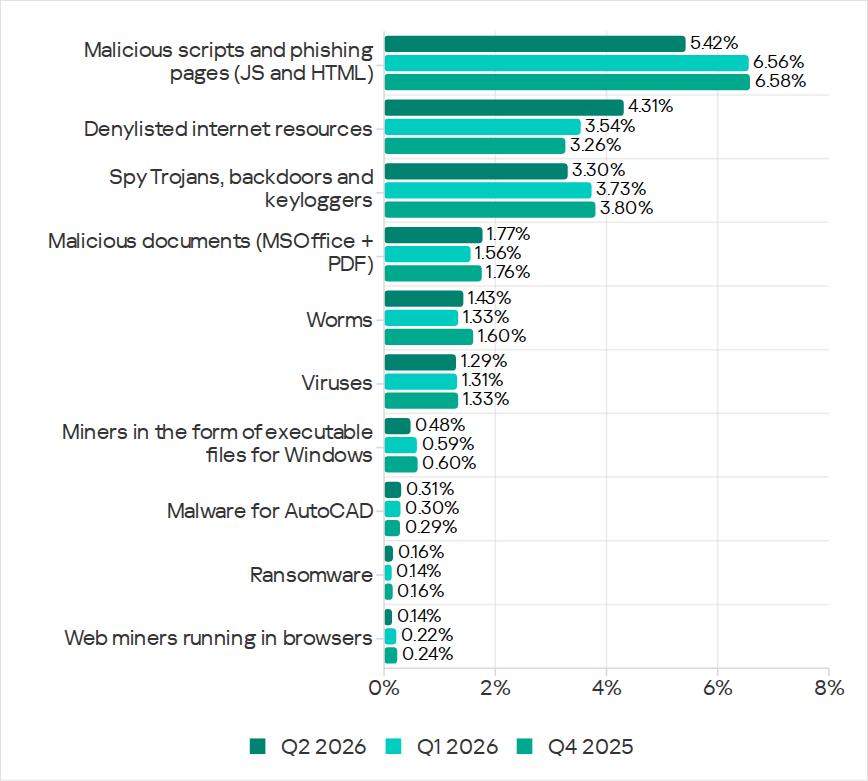
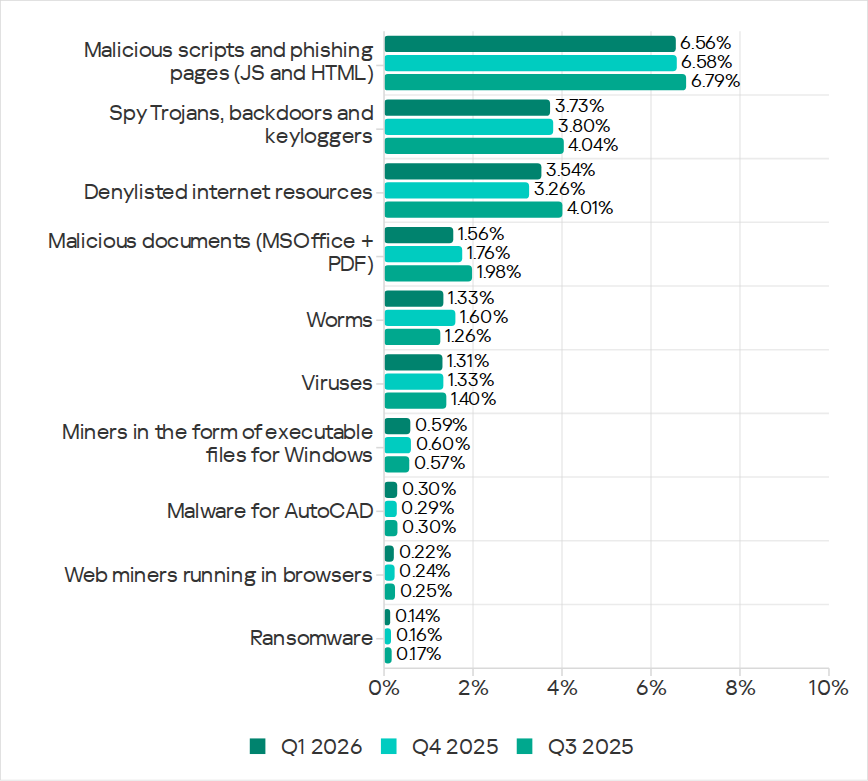
Over the quarter, the percentage of ICS computers on which denylisted internet resources were blocked increased (after decreasing over the previous two quarters), and there was a slight increase in the percentage for AutoCAD malware.

Percentage of ICS computers on which the activity of malicious objects from various categories was prevented

Percentage of ICS computers on which the activity of malicious objects from various categories was prevented

Malicious scripts and phishing pages (JS and HTML)

Malicious scripts and phishing pages retained their to spot among threat categories by the percentage of ICS computers on which these threats were blocked. The global average in Q1 2026 was 6.56%.

Over the quarter, the percentages increased in four regions. The most significant change was observed in Southern Europe (9.85%, +0.94 pp). The figures for malicious scripts in the region increased over three consecutive quarters.

Among the selected industries, across all regions, the highest percentages for the malicious scripts and phishing pages category were recorded for biometric systems (19.59%) and building automation (15.43%) in Southern Europe. These same industries lead in similar rankings for malicious documents and spyware.

Spyware

The percentage of ICS computers on which spyware was blocked decreased over two consecutive quarters, dropping to 3.73%. Despite the decline, spyware has ranked second among threat categories by the percentage of attacked computers for three consecutive quarters.

The percentages increased in five regions over the quarter, most notably in Southern Europe (5.46%, +0.35 pp) and Russia (2.84%, +0.24 pp).

In Southern Europe, the percentage of ICS computers on which spyware was blocked increased in all the selected industries except manufacturing. The greatest increase was observed in biometric systems.
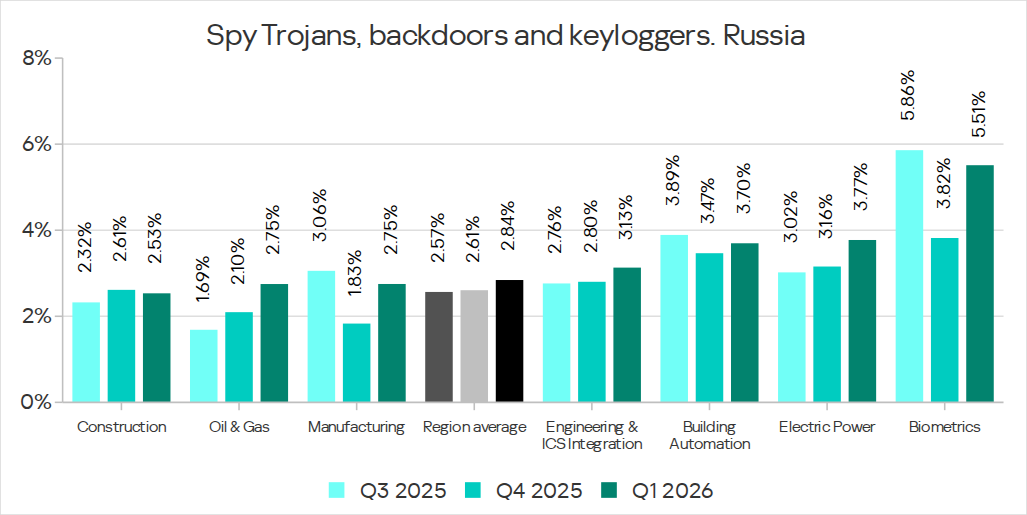
Among the selected industries, the highest percentage of spyware in Russia was recorded in biometric systems. That said, the percentage of ICS computers on which spyware was blocked increased in all industries in the region except construction. The percentage figure has been increasing for two consecutive quarters in the oil and gas industry (by a factor of 1.63 over six months), and for three consecutive quarters in engineering and ICS integration, as well as electric power. In the remaining sectors, the values have been fluctuating.

Percentage of ICS computers on which spyware was blocked in various industries in Russia, Q3 2025–Q1 2026

Percentage of ICS computers on which spyware was blocked in various industries in Russia, Q3 2025–Q1 2026

Denylisted internet resources

The percentage of ICS computers on which denylisted internet resources were blocked increased to 3.54%.

The most notable increase over the quarter occurred in Southeast Asia (4.58%, +0.65 pp). Among the industries in the region, the highest percentage figures for this threat category were recorded in electric power and construction. Over the quarter, the largest increases in percentages figures were observed in the electric power and manufacturing industries.

In North America (Canada), denylisted internet resources (2.14%) showed the greatest increase among all categories — by a factor of 1.22.

Among the selected industries across all regions, the highest percentage figures for the denylisted internet resources category were in the electric power (7.11%) and construction (6.25%) industries in Southeast Asia.

Malicious documents (Microsoft Office + PDF)

The percentage figure for this category decreased over two consecutive quarters, reaching its lowest value (1.56%) for the entire period of observations in Q1 2026. It increased just in two regions: Australia and New Zealand (1.12%, +0.04 pp), and Russia (0.62%, +0.01 pp).

Among the selected industries across all regions, the highest percentages for malicious documents were recorded for biometric systems (9.02%) and building automation (6.97%) in Southern Europe. These same industries also lead in similar rankings for malicious scripts and spyware.

Ransomware

The percentage of ICS computers on which ransomware was blocked has decreased for two consecutive quarters, dropping to 0.14%. This is the lowest value among all categories.

The percentage increased in two regions: North America (Canada) (0.11%, +0.04 pp) and slightly in Northern Europe (0.06%, +0.01 pp).

Among the selected industries across all regions, the highest percentages for ransomware were recorded in the oil and gas and manufacturing industries (0.92% and 0.65%, respectively) in Central Asia and the South Caucasus, and in biometric systems (0.89%) in Russia.

Miners in the form of executable files for Windows

The percentage of ICS computers on which miners in the form of executable files for Windows were blocked decreased to 0.59%.

The percentage increased in seven regions. The largest increase was observed in Africa (0.63%, +0.16 pp). Among the selected industries, the largest increases in the region were in the manufacturing and oil and gas industries.

Among the selected industries across all regions, the highest percentages for miners in the form of executable files were recorded in construction (1.99%), biometric systems (1.98%), and the oil and gas industry (1.97%) in Central Asia and the South Caucasus.

Web miners

The percentage of ICS computers on which web miners were blocked has been declining for a year, and in Q1 2026, it reached the lowest value for the entire period under review (0.22%).

At the same time, the percentage increased in seven regions. The largest increases were observed in South Asia (0.28%, +0.11 pp), the Middle East (0.31%, +0.09 pp), and Africa (0.34%, +0.08 pp). Despite the increases, the percentages in these regions for Q1 2026 did not exceed those observed in 2023–2024 and in Q1 2025.

Among the selected industries across all regions, the highest percentages for web miners were recorded for biometric systems (0.97%) in Russia. Biometric systems in South Asia (0.79%) ranked second, and the electric power sector in Southeast Asia (0.76%) ranked third.

Worms

The percentage of ICS computers on which worms were blocked decreased to 1.33%.

The percentage decreased across all regions following an increase in the previous quarter (due to a wave of phishing attacks that distributed the Backdoor.MSIL.XWorm backdoor worm across all regions of the world).

Among the selected industries across all regions, the highest percentage figure for worms was recorded for biometric systems (4.80%) in Central Asia and the South Caucasus. Two industries in Africa – biometric systems (4.04%) and electric power (3.53%) – took the second and third spots, respectively.

Viruses

The percentage of ICS computers on which viruses were blocked decreased to 1.31%.

The top 3 regions by this figure remained the same: Southeast Asia (6.11%, first by a wide margin), Africa (4.15%), and East Asia (2.97%). These same regions are also among the leaders by the percentage of systems affected by AutoCAD malware. The largest increase in this figure was observed in Africa (+0.41 pp).

Among the selected industries across all regions, the highest percentages for viruses were recorded in the construction industry (6.35%) and building automation (5.50%) in Southeast Asia.

Malware for AutoCAD

The percentage of ICS computers on which malware for AutoCAD was blocked increased to 0.30%.

The most notable increase over the quarter was observed in Africa, with the region’s percentage figure rising by 0.47 pp, a very significant increase for this category, and almost doubling (to 0.91%).

Among the selected industries across all regions, the highest percentages for AutoCAD malware were recorded in the construction industry in East Asia (5.58%) and Southeast Asia (3.87%).

Main threat sources

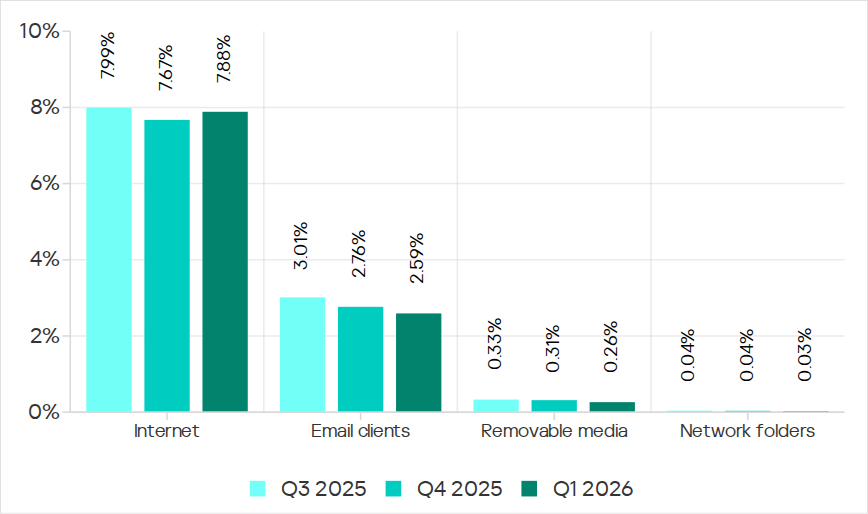
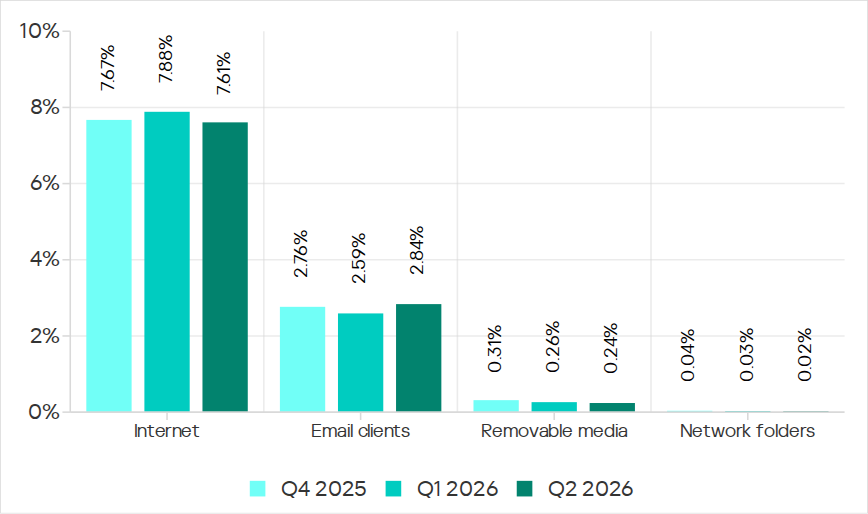
In Q1 2026, the average percentages across all threat sources, except threats from the internet, decreased globally.

Percentage of ICS computers on which malicious objects from various sources were blocked

Percentage of ICS computers on which malicious objects from various sources were blocked

Internet

The percentage of ICS computers on which threats from the internet were blocked increased to 7.88%. However, over the past three years, the percentage figure for internet threats has followed a downward trend.

The largest increases in the percentages were recorded in Southern Europe (8.59%, +0.59 pp), Southeast Asia (10.16%, +0.55 pp), and Northern Europe (4.47%, +0.51 pp).

Among the selected industries across all regions, the highest percentages for threats from the internet were recorded in electric power (13.16%) and construction (12.55%) in Southeast Asia, and in the engineering and ICS integration sector (12.33%) in South Asia.

Email clients

The percentage of ICS computers on which threats delivered via email clients were blocked decreased to 2.59%. This is a three-year low.

The percentage of this threat source increased in three regions: Southern Europe (6.54%, +0.2 pp), East Asia (1.5%, +0.09 pp), and slightly in Russia (0.7%, +0.04 pp).

Among the selected industries across all regions, the highest percentages for email threats were recorded for biometric systems (19.78%) and building automation (12.34%) in Southern Europe. In these two industries, the percentage of ICS computers on which email threats are blocked is higher than the percentage for threats from the internet. A similar situation was observed in two other instances, both in biometric systems (in South America and Southeast Asia).

Removable media

The percentage of ICS computers on which threats were detected when connecting removable media continued to decrease, reaching its lowest value for the period under review (0.26%).

Among the selected industries across all regions, the highest percentages for removable media threats blocked on ICS computers were observed in the electric power sector in Central Asia and the South Caucasus (1.45%), East Asia (1.34%), and Africa (1.16%).

Network folders

The percentage of ICS computers on which threats are blocked in network folders is steadily decreasing. In Q1 2026, it was the lowest for the period under review (0.029%).


East Asia has traditionally led by a wide margin. The percentage for East Asia (0.135%) is 27 times higher than the lowest regional value (recorded in Northern Europe).

The largest increases in the percentages for threats from network folders were observed in Africa (0.037%, +0.006 pp) and South America (0.013%, +0.006 pp).
Among the selected industries across all regions, the construction industry in East Asia, at 0.36%, holds the top positions in the ranking by the percentage of ICS computers on which threats are blocked in network folders.

For more information on industrial threats see the full version of the report.

Anti-Forensics: How to Encrypt Messages in Any Messenger or Social Network

Welcome back, aspiring cyberwarriors!

Many of us are being pushed toward insecure messengers and social networks. These communication channels may be monitored and are not trustworthy. That does not mean private communication is impossible. Far from it. One of the oldest and most practical problems in cryptography is how to send a secret message through an open channel without making the message obvious to anyone who sees it. And that problem has already been solved very well.

The encrypted text does not always have to look like encrypted text. A message can be hidden in plain sight so that it looks like ordinary content, or it can be embedded inside something else entirely, such as audio, video, or text that does not raise suspicion. That is the realm of steganography. Cryptography protects the meaning. Steganography helps hide the fact that a message exists at all.

For most people, though, the real need is much simpler. They want a practical and convenient way to encrypt messages quickly and reliably. So let’s look at some easy tools that make that possible.

Workflow

The workflow is always the same. First, the sender and recipient agree on a secret password or passphrase. A short sentence made up of several words is often better than a single word because it is easier to remember and usually much stronger. Then the sender pastes the message into the tool, clicks Encrypt, enters the password, and sends the resulting encrypted text through whatever channel they want, even if that channel is insecure. The recipient then uses the same tool and the same password to decrypt the message.

That is the basic pattern, and it stays consistent across different tools and platforms.

Web-Based Encryption Tools

There are browser-based applications that can encrypt text very effectively, and they are often the easiest place to begin. But there is one very important detail. You want to make sure the encryption happens entirely on the client side. That means the message is processed inside your browser, on your own machine, and the password never leaves your device. If the server never sees the key, the risk of leakage is much lower.

That point is worth checking. A good looking website is not automatically secure. One way to verify local processing is to monitor browser traffic using Developer Tools, or DevTools, and see whether your password is being sent over the network. Another way is to use a firewall application such as Little Snitch and observe whether the service tries to communicate with remote servers during encryption or decryption. If the system is truly local, the encrypted message can later be decrypted either through the same browser-based Decrypt form or offline with OpenSSL.

There are a few websites out there. 

The first one is Encrypt Online. It uses AES-256-CBC to encrypt text, strings, JSON, YAML and config data directly in your browser. It’s considered to be a strong, mathematically unbreakable encryption algorithm.

Encrypt Online

Paranoia Text Encryption uses AES-256 in EAX mode with keys derived from passwords using Argon2. That combination is strong and modern.

Paranoia Text Encryption

LOCK.PUB is another browser-based option, focused on creating encrypted online notes, polls, images, audio and a lot more. The content can only be accessed with the correct password.

Lock Pub

For users who want something more flexible and technical, GCHQ CyberChef is a powerful open-source option from the UK’s GCHQ intelligence agency. It supports many encryption and encoding operations. 

Cyber Chef

AES Utils is another choice, using AES-256-GCM with PBKDF2 while keeping the interface simple.

AES Untils

Warning

As a contrast, it is useful to look at what should not be considered a proper secure solution. MagicTool encrypts and decrypts text without requiring a password. 

Magic Tool

At first glance that may sound convenient, but from a cryptographic point of view it means the same built-in secret is used every time. If anyone knows the website and the service’s behavior, they may be able to infer or recover the messages. In that setup, the tool itself is functioning like the secret key simply by existing.

That is not a strong cryptographic model. However, in some situations, “encryption” without a user-provided key could still serve a purpose. For example, it might be used to deceive an adversary into believing you are an inexperienced user who does not know how to encrypt messages properly, when your real objective is to feed them specific information in a controlled manner.

Offline Encryption Software

Browser tools are convenient, but sometimes you want something local, traditional, and fully under your control. Linux, Windows, and macOS all have native or widely trusted applications that can encrypt text and files without relying on a remote browser service.

Common examples include command-line tools such as GnuPG, OpenSSL, and ccrypt, along with password managers, VeraCrypt, Cryptomator, and a wide range of similar utilities. These tools are often used not only for text messages but also for file encryption, container protection, and secure storage.

Offline tools have an advantage because they reduce the number of outside systems involved in the process. You are not dependent on a remote website staying available, and you do not need to trust a third-party server with your content or password. For many users, that is a better model from a privacy perspective. At the same time, it is important to understand that privacy tools still leave traces. On a Windows system, a digital forensics investigator may be able to see installation artifacts, program execution history, registry keys, recent files, shortcut files, jump lists, user activity traces, prefetch data and remnants of encrypted containers or text editors. Even when the content itself remains protected, the fact that you used a particular application may still be visible in the system’s history.

That is why privacy-conscious users often prefer systems that are designed to leave fewer traces by default. A privacy-oriented operating system, live environment, or hardened Linux distribution can be a better choice when your goal is to reduce unnecessary local exposure. 

Summary

Encrypting messages is a simple and useful privacy skill. Whether you use a browser-based tool or you prefer offline software the basic principle is the same. 

The right tool depends on the situation. Browser-based tools are convenient and fast. Offline tools give you more independence and more control. Some systems are designed for strong cryptography, while others are only suitable for demonstration or deceptive use. Understanding the difference matters.

If you want to go deeper into how privacy can be preserved on real systems and how forensic traces are created and analyzed, our Anti-Forensics training is your next step. We covered advanced techniques for preserving your privacy and understanding what investigators can still see even when you think you have covered your tracks.

The post Anti-Forensics: How to Encrypt Messages in Any Messenger or Social Network first appeared on Hackers Arise.

OpenClaw: risks for the users and how to mitigate them

OpenClaw, which was previously known as Clawdbot and Moltbot, is today one of the most successful and fast‑growing ecosystems for AI agents, recognized worldwide. The project quickly became popular with users because of its flexibility and ability to solve fairly complex tasks that previously required a lot of time for automation and execution. A dedicated marketplace appeared quickly after the project started gaining traction, where developers and users began publishing tools that integrate with OpenClaw. Currently, employees all over the world use OpenClaw to automate their tasks, often unaware of risks this practice introduces to them and their employers.

In this article we will examine several security aspects of OpenClaw, look at how attackers can target this system, which vulnerabilities are already known, and how to protect your organization against these issues.

OpenClaw skills

The project’s success was ensured by the fact that the agent accepts natural language instructions, does not require knowledge of programming languages, and allows the use of skills, which expand its capabilities. The overall architecture of OpenClaw can be seen below:

The OpenClaw overall architecture

The OpenClaw overall architecture

As shown in the diagram, the system is designed to be used with agent skills. These skills can reside locally on the system where the agent is installed or they can be obtained from external sources. At the time of writing this article, a dedicated hub named “ClawHub” is used for sharing skills with other users.

One of the key features of OpenClaw skills is that they are easy to create and do not require coding. A skill is in essence a set of commands written in natural language, although it can contain code. Currently, there is a general description of the skill format: it is usually a text file named SKILL.md, although more complex variants may exist. The primary requirement for these files is that they use a plaintext format. To illustrate what this looks like, here is a fragment of a skill:

Openclaw skill example

Openclaw skill example

The applications for OpenClaw skills are quite broad and can include everyday tasks like checking email, performing routine operations and calculations on a computer, as well as more complex pipelines that handle testing, research, or software development. For most actions, the agent requires access to the operating system’s file system, as well as to the tokens and keys of the systems it will interact with. All necessary data are usually provided by users either through environment variables or in plaintext files located alongside the agent.

Since many skills enable automation of work processes, employees worldwide actively use them. This fact, combined with the widespread adoption of the system and the overall popularity of artificial‑intelligence technologies, has attracted attackers to the project.

OpenClaw vulnerabilities

In less than two years, around 530 vulnerabilities have been discovered both in OpenClaw itself and in the underlying technologies. That said, the publication of OpenClaw vulnerabilities in the CVE database began only in February 2026. Below is a breakdown of these vulnerabilities by severity.

Registered vulnerabilities (download)

As shown in the chart, the number of high-severity vulnerabilities is quite large. Most of these vulnerabilities fundamentally involve issues with storing sensitive data and operating with excessively high privileges. Each of them can be exploited to hijack the agent or inject commands that it will execute.

Malicious skills

Besides exploiting vulnerabilities and deceiving users, there are more specific attack vectors against OpenClaw, namely, skills.

Research logically draws a parallel between supply‑chain attacks and the distribution of malicious skills. However, unlike usual supply-chain attacks, creating malicious skills is trivial because there is no longer a need to develop custom malware. Despite this, until February 7, 2026, no skills had undergone even a basic security check, which allowed malicious skills to appear immediately. Our scan of the skill hub in April identified 24 accounts that were distributing more than 600 malicious skills. Overall, open‑source intelligence indicates that over 1100 malicious accounts have been created since January.

Following the investigations and a lengthy effort to clean the skill repository of malicious entries, it was announced that files would undergo preliminary scanning with VirusTotal (VT) and NVIDIA’s SkillSpector. On the one hand, this is a more responsible approach to publishing skills; on the other, because OpenClaw is primarily an agent that executes a set of instructions, detecting malicious activity moves to a different level. Now it is necessary not only to analyze a file for dangerous commands that should be blocked, but also to examine all possible malicious behaviors that could be triggered by a harmful instruction within a skill. An example of a malicious command in natural language:

Example of a malicious command within a skill action

Example of a malicious command within a skill action

An example of a malicious command using a part of a bash command:

Malicious command inside a skill

Malicious command inside a skill

The example in the image and similar malicious skills are detected by Kaspersky products as HEUR:Trojan.ANSI.MalClaw.gen.

In addition, Kaspersky products monitor malicious OpenClaw skill activity on the system. Below are detection statistics from our systems that have identified malicious OpenClaw client behavior. The data for June cover the first half of the month.

Statistics on Kaspersky product detections of OpenClaw malware (download)

As shown in the chart, even despite the measures taken to counter the publication of malicious skills, attacks continue. Therefore, it is important to employ layered protection that isolates the OpenClaw agent from critical data and infrastructure systems. We also recommend checking all skills that enter the organization’s perimeter. For this purpose, Kaspersky Scan Engine is suitable. This solution is designed to protect web applications, proxy servers, network attached storage, and mail gateways. It can be integrated into almost any application, and it is easy to deploy and manage.

Malicious skill detected by Scan Engine

Malicious skill detected by Scan Engine

Additionally, monitor network accesses used by the agent. For this purpose, the project already provides a sandboxing subsystem and various wrappers for working with APIs and services. Last but not least, develop a comprehensive AI policy and make sure your employees never use third-party tools that they are not explicitly allowed to use.

Meta's Un-Stable Signature

I'm wrapping up my investigation into invisible watermark algorithms and I am extremely disappointed. Not only do none of the modern AI-based algorithms work as they claim, it turns out that they are all making the same fundamental mistake.

I previously evaluated Google's SynthID and Adobe's TrustMark algorithms. Both of them claim to have incredibly accurate results.
  • According to Google's peer-reviewed and published paper, they claim to have a true positive rate (TPR) above 99.97% -- meaning that they will miss their own watermarks less than 1 in 10,000 times. However, my own empirical testing found that is it much closer to 1 in 20. Moreover, SynthID is proprietary and only accessible through Google's "Gemini" AI system. Gemini has been observed hallucinating results and providing contradictory conclusions depending on how the question is phrased.

  • According to Adobe's Content Authenticity Initiative, their TrustMark "can exceed 96% bit accuracy at around 42-45dB PSNR quality under severe noise degradations". However, that statistic focuses on resilience and not accuracy. In my empirical tests, I found that TrustMark has a 10%-20% false positive rate, effectively making it useless. (If you see a TrustMark signature, then it is very likely random noise and not an actual signature.)
This time, I evaluated Meta's "Stable Signature" algorithm. (Their paper and code are in GitHub.) This system encodes a 48-bit sequence into the picture's visual content. The idea is that you can encode a unique 48-bit sequence as your watermark. If your decoder finds the same 48-bit sequence, then it can identify your own watermark.

WARNING: This blog entry leans heavily into math and statistics to prove that Stable Signature, TrustMark, and SynthID are nowhere near as reliable as their developers claim.

The Basic Algorithm

Traditional (non-AI) invisible watermarks typically hide in subtle locations, such as the least significant bits, changes in brightness (e.g., Digimarc) or the frequency spectrum (DCT or FFT). There is always the risk that image encoding could corrupt the hidden data, so these algorithms typically rely on repetition over the image to help identify the true signal. In addition, they may include error correction code (extra bits in the data) to fix any minor data errors.

However, there is a problem with the traditional approaches: injecting hidden data in the image could create visible distortions. The modern approach uses an AI system to better hide the data with less added distortion.

As with SynthID and TrustMark, Stable Signature encodes binary data and uses an AI-model to decide where to hide it in the image. The AI is tuned to minimize visible distortions when embedding the data. Later, an AI-based decoder looks at the image and identifies the likely location where bits are stored, then it extracts the data.

There is always the case that the data may be mixed with noise. Different AI-based watermarking systems rely on different techniques for reducing the noise. For example:
  • Google's SynthID only stores a few bits of data (effectively a flag or version number). This allows them to use a lot of data as repetition and to increase the accuracy rate.

  • Adobe's TrustMark uses the Bose-Chaudhuri-Hocquenghem (BCH) algorithm. This acts as a combination of checksum and error correcting code that should reduce the number of errors.
Meta's Stable Signature uses a simple Hamming distance.


The Hamming distance measures the number of bits that need to be swapped in order to correct the code. In effect, it defines a set of stable states (e.g., 10110 and 11000) and places a ring around each state that represents the single bit changes. If you change enough bits, then you will reach a different stable state.

According to Meta's Stable Signature research paper, the 48-bits should be uniformly distributed and cites a "false positive rate below 10-6", or 1 in one million. This means you can choose a 48-bit sequence to use as your signature. Every picture will generate a 48-bit sequence, and the sequence can vary a little based on noise in the picture. However, if you find a code that is within a short Hamming distance of your code (e.g., within 6 bits difference), then you can determine that it is the same code with a high reliability.

At least, that's the theory.

Empirical Testing

I went into this experiment assuming that everything works like they claim. I want to be able to reliably identify invisible watermarks associated with Meta. What I don't know is what sequence they use, or whether they use multiple codes depending on whether it comes from Meta's AI system, Facebook, Instagram, WhatsApp, etc.

Fortunately, this is something I can test! I grabbed an uncurated sample of pictures from FotoForensics: the first 10,000 unique images uploaded last month (May 2026). If the bit sequences are uniformly distributed with a "1 in 1 million" collision rate, then I should see a huge number of unique bit sequences and a few small clusters around pictures from Meta (Meta AI, Facebook, Instagram, etc.). Those clusters will represent the invisible watermarks used by Meta.

The results from my empirical test were definitely not what I expected. I found:
  • No clusters associated with any Meta images. This suggests that Meta does not use their own Stable Signature watermarking software found on GitHub.

  • With a random distribution, there should be no clusters. However, I had 25 different pictures that had the exact same bit sequence: 110110100111111011101001111000100111011000011101. With a 1 in a million collision rate, this should not happen! These pictures came from very different sources. Here's four of the 25 pictures (ranging from planets to light bulbs to text with a transparent (black) background):


    All of these pictures have dark/black backgrounds and something bright in the middle. This suggests that Stable Signature operates more like a perceptual hash than an invisible watermark.

  • Stable Signature uses a Hamming distance to identify a cluster. If I assume the 25 pictures are the center (centroid) of the cluster and use a 6-bit Hamming distance, then there are 356 pictures that are similar. And if I assume that the 25 pictures are not the center but part of a cluster, then a Hamming distance of 6 has a cluster of 450 pictures centered 3 bits away, at 110110000111111011101011111000100111001000011101. This cluster represents 4.5% of the uncurated image data set! Here are a few samples from this larger cluster:


    (I'm explicitly not sharing pictures with personal information, like invoices, recognizable people, and GPS information.)
It's not just one random cluster that is massively large (450 pictures out of 10,000). There's a cluster of 184 pictures at 110101001011001011001011111000100111001000011101, 58 pictures at 110100000011111010001001111000100111011000011101, etc. I found over 60 clusters with more than 10 pictures each at a Hamming distance of 6. That should not happen with a "1 in 1 million" collision rate.

Independent Analysis

I went back to Meta's research paper to see if I could find the discrepancy. And there it was, in section 3.1: They tested their system against the hypothesis that the 48-bits are each independent and uniformly distributed. The problem is, they use one neural network to generate the bits. That explicitly means that the bits are dependent, not independent.

Their paper assumes a binomial distribution. That is, given an arbitrary image, the 48-bits represent a random coin flip. The math becomes:
P(XT)=Tk=0(48k)(0.5)k(0.5)48k

This computes the probability of 48 random bits being within a Hamming distance (T). The probabilities table becomes:

Hamming Distance Threshold (T)Bit Error Rate (BER)Probability of a Random Image Matching by Chance
14 bits or fewer≤ 29.17%1 in 362.63
13 bits or fewer≤ 27.08%1 in 957.81
12 bits or fewer≤ 25.00%1 in 2,788.35
11 bits or fewer≤ 22.92%1 in 8,999.08
10 bits or fewer≤ 20.83%1 in 32,416.80
9 bits or fewer≤ 18.75%1 in 131,390.28
8 bits or fewer≤ 16.67%1 in 605,094.89
7 bits or fewer≤ 14.58%1 in 3.20 Million
6 bits or fewer≤ 12.50%1 in 19.83 Million
5 bits or fewer≤ 10.42%1 in 146.19 Million
4 bits or fewer≤ 8.33%1 in 1.32 Billion
3 bits or fewer≤ 6.25%1 in 15.24 Billion
2 bits or fewer≤ 4.17%1 in 239.15 Billion
1 bit or fewer≤ 2.08%1 in 5.74 Trillion
0 bits (perfect match)= 0.00%1 in 281.47 Trillion

Meta's paper says that they use a Hamming distance of 7 bits (requiring 41 of 48 bits), which matches their claim of a "false positive rate below 10−6". However, I'm seeing problems at a Hamming distance of 6 (should be 1 in 20 million) and even collisions at 0 (1 in 281 trillion)!

The Core Problem

There is clearly a discrepancy between the theoretical probabilities and the empirical testing. When I looked back over Meta's research paper, I saw the problem:

According to Meta's paper, each of the 48-bits are independent. In a perfectly independent 48-bit hypercube, un-watermarked images should scatter uniformly across all 248 possible values. However, neural networks map a non-linear manifold (a multi-dimensional wavy surface) through this hypercube. This mathematical landscape is warped with its own peaks, ravines, and valleys. It has attractors that form clusters, and repulsers that form voids where stable values can never exist; this is a feature of a neural network. And most importantly, the output bits are explicitly not independent.


The left diagram illustrates an expected uniform distribution if all of the bits were independent. The right diagram are the types of theoretical clusters that form when the bits are dependent. There should be clusters around attractors and voids (areas with no dots) from the repelling regions.

Moving from theoretical to empirical, I graphed the data. The 48 bits can be represented as bytes. I took the first 24 bits and converted them into 8-bit red, green, and blue pixel colors. If the data is truly random, then the colored dots should be distributed across the RGB cube. However, if the bits are dependent, then there should be very clear clusters, structures, and voids. Here's the graph:


Yes, there are very clear structures that look like planes and lines. Within the planes are clusters, and outside the planes are very large voids -- areas where there are no dots at all. The data generated by Meta's Stable Signature implementation fails this basic test for independence.

The biggest cluster that I found represents a Zero Signal Bias (ZSB). When their neural network doesn't find a watermark, it moves the 48 bits toward a strong attractor, like a massive gravitational well. At 6 bits error, it should have a collision of around 1 in 20 Million. But in reality, my 10,000 pictures had a cluster of 450 images within 6 bits due to the ZSB. That's an error rate of around 1 in 22 with the ZSB alone. If we add in all of the other clusters that contain at least 10 pictures, then 2327 pictures are in various clusters; we're looking at an error rate around 1 in 4 -- and that's at a Hamming distance of 6, which is more conservative than their paper's Hamming distance of 7. (In AI terms, this is a representation collapse or structural bias that is typical for deep neural networks.)

(As an aside: Given their "1 in 1 million" claim, I could look for any clusters of 2 or more pictures. At clusters of 2 or larger, 5,237 of the 10,000 test images were in clusters, or 52%. If you show their algorithm 10,000 pictures, then there is a better-than 50% chance of a false positive match.)

Less Than Random

It's one thing for me to claim that there are visible clusters and to show pictures of clusters, but another to prove it mathematically. (Time to dust off my college textbooks from "Introduction to Statistics"...)

I fed Meta's code the first 10,000 images from May 2026. A few of the images were in unsupported formats (HEIC, WebP, and a few corrupted JPEG files), resulting in 9,847 viable pictures. I evaluated this data with elements from the NIST Statistical Test Suite (SP 800-22) for randomness, including a monobit test and Chi-Squared (χ2) test for independence.

The monobit test determines if the baseline frequency of adjacent bits seems independent.
  • Total Bits Processed: 9,847 pictures × 48 bits per signature = 472,656 bits
  • Observed Count of Ones ('1'): 266,419
  • Observed Count of Zeros ('0'): 206,237
  • Expected Count (E): 236,328 for each.
Running a simple standard Chi-Square Goodness-of-Fit test for this bit balance:
χ2=(266419 − 236328)2236328+(206237 − 236328)2236328= 3816.14 + 3816.14 = 7632.28
  • In mathemat-ese: with 1 degree of freedom, a χ2 statistic of 7,632.28 yields a p-value infinitely close to 0.0 (p ⋘ 10-100). (As an aside, most Chi-square tables usually evaluate the 1 degree of freedom up to around χ2=10. This χ2 value is so astronomically high that the probability p effectively becomes zero.)

  • In English: That's definitely not random or independent.
The watermark extraction is strongly biased toward producing 1s over 0s across global arbitrary images (roughly 56% ones to 44% zeros). This immediately violates the uniform distribution assumption.

The second test is the Chi-Square (χ2) Test for Serial Independence. If the bits were independent, the transition probability between adjacent bits would just be the product of their individual probabilities. This table shows the occurrence rate of the transition pairs across all of the observed 10,000 (well, 9,847) pictures:

Transition PairObserved Count (O)Expected Count under Independence (E)
0 to 0106,75090,051
0 to 195,296116,186
1 to 095,302116,186
1 to 1165,461149,976

χ2=(OE)2Eχ2=16699290051+(−20890)2116186+(−20884)2116186+154852149976=3096.7 + 3756.2 + 3754.0 + 1599.0=12,205.9
  • In mathemat-ese: With 1 degree of freedom for the transition contingency table (accounting for fixed margins), a χ2 value of 12,205.9 gives a p-value of 0.0.

  • In English: Ain't no way this is random or independent.
And as if this wasn't conclusive enough, there are other tests we could apply:
  • Static Tail Patterns: Looking closely at the end of the 48-bit sequences, a massive cluster of strings end explicitly in ...111101 or ...00111101. Additionally, bit position 46 is nearly always "1" (228 zeros vs 9619 ones, or 97.7% of the time it is "1"), position 47 is "0" (8958 of 9847 images, or 90.97%), and position 48 is "1" (found with 9696 images, or 98.5%) across thousands of uncurated, real-world images.

  • Structural Clustering: Certain bit columns share an extraordinarily high Mutual Information score (I(X;Y)). For example, knowing the output of bit position 12 gives you better than an 80% accuracy in predicting bit position 28.
The assumption of a "uniform distribution over arbitrary pictures" relies on the idealistic premise that random natural image features project uniformly across the decision boundaries of a network. However, because the extraction network maps inputs to a constrained, highly continuous hyper-dimensional manifold, the network's latent layers natively enforce structural smoothness.

For the TL;DR crowd:
Meta's researchers made a fundamental mistake when computing their accuracy rates. It's not a "1 in 1 million" chance of a false match, it's closer to 1 in 4 -- because the 48 bit values per signature are not independent.

As I re-read Meta's research paper, I realized that the statistical error wasn't an oversight; Meta's researchers explicitly acknowledged the problem. In their paper (Section 4.1), they wrote:
Second, we observed that W’s output bits for vanilla images are correlated and highly biased, which violates the assumptions of Sec. 3.1 [the section about independent statistical test methods].
In other words, they recognized that the extracted bits are not independent. Despite this, their published false-positive analysis still relies on the assumption that the bits are independent.

Widespread Problems

Knowing that Meta's accuracy rate is grossly inflated due to assuming bit-wise independence when there is none, I looked back over Google's and Adobe's papers for their own watermarks. Did Google's and Adobe's researchers make this same mistake?
  • Google's SynthID research paper talks in terms of True Positive Rates (TPR). They do make this same "bit-wise independent" mistake, but it's obfuscated in the paper. You can see the error in their Equation 3 (PDF page 8), where they assume there is a uniform (independent) distribution. Their paper hyperfocuses on the true positive rate and never addresses the false positive distribution. (Either they didn't know to look, or they knew and decided to not report it because it would expose a serious weakness in their solution.)

  • Adobe's TrustMark research paper also makes assumptions of independence. You can see this in their PDF with the binary cross-entropy loss in Section 3.1.4. This mathematically treats each bit position as an independent Bernoulli trial. (By definition, a Bernoulli process strictly requires independence.) In their experiments (Section 4.1), they wrote "At test time, every image is associated with a random watermark", but they never tested if the random watermarks were similar to each other.
This introduction-to-statistics mistake is found in all three of these invisible watermarking technologies. The detections produced by these systems are so unreliable that an analyst cannot determine whether a reported detection is real or a false positive, or whether a reported non-detection is genuine or a false negative.

It's also worth noting that, shortly after releasing Stable Signature, Meta developed another algorithm: Pixel Seal. (Not to be confused with my own Secure Evidence Attribution Label / SEAL technology.) Pixel Seal moves to a 256-bit payload to increase the capacity, and their related model, Chunky Seal, pushes up to 1024 bits. While Meta's approach focuses heavily on addressing the invisibility side using an adversarial-only discriminator, the underlying approach still uses a neural network mapping. Using more bits only exacerbates this flaw.

Potential Uses

Algorithms can have uses. For example, Meta, Google, and Adobe are training their own AI models on images that they encounter. To prevent poisoning their training sets, they want to exclude images generated by their own systems. In this regard, watermarking does help them. For example, if Meta excludes an extra 25% of images (from false positives), then they still have a lot of images that they can train on.

However, that same usage does not work with legal cases. For example, consider an insurance company. Most insurance claims today include photographic evidence. The company wants camera-original photos, but have to use whatever the customer submits. The problem is that there is a lot of insurance fraud. In theory, seeing a watermark from an AI system like Meta, Google, or Adobe, should be great for identifying and ruling out fraud. Unfortunately, Stable Signature, SynthID, and TrustMark are so inaccurate that none of them can be trusted; it's not even worth testing to see if customer photos contain these invisible watermarks.

For these watermarking systems, I'm talking about very high error rates: roughly 1-in-4 for Meta, 1-in-5 for Adobe, and 1-in-20 for Google. But let's pretend that they work much better, like a 1-in-20,000 false positive rate. An insurer processing 100,000 claims per month would expect to accuse around 5 completely honest customers of fraud each month. Falsely denying 5 out of 100,000 claims? That creates a toxic customer service nightmare, severe legal liability, and fines from regulatory bodies for bad-faith claim denials. This could even become a class-action lawsuit that they couldn't win.

As bad as it is for insurance and financial institutions, there are much higher stakes at play. The EU AI Act (Article 50(2)), China's GB 45438-2025, California SB 942, and similar legislation are moving toward mandating AI content watermarking.

The failure of these three leading systems, from three Fortune-500 companies, to meet their own claimed accuracy rates is not just an academic curiosity. Regulators and courts will employ these systems for attribution and fraud detection. Reliable AI-based watermarking technology is not ready.

Three companies. Three algorithms. Three different research teams. The same fundamental error. The false positives won't go on trial. People will.
❌