Many of the image formats we’re familiar with have been around for decades. We all know JPEG and PNG like the back of our hands, and GIF even had a bit of a resurgence when tiny annoying looping animations became cool again on social media. There has been a growth in newer formats, though, like WEBP, and AVIF, with various platforms and software companies adopting them for greater efficiency, performance, and image quality.
Amongst the new crop of formats vying for relevance is JPEG XL. It was touted as a format that improved on what JPEG could do in the lossy compression space, while also adding on a lossless mode. There were grand hopes that it would become a universal replacement for all existing raster formats on the Web. A major problem was that Google was seemingly against it, only to backflip—with the format now slated to hit the big time with renewed backing from the search giant. So what’s going on?
Got You JPEG’d
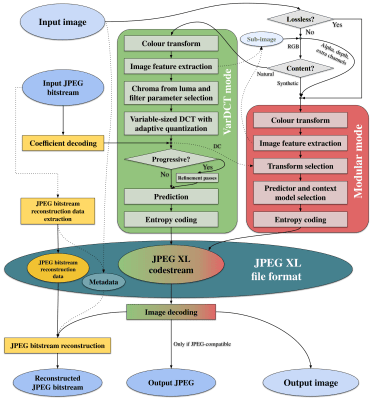
The JPEG XL codec architecture. Credit: Jon Sneyers, CC BY SA 4.0
The JPEG XL standard is modern, but by no means brand new. It was initially released on 13 October 2021, having been developed by a consortium of the Joint Photographic Experts Group, Google, and Cloudinary. It was deveoped from earlier work from Jon Sneyers on the Free Universal Image Format (FUIF), and work from Google on the PIK format.
It was decided the resulting format would use the *.jxl file extension. The spec defined a format with a wide range of features well beyond what classic JPEG ever offered. It has lossless compression, including for the alpha channel, but also lossy compression available in different modes to suit both photographic and synthetic imagery.
It remains fast to decode—almost as fast as JPEG and much quicker than HEIC with x265. A key future proofing feature is that it can also handle 32-bit sample precision, and images with over a billion pixels per side—that’s a terapixel, if you’re playing along at home.
The JPEG XL logo, which pretty much solely exists for people who need an image for their article about JPEG-XL. Credit: Joint Photographic Experts Group
A wide range of major tech companies have backed the standard in the years since it dropped, from Meta, to Adobe, Intel, and Flickr. While it might seem like Google was fully onboard from the get-go, having literally been involved in development of the standard, the history is more complicated, as reported by TT Lab.
Chromium implemented a libjxl-based decoder all the way back in 2021, which seemed to signal JPEG-XL support would soon be a thing in Chrome and other products besides. However, soon enough, there was a change in direction. In late 2022, it was slated for removal, with a notice that ecosystem support wasn’t great enough to justify continued efforts to bring JPEG-XL into the fold.
In Chrome 110, there was no trace left—JPEG-XL was not going to be a part of things. And yet, in the years that followed, debate raged on the Chrome issue tracker as to whether the nascent format would earn its inclusion. Elsewhere, JPEG-XL was struggling to find a footing. Apple rolled it into Safari in 2023, while Mozilla continued to hedge, noting that including another C++ image decoder was undesirable for reasons around memory safety.
A screenshot of an Android media app displaying a *.jxl image. Credit: Syced, CC0
New movement happened in November 2025, when Rick Byers, Area Tech Lead on Google Chrome, noted that the landscape had shifted. He posted that in light of JPEG-XL support being added to things like the PDF format and Safari, amidst other signals of support in the wider ecosystem, that the development team would be open to “integrate a performant and memory-safe JPEG XL decoder in Chromium.”
With Chrome having over 65% of the browser market, this would be a game changer for the format and likely see its adoption skyrocket across the web. It just needed to actually be implemented. However, Byers was careful to note that the inclusion of the new format would be contingent on a commitment to long-term maintenance of the decoder.
Things moved fast, and when Chrome 145 dropped in February this year, JPEG-XL was on the docket. This was thanks to the development of the jxl-rs decoder, which was implemented in Rust. This was an intentional decision for security reasons, with Google relying on the Rule of 2 to keep its browser safe. However, the new decoder was not activated by default. It would take another half a year or so before the new format would become a mainstream part of Chrome, rather than being hidden behind an experimental flag or anything like that. As of Chrome 155, though, JPEG-XL will be fully supported in the browser.
Don’t expect to see a ton of *.jxl files out on the wider web immediately. However, with the new format offering 30-50% better compression than JPEG, it will be appealing to just about any content provider looking to slimline data budgets and improve page loading times. When the performance gains start boosting traffic to a degree that makes up for the loss of users from older non-compliant browsers, expect to see things changing more quickly.
What does it mean for you, the end user? Probably little more than some minor headaches. You’ll struggle here and there when you download a *.jxl and try and load it into older software that doesn’t support it. You might get a device that shoots pictures in JPEG-XL and then find you can’t upload them to an older website with an out-of-date image submission form.
It’s the same problem we’ve all dealt with as HEIC, AVIF, and WEBP have started bouncing around the web, and we’ll have to weather it again. At least, at the end of the day, we’ll have slightly prettier images that take up a little less space. It’ll all be worth it, to be sure.
The base model—without thrusters or the flight system—will likely cost several times that amount to buy. “I’m going to do everything in my power to get the flying one,” says one customer.
Bridges! We kind of expect them to just be there and do their job, ad infinitum. They are built into the landscape, and we often take them and the routes they open up for granted.
The reality, as any civil engineer will tell you, is that bridges are living, breathing things that require endless maintenance and monitoring to keep them safe, standing, and functional. A great example of this is found in the US Department of Transportation, and its publicly accessible register of bridge health reports.
Stay Standing
The thing about bridges is that we rely on them. They serve as vital transport links in our communities, ferrying people to and from work and school, and acting as the very arteries of commerce as trucks and trains haul goods to and fro. When a bridge crossing has to close, either for maintenance or at end of life, this link is severed, often with serious economic and logistical impacts. For that reason, we tend to like to keep our bridges in service as long as possible. The result, of course, is that if pursuing this goal means that proper maintenance and repairs aren’t seen to, there is a risk of collapse—which often comes with worse consequences. Loss of life is common when bridges fail, and replacing a collapsed bridge is often much harder and more time consuming than handling things properly ahead of time.
In the United States, it’s a well known fact that the bridges are getting old. The average bridge is 44 years old, which is bumping up against the 50-year service limit many were originally built for. Being an average number, it’s indicative that many bridges are exceeding that figure significantly. Obviously, a bridge’s age isn’t a perfect proxy for its condition, but closer examinations indicate there’s definitely a problem. A 2024 report from the American Road & Transportation Builders Association noted that 36 percent of US bridges are in need of repair or replacement, a total of 221,800 spans. 42,067 spans were considered to be in “poor” condition, which in their total see 168.5 million motorists crossing them every day. It’s a particularly sobering figure as it highlights the size of the disaster possible if these structures are to fail.
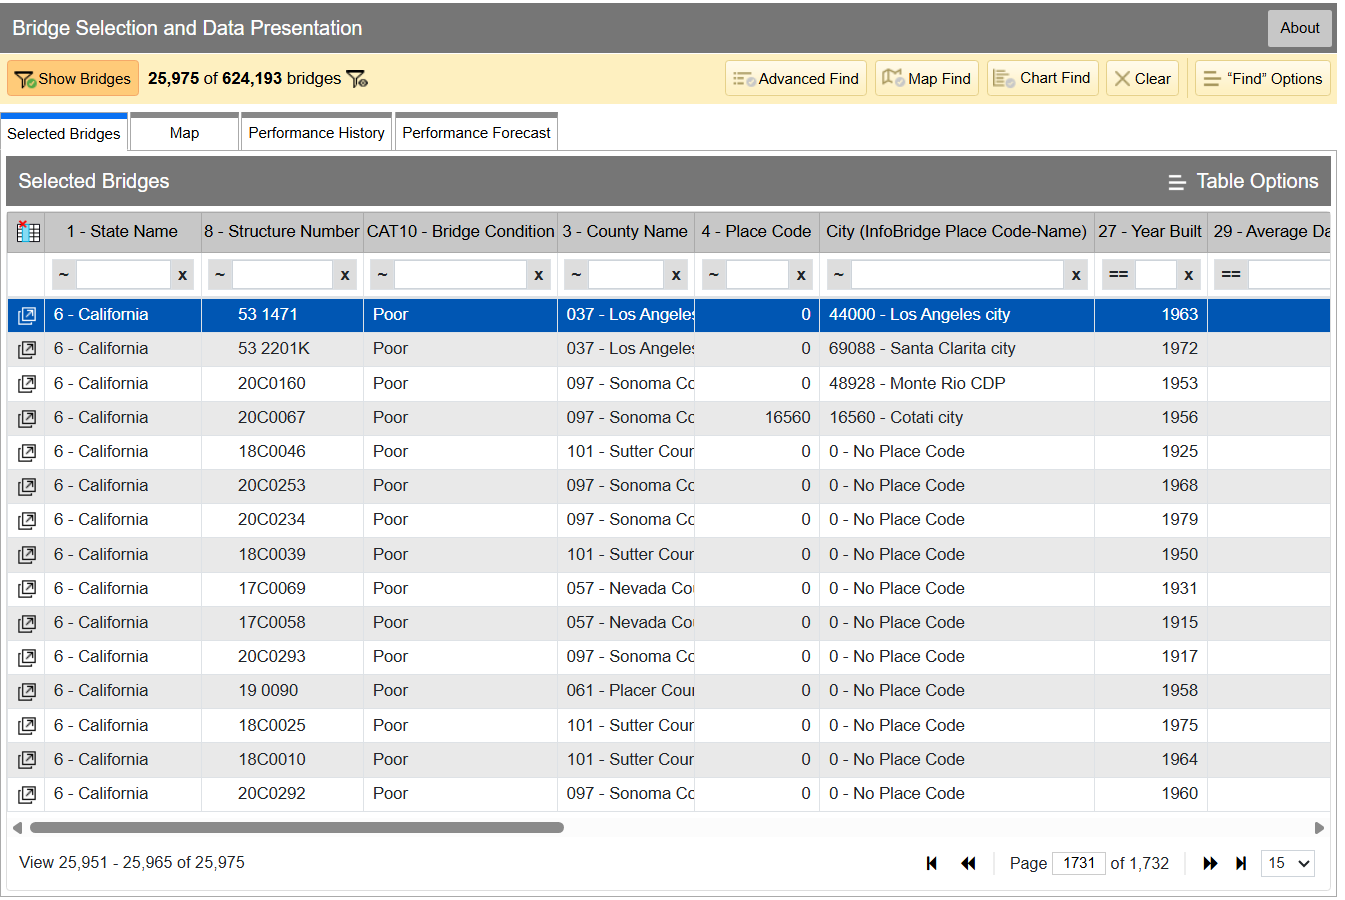
InfoBridge quickly lets you sort through data by all kinds of different factors. If you’re looking for the worst bridges in town, it’s easy to flick through CAT10 – BRIDGE CONDITION to see which bridges as listed as Good, Fair, or Poor. Bridges are rated on the condition of their deck, superstructure, and substructure, and the lowest scoring section influences which bin the bridge lands in, as per federal code—specifically, 23 CFR 490 Subpart D. Credit: InfoBridge screenshot
You can drill down into the data yourself if you desire. Within the Department of Transport, the Federal Highway Administration maintains LTBP InfoBridge, a database of information on bridges all across the country. It was developed by the Long Term Bridge Performance program, because the goal of the project is to understand how these structures hold up and perform over the decades. The database is publicly accessible, and serves as a portal for all the available data and statistics on how US bridges are doing. It hopes to enable everyone from state and federal authorities, to university students, faculty, and other researchers, to dive into bridge data and visualize and understand it better.
Data available is from a wide number of sources, including the National Bridge Inventory and National Bridge Element datasets, as well as climatic data collected from NASA’s MERRA-2 database. There’s also construction and design data sourced by the LTBP program, along with non-destructive evaluations that have been carried out. Data from various other special projects is available too, such as from Federal Highway Administration projects investigating timber bridges, steel weathering, and the use of ultra-high performance concrete structures.
Just glancing at the Vincent Thomas bridge won’t tell you how the structure is doing. Credit: The Port of Authority, CC BY-SA 3.0
If you have a particular bridge of interest, it’s easy to get a quick break down of how it’s doing. For example, you might like to know about the Vincent Thomas Bridge, in Los Angeles, California: National Bridge Inventory number 53 1471. It links San Pedro with Terminal Island, and is a suspension bridge with a total length of 6,060 feet and a longest span of 1,500 feet. Built in 1963, we can see from the data alone that it’s now showing its age.
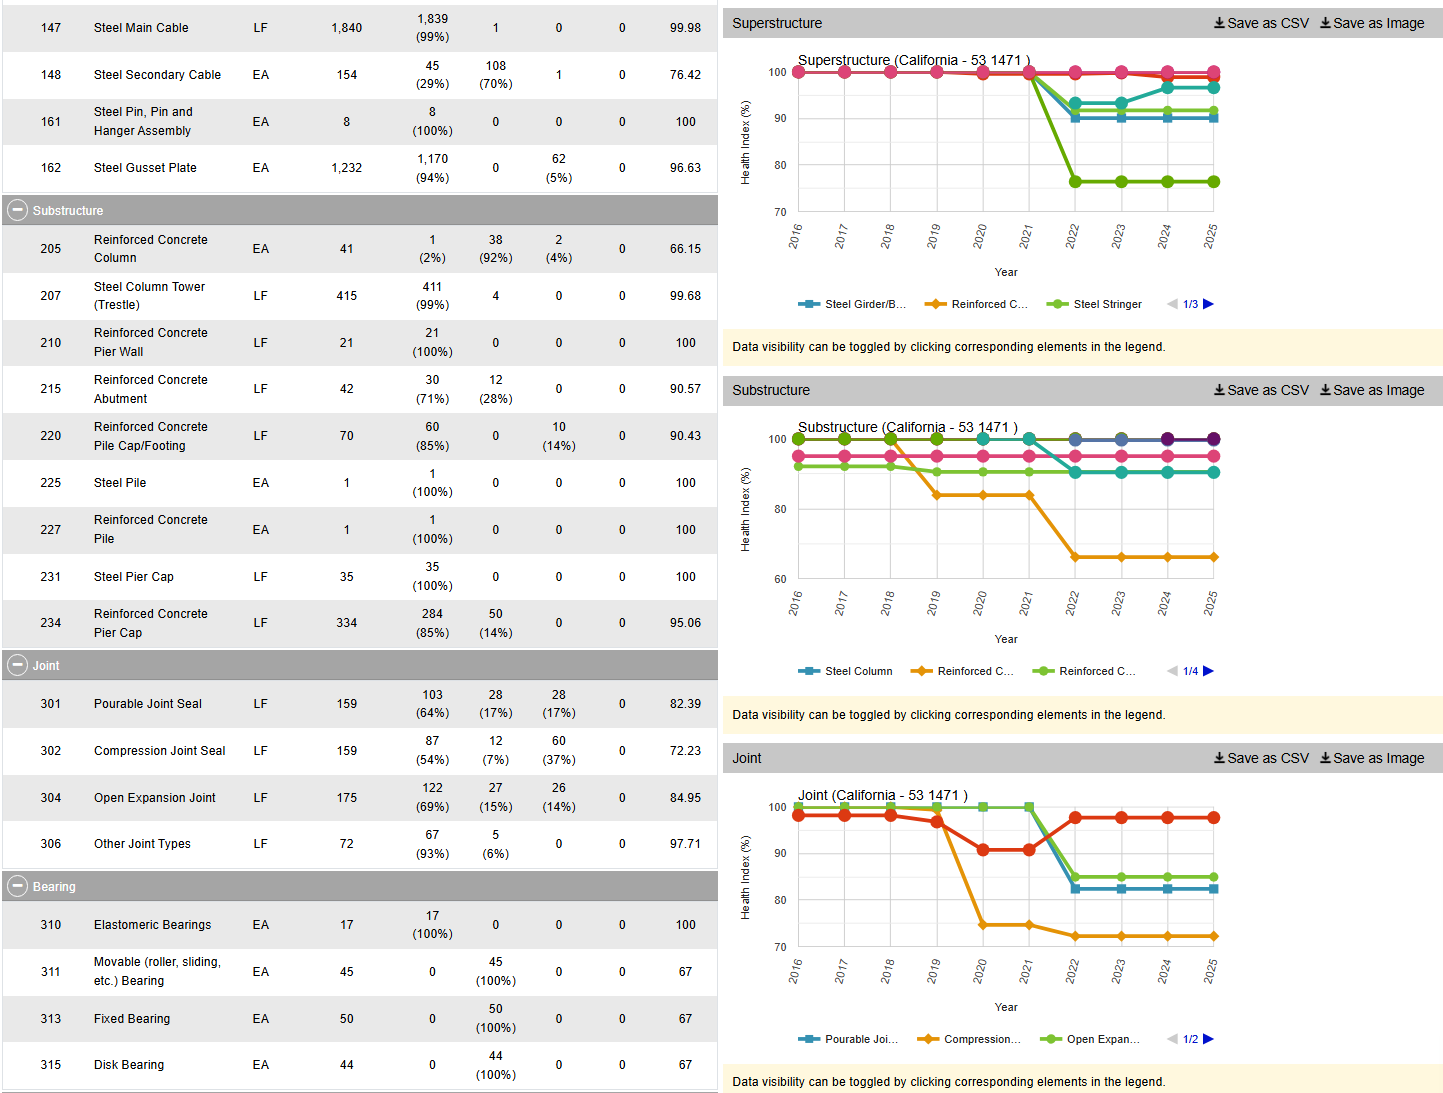
The bridge condition is listed as “Poor,” and if we dive deeper into the National Bridge Elements data, we can see why. The health indexes of the deck, substructure, and superstructure have all been trending down in recent years as the bridge’s age has increased, with a particular drop off from 2019 or so. In particular, the steel cables and girders on the bridge have been showing their age, and the concrete columns supporting the bridge have been similarly degrading. The deck, too, is in need of repair, with the California Department of Transport recently dedicating some $706 million to replace it ahead of the 2028 Olympic Games.
However, InfoBridge will let you drill down into detailed reports on the bridge conditions, down to a level which indicates which parts of the bridge are most in need of maintenance, repair, or replacement. Credit: Screenshot, InfoBridge
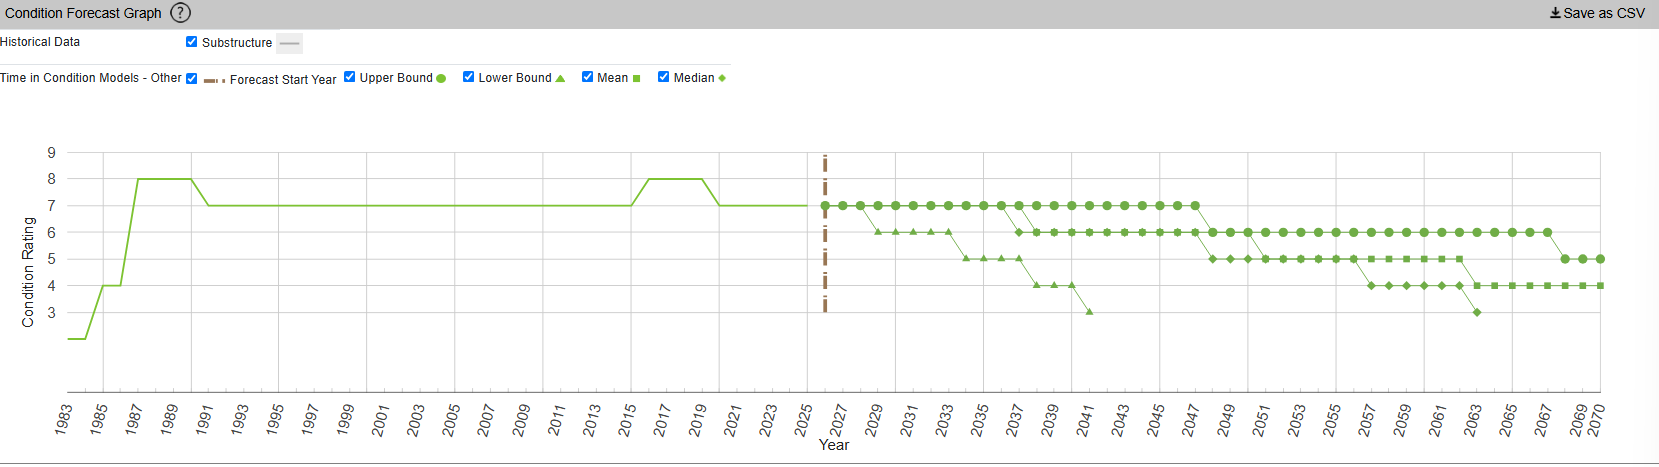
InfoBridge also offers condition forecasts for many bridges across the country. For example, the 24th Street Bridge over Rio Linda Creek is currently listed as being in “Good” condition. Current forecasts show that the deck and superstructure is expected to be in much poorer shape somewhere between 2035 and 2055, while the substructure is expected to hang on in good shape for a bit longer.
The Long Term Bridge Performance Program has developed a variety of models—base, survival, and machine-learning—to predict bridge condition over time. The aim is to guide maintenance efforts over time and allow for better planning. Credit: InfoBridge, screenshot
You might think that you’d have to query a government department and delve deep into some dusty records room to learn about the condition of your local bridges. Instead, thanks to the efforts of diligent civil servants, you can instead access all the rich inspection data you like from the comfort of your own web browser. It’s not just good for citizen oversight, either. It aids local authorities and bridge owners in making the right decisions, by putting the necessary data right at their fingertips.
It also creates a certain level of accountability—having the data available means there’s little room for anyone to make excuses that they were unaware of a bridge’s condition prior to something going wrong. Ultimately, it’s just one arm of a project that hopes to take US bridges safely long into the future.
WIRED attempts what even the Swedish brand hasn’t: making a sonic monolith using scores of the cheapest Bluetooth speakers on the market. Can you have too much of a small thing?
Apple’s first folding phone is inspiring indie developers to create fun, quirky apps that take advantage of the screen and the hinge. Here are a few to try as you explore the Duo.
My Google Home Speaker had been burning through more data than all the rest of my devices combined. As I looked into it further, I found other smart home devices that had the same problem.
Humanity has been sending robotic explorers to Mars since the 1970s, and for our efforts we’ve been rewarded with not only incredible imagery of the Red Planet’s magnificent desolation, but a wealth of information about the alien world and how it’s changed over the last several billion years. But comparatively, we know almost nothing about the planet’s two moons, Phobos and Deimos. In fact, as recently as the 1960s, there were some scientists that believed the unusual shape, mass, and orbit of Phobos hinted at the possibility that it was no moon at all, and was in actuality a derelict spacecraft of some type.
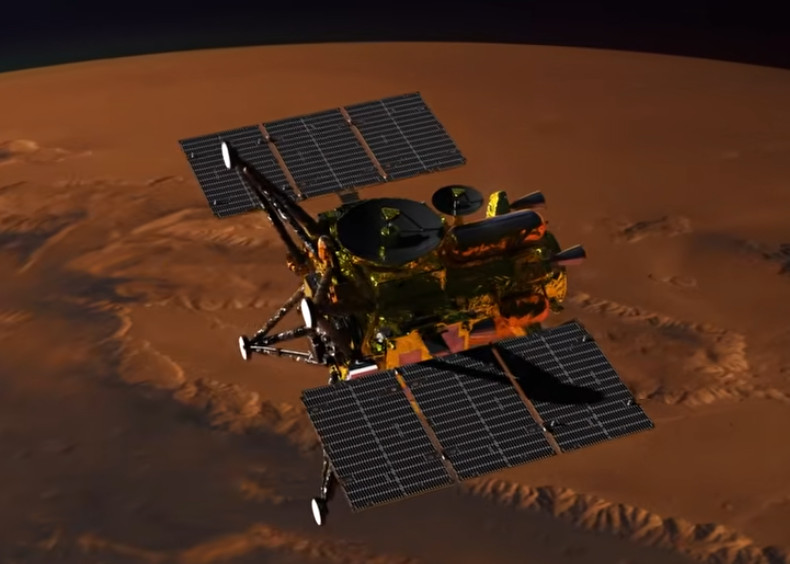
Martian Moons eXploration Spacecraft
Once the first Viking probes arrived at Mars, we had the photographic evidence and up-close measurements to prove that Phobos wasn’t artificial. But even today, we still don’t know exactly what it is. The data suggests that it’s not solid rock, and that large voids may be hiding under its surface. While we can be fairly sure there won’t be any mummified remains of Martian astronauts to be found within Phobos, vast deposits of ice are a tantalizing possibility.
With the launch of the Martian Moons eXploration (MMX) mission earlier this week, the Japan Aerospace Exploration Agency (JAXA) hopes to bring us one step closer to understanding the formation and structure of Phobos. Should everything go to plan, MMX will deploy a small rover to its tenuous surface in 2029, and by 2031, a sample return capsule will bring pieces of the mysterious moon back to Earth for further study.
A Delicate Operation
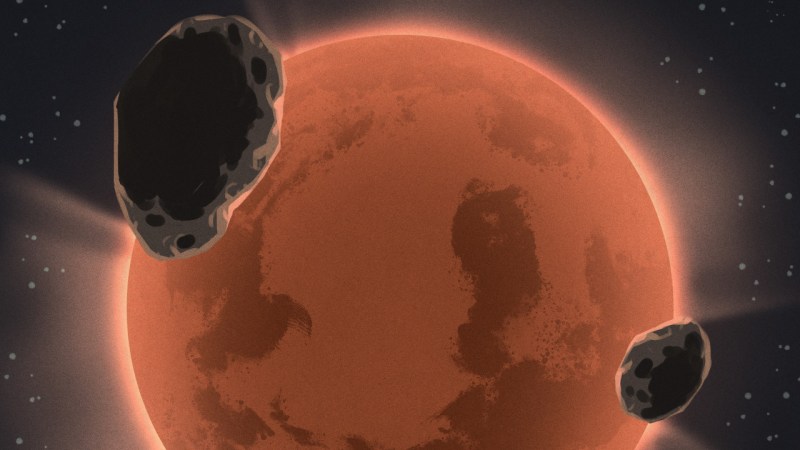
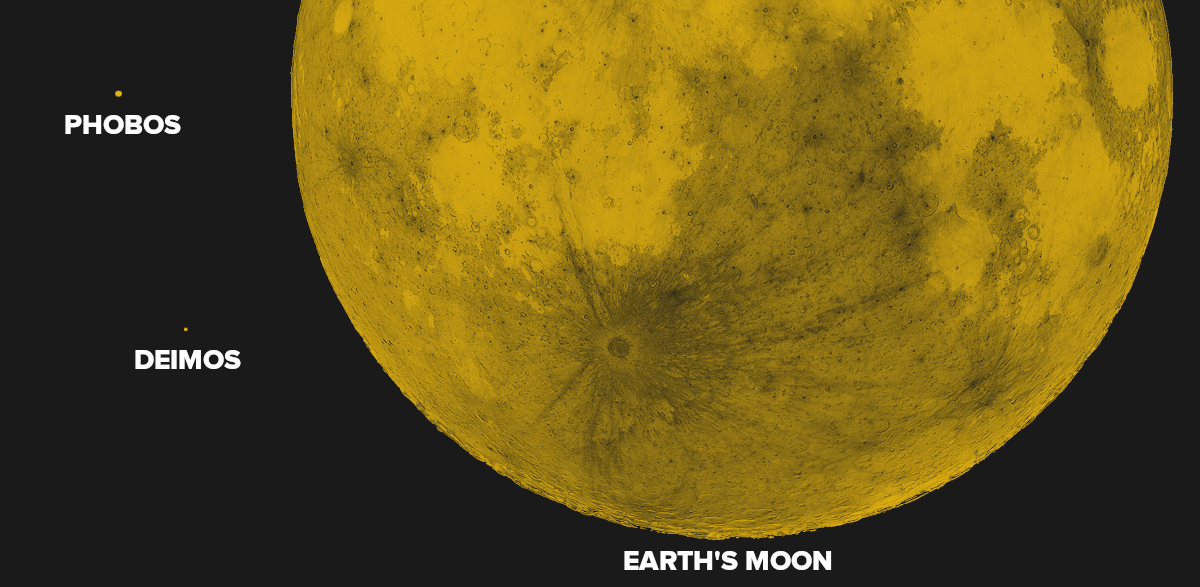
It’s only natural that we’d imagine Phobos and Deimos to be similar to Earth’s moon, but the reality of the situation is very different. For one thing, the Martian moons are absolutely dwarfed by our nearest celestial neighbor. Phobos has a diameter of just 22.2 kilometers (13.8 miles), and Deimos is even smaller at roughly 12.6 km (7.8 miles). For reference, Luna is approximately 3,474 km (2,159 miles) across.
Due to their low mass, putting a spacecraft into a stable orbit around either of the Martian moons isn’t really an option. Some clever maneuvering will put the MMX mission within range of both Phobos and Deimos at different points during the mission, but it won’t be able to stay around for long.
As such, final approach to Phobos will look more like a slow-motion “crash” than a traditional landing. A close comparison would be the OSIRIS-REx mission, where the spacecraft effectively “bumped” into the asteroid Bennu while collecting its samples. The impact velocity will need to be very low to prevent the spacecraft from bouncing off, and even then, some reports indicate that JAXA expects the craft to make at couple of hops before finally settling down.
The situation is compounded by the fact that we still don’t know what the surface conditions are like on Phobos. Based on previous observations, it’s expected that the moon is covered with a layer of fine regolith that could make traversal difficult for the mission’s Idefix rover. Indeed, one of the rover’s primary mission goals is to determine if wheeled motion in such an environment is even viable.
Tiny Moon, Huge Potential
Landing a crewed vehicle on Mars and successfully bringing it back home afterwards is perhaps the most daunting engineering challenge ever conceived. There’s even a solid argument to be made that it’s currently beyond our technological capabilities. The energy requirements of making a propulsive landing on the planet and then lifting off and getting back into orbit are enormous, and will very likely require in situ propellant production to refuel the craft between the two phases of the mission.
Landing on Phobos or Deimos however would require a small fraction of that energy. Moreover, due to their low orbital altitude, the moons would make ideal outposts from which to make detailed observations of Mars. This close proximity to the planet also means human operators on Phobos could directly command robotic vehicles on the Martian surface without the transmission delays that make real-time telerobotics from Earth impossible. While such a mission might not have quite the same symbolic impact of actually putting boots on Mars, it could be a valuable stepping stone towards that eventual goal.
The viability of such a landing may well depend on the findings of Japan’s Martian Moons eXploration mission. Not only in terms of the actual mechanics of rendezvousing with Phobos and touching down on it, but should the mission succeed in returning surface samples, we may be able to confirm whether or not the moon is made from ejected Martian material. Should that be the case, there will likely be even greater interest in studying the planet’s strange little moons up close.
 Login





 Don’t expect to see a ton of *.jxl files out on the wider web immediately. However, with the new format offering 30-50% better compression than JPEG, it will be appealing to just about any content provider looking to slimline data budgets and improve page loading times. When the performance gains start boosting traffic to a degree that makes up for the loss of users from older non-compliant browsers, expect to see things changing more quickly.