
 Login
Login
Crypto Market Q2 2026: Bitcoin Correction, Institutional Pressure, and Signs of Accumulation
ETF outflows, Fed pressure, and treasury stress collided with record BTC long-term holder accumulation.

Bitcoin investors just experienced one of the most confusing quarters of 2026.
BTC fell nearly 14%, ETFs recorded billions in outflows, and macro liquidity remained tight.
Yet beneath the surface, something unusual happened: long-term holders accumulated aggressively while speculative activity collapsed.
1. Executive Summary
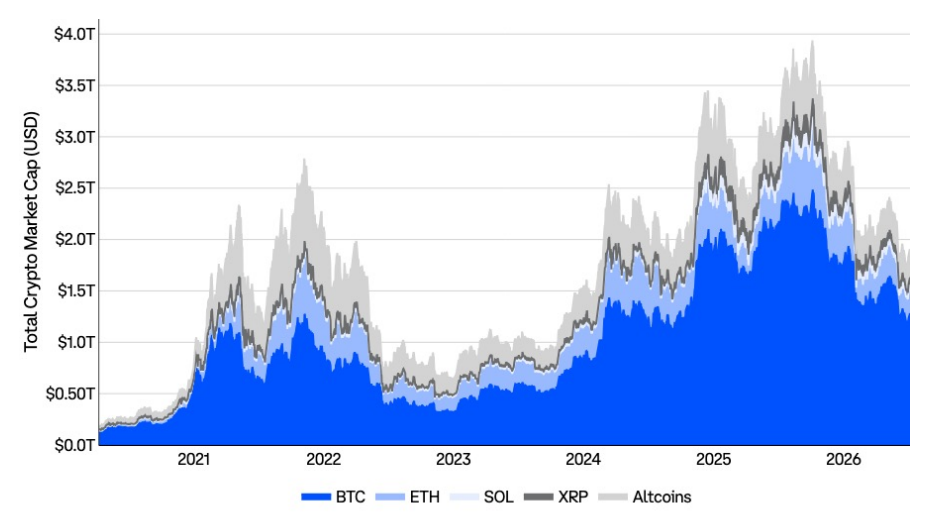
The second quarter of 2026 proved to be a challenging period for the digital asset market. Total crypto market capitalization (excluding stablecoins) contracted by approximately 12%, while the price of Bitcoin (BTC) declined by ~14%, closing June at $58,544.
Despite the price correction, underlying on-chain metrics point to an accumulation phase and seller exhaustion:
- The share of Bitcoin supply in a loss position surpassed the share in profit for the first time in the current cycle.
- Supply held by Long-Term Holders (LTHs) hit a new all-time high.
- The market faces pressure from tight Federal Reserve monetary policy and ETF outflows; however, macroeconomic fundamentals (productivity gains and strong CapEx) provide a constructive long-term backdrop.
2. Bitcoin (BTC): Technicals and On-Chain Metrics
Price Dynamics and Key Support Levels
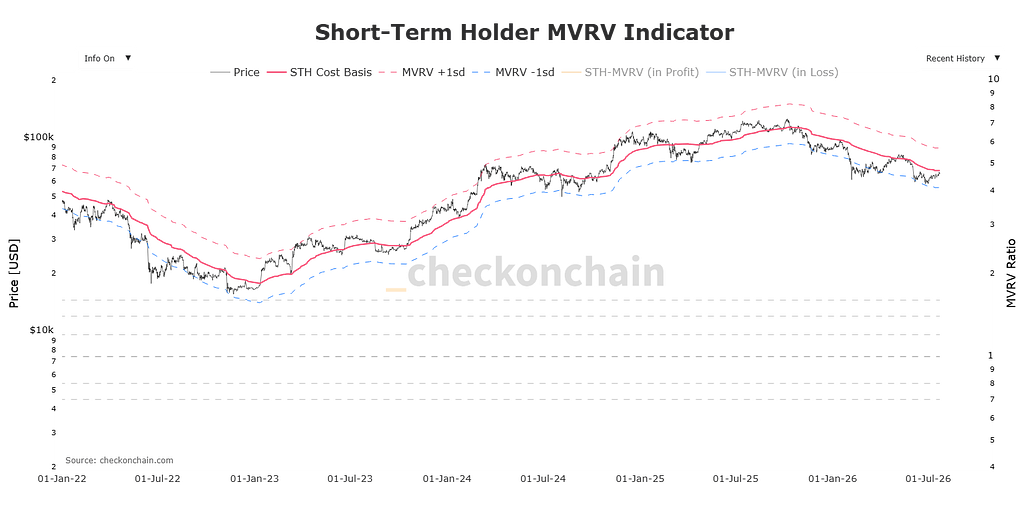
Throughout Q2 2026, Bitcoin was attempting an exit from its corrective phase. Despite a local push toward $82,186 early in the quarter, BTC closed June below all three of its primary moving cost-bases:
- Short-Term Holder (STH) Realized Price: ~$70,327
- 200-day Moving Average (200-day MA): ~$75,371
- On-Chain Mean: ~$76,660
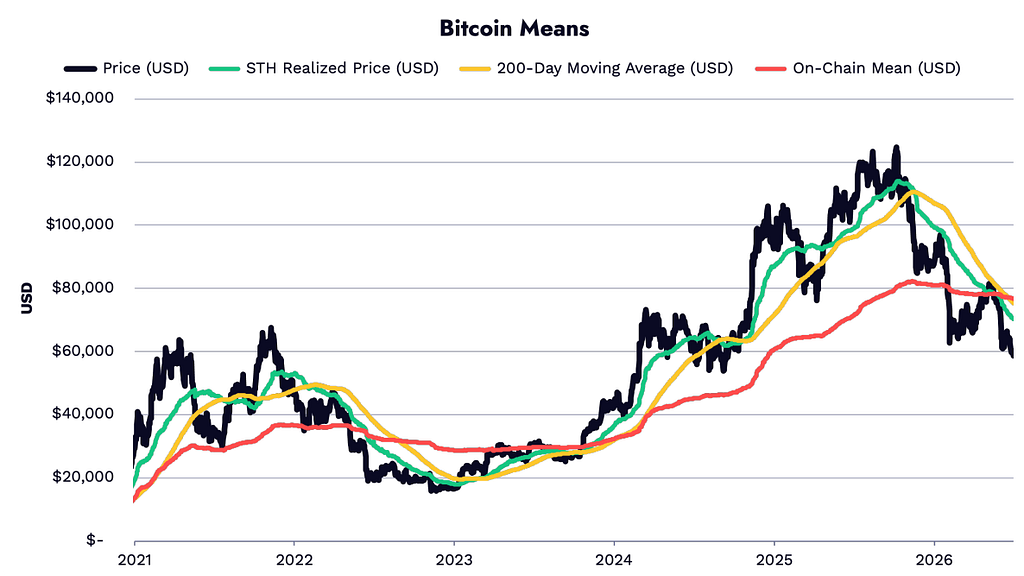
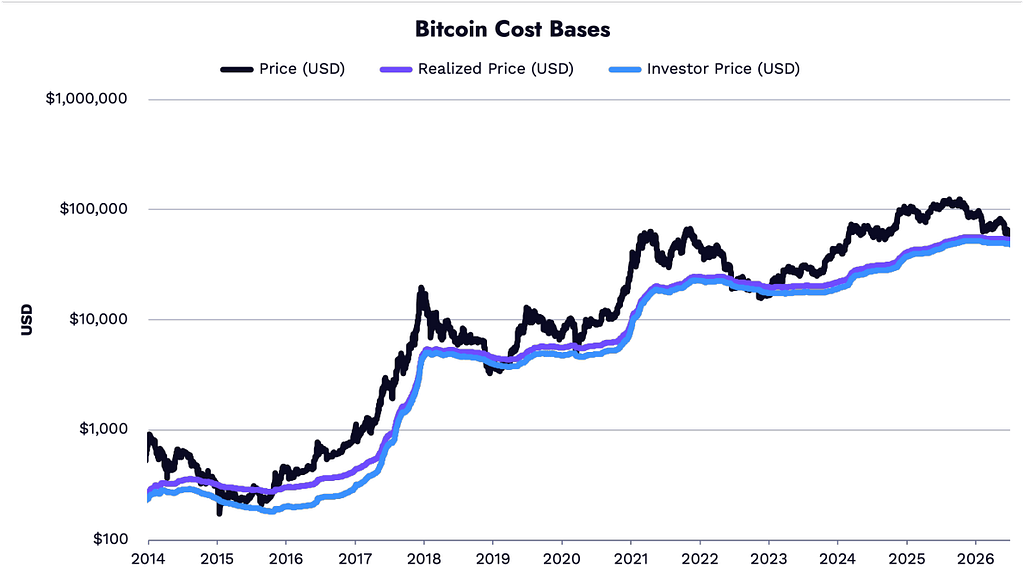
The shift of these levels from support to resistance confirms short-term bearish sentiment. However, the fundamental “floor” for this cycle sits in the $49,000 — $53,000 range (between the Realized Price of $53,135 and the Investor Price of $48,581).
Holder Behavior and Exhaustion Indicators
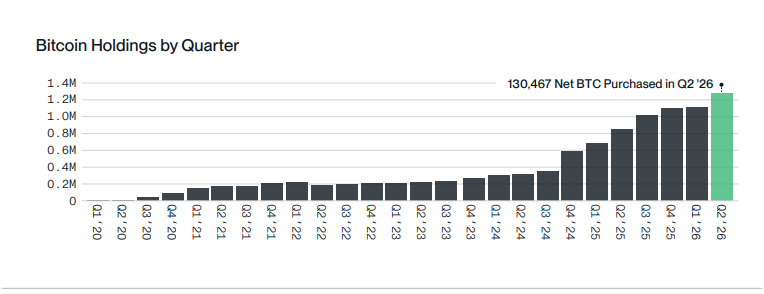
- Long-Term Holder (LTH) Record: Total BTC held by LTHs reached a record ~14.85 million BTC (+313k BTC during the quarter). Long-term investors actively absorbed circulating supply.
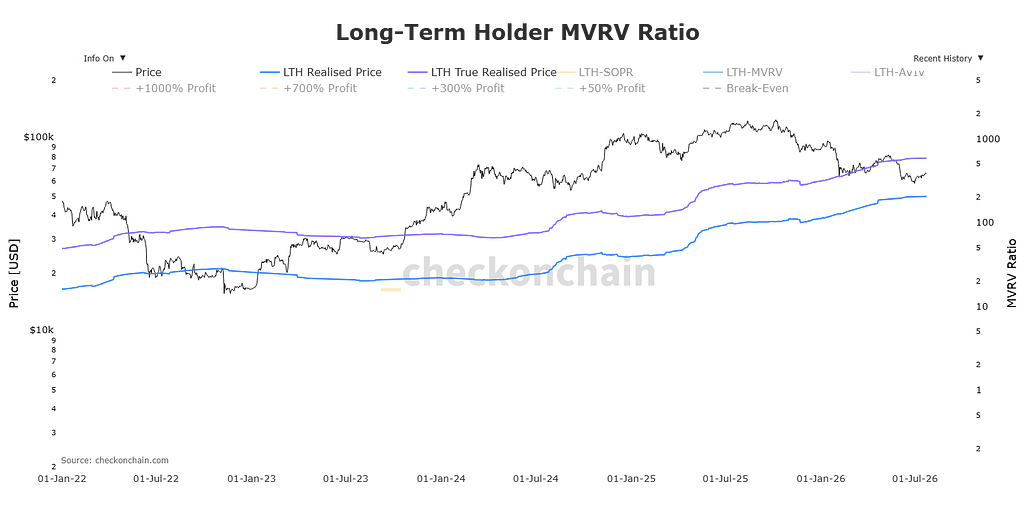
- Dormancy and Illiquidity: Supply last moved over 1 year ago continued to rise, whereas short-term speculative activity (coins moved within months) refreshed multi-year lows.
- Entity-Adjusted NUPL: Net Unrelized Profit/Loss shifted out of the “Optimism/Anxiety” zone down toward “Hope/Fear,” approaching the “Capitulation” threshold.
3. Ethereum (ETH) and Stablecoins Performance
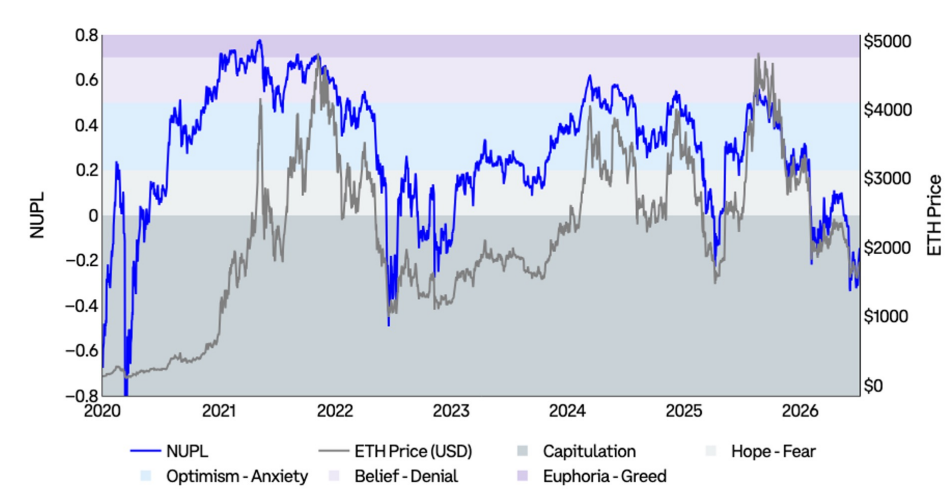
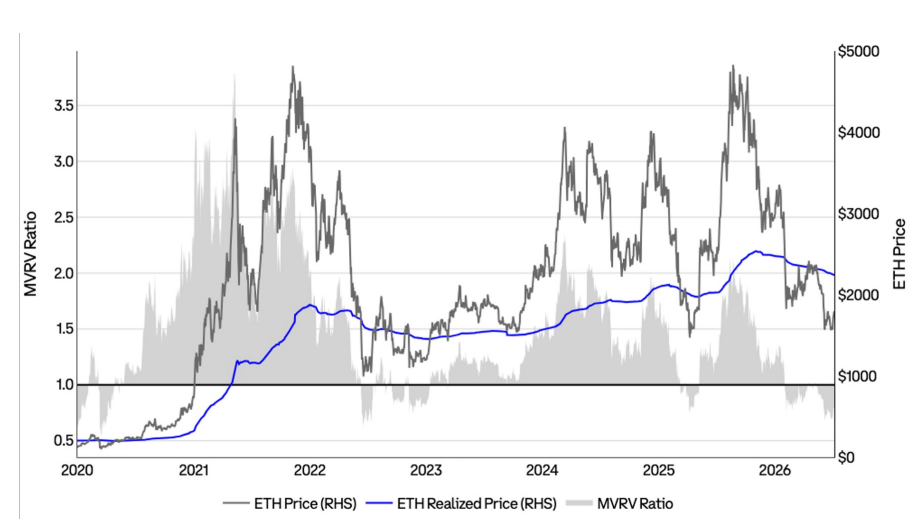
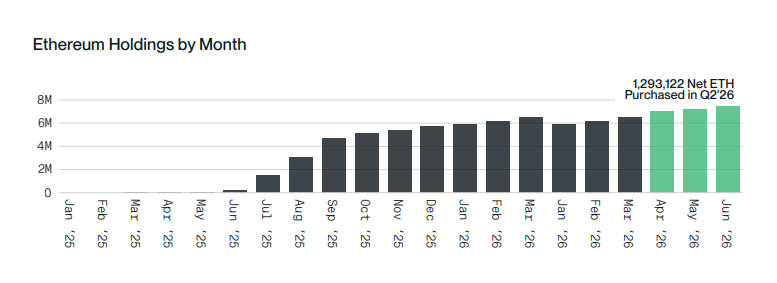
- Ether noticeably underperformed the broader market. Its NUPL dipped into the “Capitulation” zone, placing the average ETH holder in a net unrealized loss position.
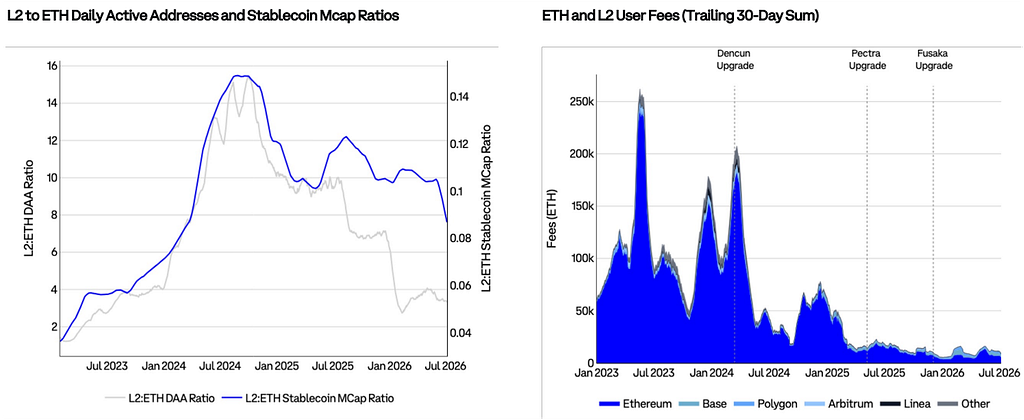
- On-chain data indicates a re-concentration of capital on the base layer (L1). Activity and stablecoin volume ratios on L2s relative to mainnet softened, though total Real-World Assets (RWA) and stablecoin balances on Ethereum proper remain near peak levels.
4. Institutional Flows, Derivatives
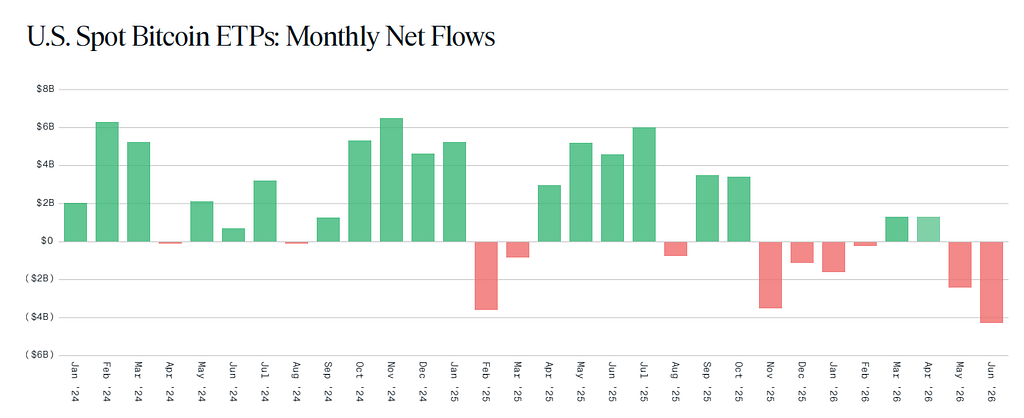
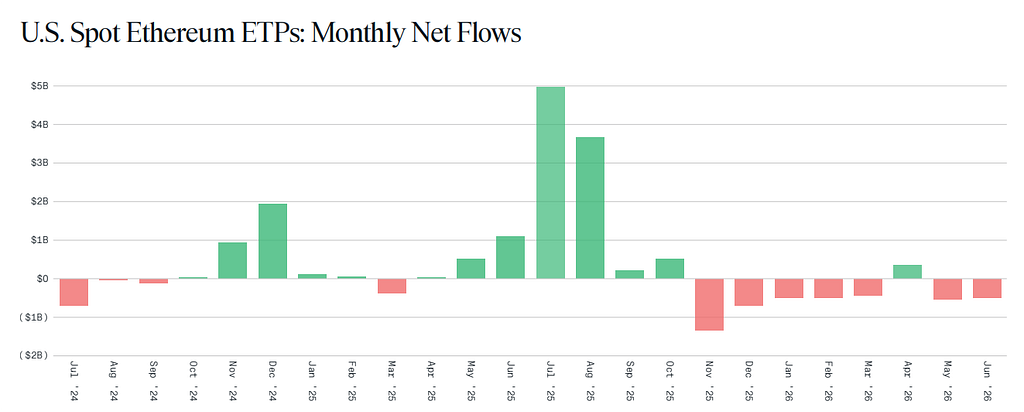
- US Spot BTC ETFs: Q2 saw 7 consecutive weeks of net outflows from US spot ETFs (~71,000 BTC total). June marked the worst single month on record, with around $4.5B leaving the funds. However, outflow velocity began to exhaust toward the end of the quarter.
- Pressure on Corporate Treasuries (DATs): Preferred stock yields and prices for treasury-heavy entities like Strategy (STRC) pulled back from the $100 par value down to $74.57. This indicates stress in corporate bitcoin reserve financing models and a rising cost of capital for leveraged treasury strategies.
- Derivatives Market: Open Interest (OI) in BTC futures stayed moderate, and the 3-month annualized futures basis hovered around 2.3%–2.7%. The absence of excessive leverage keeps market structure healthy, mitigating the risk of cascade liquidations.
Summary & Outlook for Q2 2026
The market’s mid-term outlook is currently rated as Neutral. While headwinds from tight macroeconomic liquidity and spot price pressure persist, key on-chain indicators signal the early stages of a bottoming process.
- Bullish Catalysts: Dovish shifts in Fed messaging, a return to net positive spot ETF inflows, and a decisive recovery of BTC above $70,000 — $75,000.
- Bearish Risks: Renewed heavy ETF redemptions, forced liquidations among corporate treasury strategies (DATs), and a retest of the lower fundamental cost-base between $49,000 and $53,000.
We are currently in the “purge” stage. The market is washing out weak players. Prices are low, but the fundamental news has never been better. History teaches us: when the news is great, but the numbers on the monitor are grim — that is the best time for those who look 3–5 years ahead.
Stay calm. The palace is being built right now.

More detail to: https://medium.com/@orlaresearcher/4d6c68fed6ee?source=friends_link&sk=f8292678c4a6a0185b58b9d72f62380e
Crypto Market Q2 2026: Bitcoin Correction, Institutional Pressure, and Signs of Accumulation was originally published in Coinmonks on Medium, where people are continuing the conversation by highlighting and responding to this story.


