Solana ecosystem tokens have outpaced the broader altcoin market in recent performance benchmarks, giving traders another reason to watch the network’s internal rotation rather than SOL alone.
That is the interesting part here. Solana is not just one token story anymore.
When the ecosystem is active, capital can move through memecoins, DeFi tokens, infrastructure names, liquid staking assets, wallets, launchpads, and consumer-facing projects. Sometimes SOL leads. Sometimes the smaller ecosystem tokens move harder.
The latest performance data points to that second dynamic.
For more details, visit the official Coingecko platform.
TL;DR
Solana ecosystem tokens have outperformed broader altcoin benchmarks.
The move shows rotation inside the Solana ecosystem, not just demand for SOL.
Performance data should not be turned into a future price prediction.
Solana Rotation Has Its Own Rhythm
Solana has become one of the most active retail ecosystems in crypto.
Low fees and fast settlement make it easier for traders to move quickly between assets. That can create intense rotation when sentiment improves. Capital enters SOL, then spills into ecosystem tokens, memecoins, DeFi apps, and other smaller plays.
This is part of what makes Solana exciting.
It is also what makes it risky.
When liquidity is strong, ecosystem tokens can run faster than the broader market. When sentiment fades, those same tokens can fall quickly.
That is why performance benchmarks need context.
Ecosystem Tokens Tell A Different Story Than SOL
SOL is the network’s main asset.
It reflects broad investor appetite for Solana as an ecosystem. But smaller Solana tokens can show where traders are taking more specific risk. They may point to attention around a particular app, sector, launch, or narrative.
That makes ecosystem performance useful.
If multiple Solana-linked tokens are outperforming, it can suggest that activity is spreading beyond the base asset. That often happens when traders feel more confident and start looking for higher-beta opportunities inside a strong chain.
Outperformance Is Not Always Quality
This is worth saying clearly.
A token outperforming does not automatically mean the project is strong. Some moves are driven by speculation, thin liquidity, incentives, listings, or social momentum. Solana’s ecosystem has plenty of serious builders, but it also has plenty of fast-moving risk.
So the data needs a careful read.
The useful point is that Solana-linked assets are attracting attention. The harder question is which parts of that attention are durable.
Why Traders Watch Ecosystem Breadth
Breadth matters in crypto.
If only one asset is moving, the rally can be narrow. If many tokens within an ecosystem are moving, the market may be showing deeper participation.
For Solana, stronger ecosystem breadth can support the idea that the network is not only benefiting from SOL demand, but from wider on-chain activity and speculation.
That can feed back into the main network narrative.
But again, it is not automatic. Performance needs to be paired with usage, liquidity, developer activity, and product traction.
The Market Signal
The latest benchmark shows Solana ecosystem tokens running ahead of the wider altcoin market.
That tells us traders are taking risk inside the Solana ecosystem again. It also suggests that the network’s internal market remains lively after a strong August.
The next test is whether the move spreads into real activity.
If trading volume, app usage, and liquidity support the price action, the ecosystem story gets stronger. If the move is mostly speculative, it may cool quickly.
Either way, Solana remains one of the main places where altcoin rotation is happening.
This article draws on CoinGecko Solana ecosystem performance data.
This article was written by the News Desk and edited by Samuel Rae.
This report is based on information released by Coingecko. at Coingecko
Dogecoin gained 21.4% in August, giving DOGE its strongest monthly performance of the year and putting the original meme coin back into the market’s rotation conversation.
CoinGecko market data showed DOGE recovering through the month as broader risk appetite improved across crypto. The move helped Dogecoin regain attention after a quieter stretch, but it should not be treated as proof that a sustained breakout is guaranteed.
This is a performance story, not a price target.
Dogecoin has shown renewed strength, but the market still needs to see whether buyers can hold the move once August’s momentum fades.
For more details, visit the official Coingecko platform.
TL;DR
DOGE rose 21.4% in August.
It was Dogecoin’s strongest monthly performance of the year.
The gain shows renewed momentum, not a guaranteed continuation.
Why The August Gain Matters
Dogecoin remains one of crypto’s most recognizable assets.
It has survived multiple cycles, built a deep retail base, and kept major exchangeliquidity even as countless meme tokens have come and gone. When DOGE starts moving again, traders often treat it as a signal that speculative appetite is improving.
A 21.4% monthly gain is not small.
It suggests buyers returned in size during August and that Dogecoin participated meaningfully in the broader market rebound.
That matters because DOGE can sometimes act as a barometer for risk appetite in large-cap meme assets.
Dogecoin Still Has A Different Market Profile
DOGE is not like most newer meme coins.
It has longer history, wider liquidity, stronger brand recognition, and a larger holder base. That makes it less explosive than some smaller meme assets, but also more durable during market cycles.
Its August rally shows that older meme assets can still attract rotation.
When traders move beyond Bitcoin and Ethereum, DOGE is often one of the first high-recognition names they revisit.
That does not mean it moves purely on fundamentals. Dogecoin remains heavily sentiment-driven. But sentiment is part of how meme assets trade.
A Monthly Gain Is Not A Trend Guarantee
The caution is obvious.
One strong month does not settle the next one. DOGE can rally sharply and still retrace if liquidity fades, Bitcoin weakens, or meme coin demand rotates elsewhere.
This is why the monthly gain should be framed as a recovery signal, not a forecast.
Traders will watch whether DOGE holds higher levels, whether volume remains active, and whether social interest continues after the performance headline passes.
Without follow-through, August may become a strong bounce rather than the start of a longer move.
Meme Coin Rotation Is Becoming More Selective
The meme coin market has changed.
There are now countless new tokens competing for attention. Some move faster than DOGE, but many lack its liquidity or staying power. That creates a split between older large-cap meme assets and newer high-risk names.
Dogecoin’s August performance shows it still has a place in that market.
It may not always deliver the wildest percentage gain, but it remains one of the most liquid ways for traders to express meme coin risk appetite.
The Clean Read
Dogecoin had a strong August.
That is the story. It reclaimed market attention, delivered its best month of the year, and reminded traders that DOGE is still part of large-cap altcoin rotation.
But the next step is confirmation.
If buyers defend the move and volume stays healthy, the August rally may become more meaningful. If momentum fades, DOGE may slip back into range-bound trading.
For now, Dogecoin has earned the market’s attention again. Holding it is the real test.
This article is based on public Dogecoin market data from CoinGecko.
This article was written by the News Desk and edited by Samuel Rae.
This report is based on information released by Coingecko. at Coingecko
Solana Mobile’s SKR token has become one of the strongest weekly performers among the top 200 crypto assets, putting the Solana mobile ecosystem back in the spotlight.
Market data showed SKR leading the weekly gainers list after a sharp move that outpaced most large and mid-cap tokens. The rally reflects renewed attention on Solana Mobile, which has become an important part of Solana’s consumer-facing strategy.
That said, performance rankings need careful framing.
A weekly gainer list shows momentum. It does not prove long-term adoption, sustainable user demand, or lasting token value. SKR now needs product traction to support the market attention.
For more details, visit the official Coingecko platform.
TL;DR
Solana Mobile’s SKR token ranked among the top weekly gainers in the crypto top 200.
The move renewed attention on Solana’s mobile ecosystem.
A strong weekly gain is not proof of durable adoption.
Why Solana Mobile Matters
Solana Mobile is one of the more unusual ecosystem bets in crypto.
Most chains center on wallets, DeFi apps, exchanges, and developer tools. Solana has also pushed into hardware and mobile distribution, trying to make crypto more accessible through consumer devices and app experiences.
That is a difficult strategy, but potentially powerful.
If mobile users can access wallets, payments, apps, and token experiences more smoothly, Solana could build a distribution channel that does not depend entirely on desktop wallets or centralized exchanges.
SKR’s rally brings that thesis back into view.
Token Momentum Can Move Fast
Crypto market rankings can change quickly.
A token can enter the top gainers list because of product news, speculation, liquidity shifts, exchange listings, ecosystem incentives, or social momentum. In SKR’s case, the Solana Mobile connection gives traders a clear narrative.
Mobile crypto remains a category with huge ambition.
The question is whether the market is pricing actual adoption or simply chasing a fresh ecosystem story.
That distinction matters.
Consumer Crypto Is Still Hard
Building consumer crypto products is not easy.
Users need simple onboarding, safe wallets, useful apps, strong security, and reasons to return. Hardware adds another layer of complexity: manufacturing, distribution, support, app compatibility, and developer interest.
Solana Mobile is trying to solve some of those problems.
But token performance alone does not prove the device or ecosystem has solved them.
Market excitement can arrive before user behavior confirms the thesis.
Why Traders Are Watching SKR
SKR gives traders a way to express a view on Solana’s consumer layer.
If Solana Mobile gains traction, the token may benefit from ecosystem activity, user growth, or product demand. If mobile adoption disappoints, the rally may fade.
That makes SKR more specific than SOL itself.
SOL represents the broader Solana network. SKR is tied more closely to one consumer-facing vertical inside that ecosystem.
That can make it move more aggressively in both directions.
What Comes Next
The next test is whether Solana Mobile can convert attention into usage.
Traders will look for device demand, app activity, wallet usage, developer adoption, and any official ecosystem updates. Without those, SKR’s weekly gain may remain a market momentum story rather than a product adoption story.
For now, the token’s surge shows that Solana’s mobile strategy still has market attention.
The challenge is turning that attention into a working consumer crypto ecosystem.
This article is based on public market data for Solana Mobile’s SKR token.
This article was written by the News Desk and edited by Samuel Rae.
This report is based on information released by Coingecko. at Coingecko
The TON Foundation has confirmed that its legacy bridge will be permanently decommissioned on September 1, setting a deadline for users holding wrapped TON and related bridge assets to move back to native forms.
The shutdown affects bridge-v3.ton.org, according to TON materials. Users holding Wrapped TON as an ERC-20 token on Ethereum or BNB Chain, or j-tokens such as jUSDT on TON, need to bridge assets back before the deadline to avoid losing access.
This is a planned infrastructure transition.
It should not be described as an exploit, emergency shutdown, or security failure unless official sources say otherwise.
TL;DR
TON’s legacy bridge will be decommissioned on September 1.
Wrapped TON and j-token users need to bridge assets back before the deadline.
The shutdown is planned and should not be framed as a hack.
Why Bridge Shutdowns Matter
Bridges are one of the most sensitive pieces of crypto infrastructure.
They connect assets across chains, but they also create operational risk. If a bridge is deprecated or shut down, users need clear instructions and enough time to move funds.
A missed deadline can be costly.
Tokens that depend on a bridge may become hard to redeem or move if users do not act before decommissioning. That is why bridge shutdown notices matter even when nothing has been hacked.
They are practical user-risk events.
Wrapped Assets Need Special Attention
Wrapped TON on Ethereum or BNB Chain is not the same as native TON.
A wrapped token usually depends on bridge infrastructure that locks or accounts for the native asset while issuing a representation on another chain. If that bridge is being retired, users need to unwind the wrapped position through the proper route.
The same logic applies to j-tokens on TON.
Users should follow official instructions, use the correct bridge interface, and avoid unofficial links or phishing attempts. Bridge transition periods often attract scammers because users are already expecting to move assets.
Planned Does Not Mean Unimportant
A planned shutdown can still create risk.
The risk is not necessarily technical failure. It is user coordination. Some holders may not see the announcement. Some may wait too long. Some may use the wrong interface. Some may misunderstand which assets are affected.
That is why the September 1 deadline is important.
TON’s ecosystem needs users to act before the legacy infrastructure is retired.
Why Networks Retire Bridges
Protocols may shut down old bridges for many reasons.
A bridge may be replaced by newer infrastructure, become expensive to maintain, no longer fit the ecosystem roadmap, or carry legacy risk the foundation no longer wants to support. Retiring old infrastructure can be healthy if the process is communicated clearly.
The key is migration.
Users need enough time and simple instructions to move assets safely.
What Comes Next
The next milestone is the September 1 deadline.
Until then, wrapped TON and j-token holders should confirm whether they are affected and use official TON channels to bridge assets back. After the deadline, access may become limited or impossible through the legacy route.
For TON, the shutdown is part of infrastructure cleanup.
For users, it is a deadline that should not be ignored.
Solana (SOL) is trading around $95 as of late August 2026, roughly a third of its January 2025 all-time high near $296. After a brutal six-month losing streak that dragged the token down to the $60–$70 range earlier this year, SOL has stabilized in the $80–$100 range. Stick around until the end to see what price AI predicts Solana will be trading at by the end of 2026, after crunching all of the data and potential catalysts over the next few months.
The question now is whether it can break out, and the evidence from ETF flows, prediction markets, and trader sentiment points to a market that’s cautiously constructive but far from convinced.
SOL has been one of the top performers as the market rallied over the past week, led by Bitcoin soaring back toward $80,000. Solana surged +25% in the past week, with daily trading volume hitting $3.72Bn.
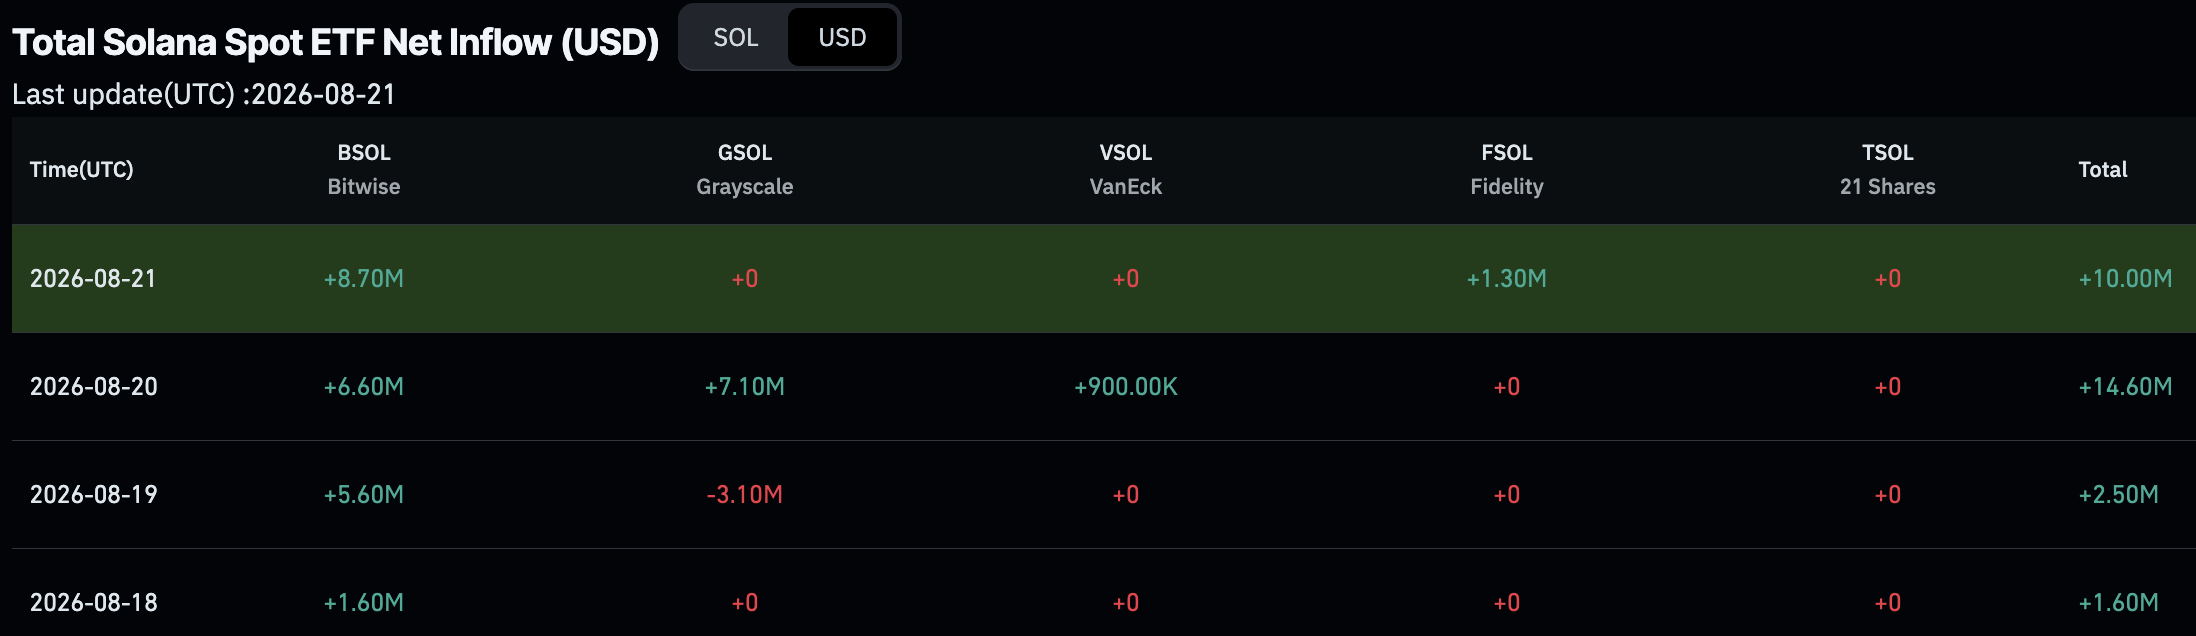
Spot Solana ETFs have pulled in roughly $1.4–1.5Bn in cumulative inflows since launch, a meaningful amount but a fraction of the inflows Bitcoin and Ethereum funds attracted after their own approvals.
Flows have kept trickling in even during price weakness, a sign of some sticky institutional demand, but they’ve clearly not been strong enough to offset broader risk-off selling.
Notably, Goldman Sachs reportedly exited its SOL ETF positions in Q1 2026, while SEC 13F filings show investment advisers now control roughly half of US spot SOL ETF assets, suggesting the buyer base is becoming more institutional even as the dollar amounts remain modest relative to SOL’s market cap.
What Kalshi Prediction Markets Say as AI Predicts Solana
Kalshi’s “Price of Solana by the end of 2026” contract is one of the more useful real-time gauges here. As of the most recent data, the market prices roughly a 42% chance SOL finishes the year at $100 or above, about 21% for $150+, and only single-digit odds for $250+ or $500+.
That’s a meaningfully more conservative view than many published analyst targets, and it has been range-bound and news-reactive, swinging on catalysts like stablecoin launches (Circle minting USDC on Solana, Coinbase/Flipcash’s USDF) rather than trending steadily in one direction.
Polymarket data has told a similar story, assigning relatively low odds to a run past $160. In short, the “smart money” aggregated in these markets is betting on modest upside, not a moonshot. AI predicts Solana
Published forecasts span an enormous range, from bearish models seeing SOL stuck near $60–$90 to bullish outfits like Standard Chartered anchoring a $250 target for 2026.
The more measured consensus, the kind you see repeated across multiple independent trackers, clusters year-end estimates in the $120–$160 area, with bull cases stretching to $250–$350 contingent on two specific catalysts.
These include the Alpenglow consensus upgrade (targeting ~150-millisecond finality, down from 12.8 seconds, expected Q3 2026) and wider Firedancer validator adoption (aimed at pushing validator client diversity past 50%, up from roughly 20–26%).
Traders on social platforms and crypto-news sites tend to frame 2026 as a “show me” year: Solana’s on-chain fundamentals, which briefly outpaced Ethereum in weekly revenue, lead in real-world-asset lending market share, and continue attracting stablecoin issuers, haven’t translated into price the way bulls expected, and that adoption-price disconnect is the dominant theme in trader commentary right now.
Now, let’s take a look at what AI predicts Solana could be trading at by the end of 2026 and how it compares with the data points discussed throughout this article.
IF $SOL macro bottom is in, THEN we are still early.
Last weekly buy signal price dropped -35% but then price increased 991%.
Weighing all three inputs, the base case for SOL by December 31, 2026 looks like a range of roughly $100 to $160, with the token needing a genuinely positive Alpenglow rollout and a reacceleration of ETF inflows to break meaningfully above that level.
A move toward $250+ is plausible but would require a broader crypto risk-on cycle (likely tied to Bitcoin reclaiming and holding above $90,000–$100,000) alongside flawless execution on Solana’s technical roadmap. A drop back toward $60–$70 remains the credible bear case if macro conditions tighten or upgrade timelines slip.
XRP has moved from under $1 to around $1.50 in less than two weeks, crowding news headlines with its rally. Now, is it time to bank gains into strength, or keep full exposure to a trade that is increasingly running on leverage rather than fresh spot demand?
XRP briefly touched $1.69 on August 22 before retreating toward the $1.50–$1.53 range. By August 23, the token was at $1.48, up 47.77% over seven days, with a market cap of $92.95 billion and $22.45 billion in daily volume.
Xrp (XRP)
24h7d30d1yAll time
The rally is also riding a strong market backdrop. Bitcoin climbed from $62K to $77K over the same window, while the crypto Fear & Greed Index reached 67, classified as Greed. XRP has simply moved much faster, with spot ETF inflows adding another layer of demand.
The Overbought Signal and a Long Heavy Derivatives Book
Spot XRP ETFs recorded $18.38 million in net inflows on August 21, with Bitwise accounting for about $16.89 million. Weekly inflows approached $40 million, reportedly the strongest week for XRP ETFs since May. Cumulative net inflows are near $1.55 billion.
That gives XRP a legitimate spot demand story. The problem is that tens of millions in weekly ETF inflows remain small compared with a market cap above $90 billion. The rally, therefore, appears to be getting help from both real demand and increasingly aggressive derivatives positioning.
The technical picture adds another warning. One widely cited reading placed daily RSI near 85.4, deep into overbought territory, while other estimates put it between 70 and 83. Neither guarantees a reversal, but both show how far XRP has moved in a very short period.
Leverage tells the more concerning story. XRP futures open interest jumped 34.49%, or roughly $939 million, to about $3.66 billion over seven days. Binance positioning data showed 72.1% of accounts long versus 27.9% short.
That is a crowded trade. Twenty-four-hour liquidations reached $70.74 million, with longs accounting for $54.68 million, or 77.3% of the total. Three-day liquidations reached $145.15 million, while the largest single wipeout hit $50.27 million on August 22.
Funding also remained positive at 0.01% every four hours, equivalent to an annualized rate near 24.94%. Longs are still paying a premium to stay in the trade even after taking heavy losses.
Short covering helped fuel the earlier move, too. At present, roughly $2.2 million in short positions are at risk as XRP pushed through $1.40 to $1.50. But forced short covering is less durable than unleveraged spot buying.
That makes taking some profit increasingly reasonable. A 20% to 30% trim around current levels would lock in part of the gain while retaining exposure to a possible move toward $1.65 to $1.70 and potentially $2.
Forget The News, XRP Still Has a Structural Bull Case
The bullish case is not purely technical noise. Ripple CEO Brad Garlinghouse joined the inaugural meeting of the CFTC’s Innovation Advisory Committee alongside representatives from major financial institutions. He described the group as an “Olympic roster of crypto.”
That is notable for XRP, which spent years fighting an SEC enforcement action. Still, the committee seat is a policy forum role, not a court ruling or formal legal classification. The SEC’s new “Regulation Crypto Assets” proposal also does not settle the separate Ripple case.
The CLARITY Act remains another major variable. The legislation could classify XRP as a digital commodity under CFTC oversight, but political momentum does not guarantee passage. That uncertainty leaves the rally exposed to disappointment if expectations run ahead of reality.
RLUSD adds to the Ripple ecosystem story, with its market cap growing to roughly $2.1 billion from about $1.5 billion at the start of the year. However, apart from the news, this does not prove direct demand for XRP because the two assets serve different functions.
However, after a 50% rally in less than two weeks, taking something off the table is not the same as turning bearish. It simply means keeping exposure to the upside while making sure the market does not take back gains that are already there.
Avalanche’s tokenized real-world asset value has crossed $3 billion, giving the network another milestone in its push to become infrastructure for regulated and institutional finance.
The figure, reported through the validated Avalanche RWA source trail, includes major contributions from Progmat’s $1.2 billion securities migration, along with OpenTrade at about $190 million and Grove Finance at roughly $260 million.
That does not mean $3 billion in new assets appeared on Avalanche in one day.
It means the network’s RWA footprint has reached a larger aggregate milestone, helped by several tokenized asset deployments and migrations.
TL;DR
Avalanche tokenized RWA value has crossed $3 billion.
Progmat’s $1.2 billion securities migration was a major contributor.
The milestone is about aggregate tokenized asset value, not AVAX price.
Why RWA Value Matters
Real-world assets are one of crypto’s most credible institutional use cases.
Instead of purely speculative tokens, RWAs involve traditional assets such as Treasuries, credit products, securities, money-market instruments, and other financial claims represented on blockchain rails.
For a network like Avalanche, RWA growth can strengthen the institutional narrative.
It shows that the chain is not only competing for DeFi traders or retail users. It is also trying to become infrastructure for asset issuance, settlement, compliance, and financial distribution.
A $3 billion milestone gives that story more weight.
Avalanche Has Been Building Toward Institutions
Avalanche has long emphasized subnets, custom environments, and institutional blockchain deployments.
That strategy fits RWA adoption because regulated assets often need more control than open retail DeFi markets. Issuers may require permissioning, compliance controls, specific validator arrangements, privacy, and integration with existing financial workflows.
Avalanche’s architecture is designed to support that kind of customization.
The RWA milestone suggests the strategy is gaining traction, at least in aggregate asset value.
Progmat’s Role Is Significant
Progmat’s $1.2 billion securities migration appears to be one of the largest pieces of the total.
That matters because migrations from traditional or semi-traditional systems can bring real asset value onto blockchain infrastructure more quickly than purely crypto-native launches.
OpenTrade and Grove Finance add further depth to the picture.
Together, they suggest Avalanche’s RWA growth is not tied to a single minor experiment. It includes multiple deployments across tokenized finance categories.
Still, the market needs to track durability.
Tokenized asset value can rise because of one major deployment, but long-term relevance depends on usage, liquidity, settlement activity, and investor demand.
Do Not Make It An AVAX Price Story
The RWA milestone should not be reduced to AVAX price movement.
Tokenized asset value is a network adoption metric. It may support the long-term ecosystem narrative, but it does not automatically translate into immediate token price appreciation.
That distinction matters.
A chain can host more assets without those assets creating direct demand for the native token in a simple way. The relationship depends on fees, staking, network usage, liquidity, and how applications are structured.
The $3 billion milestone is important, but it is not a price forecast.
What Comes Next
The next question is whether Avalanche can convert RWA value into active financial infrastructure.
Are these assets being traded, used as collateral, integrated into DeFi, or held passively? Are more institutions building on Avalanche? Are settlement volumes increasing?
Those questions will decide whether the milestone becomes a foundation or just a headline.
For now, Avalanche has a stronger RWA story than it did before.
Crossing $3 billion in tokenized asset value puts the network deeper into the institutional tokenization race — and that remains one of the most serious growth areas in crypto.
Kalshi daily crypto perpetual-futures open interest reached a record $17.98 million. The reading puts attention on Kalshi’s CFTC-regulated perpetual futures, which allow traders to take leveraged positions on crypto prices without buying the underlying assets.
Perpetual futures, or perps, are derivative contracts that let traders take a position on an asset’s price without owning the asset itself. A trader can take a long position when expecting a price rise or a short position when expecting a decline. Unlike traditional futures, perpetual futures do not have an expiration date, although positions require sufficient collateral to remain open.
Big news for the crypto derivatives space
Kalshi’s daily perp open interest just smashed its previous record, reaching $17.98M.
It wasn't long ago that U.S. traders had limited, strictly regulated options for trading perpetual futures directly.
Kalshi’s perpetual-futures guide says the company became the first in U.S. history to offer CFTC-regulated perpetual futures on May 29, 2026. The guide describes crypto perpetual futures as a way to trade price movements in assets, including Bitcoin, Ethereum, Solana, and XRP, without crypto changing hands.
Leverage allows collateral to control a larger position, amplifying both potential gains and potential losses. A price move against a leveraged position can lead to liquidation if losses consume the required collateral. Kalshi’s guide also says its contracts use a funding rate charged every eight hours, a mechanism intended to keep perpetual-futures prices aligned with the underlying spot market.
Perpetual Futures and Prediction Markets Are Different Products
Kalshi offers both perpetual futures and prediction markets, but the products serve different purposes. A perpetual future is a directional position on the price of an asset with no fixed end date. A prediction-market contract concerns the probability of a specified event and resolves YES or NO on a specified date.
The distinction is important when assessing activity on the platform. The reported $17.98 million figure concerns crypto perpetual-futures open interest, rather than prediction-market activity. It should not be treated as a measure of event-contract trading.
Perpetual futures can be used for either rising or falling price views. They also carry risks that differ from spot crypto purchases: traders do not own the underlying token, face funding costs and may have positions liquidated if market moves exhaust their collateral.
As of June 3, 2026, Kalshi’s guide listed 13 CFTC-approved crypto perpetual-futures contracts. The guide listed maximum leverage of 5.9x for Bitcoin, 4.5x for Ethereum, and 2.0x for Shiba Inu, alongside contracts tied to other crypto assets.
Kalshi describes an isolated margin as an arrangement in which the collateral assigned to a specific trade is at risk if that trade is liquidated. Its guide contrasts this with cross margin, where an account balance can back open positions. The same guide says funding payments occur every eight hours.
Bitcoin (BTC)
24h7d30d1yAll time
These features make the record open-interest report a measure of activity in a product designed for leveraged crypto price exposure under CFTC oversight.
Kalshi’s reported record remains small beside major crypto perpetual-futures venues. Comparing Kalshi with Hyperliquid, which had $11.7 billion in daily open interest across 377 pairs. The comparison underscores the difference in scale between Kalshi’s crypto perpetual-futures activity and a large established market for perpetual contracts.
Kalshi’s guide frames its offering around regulated access to perpetual futures in the United States. Its contracts combine leverage, periodic funding payments, and liquidation risk with CFTC oversight. For traders, that means the product remains distinct from both spot crypto ownership and the platform’s event-based prediction markets.
Record Open Interest Suggests Traders Are Already Testing Kalshi’s New Crypto Market
Kalshi no longer needs to explain whether U.S. traders want regulated access to crypto perpetuals. The $17.98 million open-interest record is beginning to answer that question for it.
For traders, the appeal is straightforward: take long or short positions on major crypto assets, use leverage where appropriate, and do it through a CFTC-regulated platform without buying the underlying tokens.
That puts Kalshi in an unusual position. The same platform already lets users trade event outcomes, while its perpetual-futures market now adds direct exposure to crypto price moves. One account can express a view on what happens and, separately, where the market goes next.
The market is still far smaller than offshore giants such as Hyperliquid, but record activity suggests traders are starting to explore the regulated alternative.
Eligible new users who join Kalshi through CryptoNews can receive $25 through our referral link.
Ripple CEO Brad Garlinghouse is using his company’s own legal bill as evidence that Washington’s approach to digital assets has a direct, measurable cost. Garlinghouse has said Ripple spent roughly $150 million fighting the SEC over more than four years
On the same occasion, Garlinghouse also noted that a majority of the company’s hiring during that stretch happened outside the United States. It’s as proof that regulatory ambiguity pushes capital and jobs offshore, not just headlines into court dockets.
RIPPLE CEO: "The status quo is not good enough."
Brad Garlinghouse says Ripple spent MILLIONS fighting the SEC over four years, while 80% of its hiring happened outside the U.S. as a result.
The SEC sued Ripple, Garlinghouse, and co-founder Chris Larsen in December 2020, alleging the company raised funds through unregistered securities sales of XRP. The case dragged through multiple rulings before both sides filed a joint stipulation dismissing their appeals in August 2025, per the SEC’s own litigation release, leaving a $125,035,150 civil penalty and a registration-related injunction in place.
That outcome distinguished between institutional sales and secondary-market trading of XRP rather than declaring the token categorically exempt from securities law. It’s a nuance that matters when Ripple invokes the case as a template for how crypto assets should be regulated going forward.
Xrp (XRP)
24h7d30d1yAll time
Garlinghouse has previously called the resolution a long overdue surrender by the SEC, arguing the agency pursued the case to intimidate the industry rather than to police fraud.
Selig Declares an End to Regulation by Enforcement
The renewed attention to Ripple’s legal costs surfaced around an August 19 White House innovation meeting that brought crypto executives together with regulators to discuss digital-asset policy and the stalled CLARITY Act. CFTC Chair Michael Selig used the appearance to draw a hard line under the prior enforcement posture.
Selig said, adding that innovators were now being welcomed to the White House instead of being “railroaded to the big house.” He also said additional regulatory roadmap details would follow at the CFTC’s inaugural Innovation Advisory Committee meeting on August 20, whose published agenda covers digital assets, tokenized collateral and emerging financial products.
BREAKING: CFTC Chairman Selig says he “remains hopeful” Congress will get CLARITY to President Trump’s desk and lock in durable crypto rules.
“Passing CLARITY is the surest way that we can prevent another Gary Gensler from running a rogue campaign of lawfare.”
Garlinghouse, who attended alongside SEC Chair Paul Atkins and executives from Coinbase, Kraken, Gemini, Robinhood, Nasdaq and Intercontinental Exchange, posted his own read on the meeting afterward.
Garlinghouse said, citing a figure of 67 million Americans, or close to one in four people, are now holding crypto. That’s the political backdrop against which he’s positioning Ripple’s litigation history: not as a closed chapter, but as a cautionary case study lawmakers should point to when arguing for a formal SEC regulatory pathway for crypto issuers.
Beyond Ripple and SEC: Why the CLARITY Act Is the Real Stakes
The practical argument underneath Garlinghouse’s comments is that the CLARITY Act would replace the case-by-case litigation model that consumed Ripple legal budget with a defined split of jurisdiction between the SEC and CFTC. That’s the same logic driving industry proposals for a token safe harbor that would let projects raise funds and build networks without facing an enforcement action years into their operating history.
Whether that framework moves through Congress this session remains an open question, and Ripple’s own post-litigation position, including its financial standing after the SEC dispute, will likely stay a reference point in that debate regardless of the outcome.
Selig’s comments suggest the CFTC intends to move on rulemaking with or without a finished statute, but a durable division of authority between regulators still requires legislative action rather than agency posture alone.
For traders, the immediate takeaway isn’t a new legal threat to XRP – the SEC’s case against Ripple is closed, with the penalty and injunction from the district court’s judgment standing as final. The relevant signal is political: a sitting CFTC chair publicly renouncing enforcement-led regulation, with Ripple’s leadership in the room, tightens the odds that market-structure legislation gets prioritized before the next election cycle rather than shelved again.
XRP enters the second half of 2026 in an unusual position: legally cleared, institutionally adopted, and yet stuck near the same $1 level it has hovered around for months. We put the question to Claude, asking it ‘AI predicts XRP’, and it gave a measured and interesting response.
As of mid-August 2026, XRP trades around $1.00, down roughly -72% from its July 2025 all-time high near $3.65. Daily trading volume for Ripple is currently at $728M, up from $680M yesterday.
Understanding where it might go from here means combining technical data, macro catalysts, and, crucially, the real money being wagered on prediction markets like Kalshi.
Check out Claude AI’s response below on where it believes XRP will end up over the remainder of 2026. Ripple bulls may not be too happy with the answer, but there is a good amount of data to back up its claims.
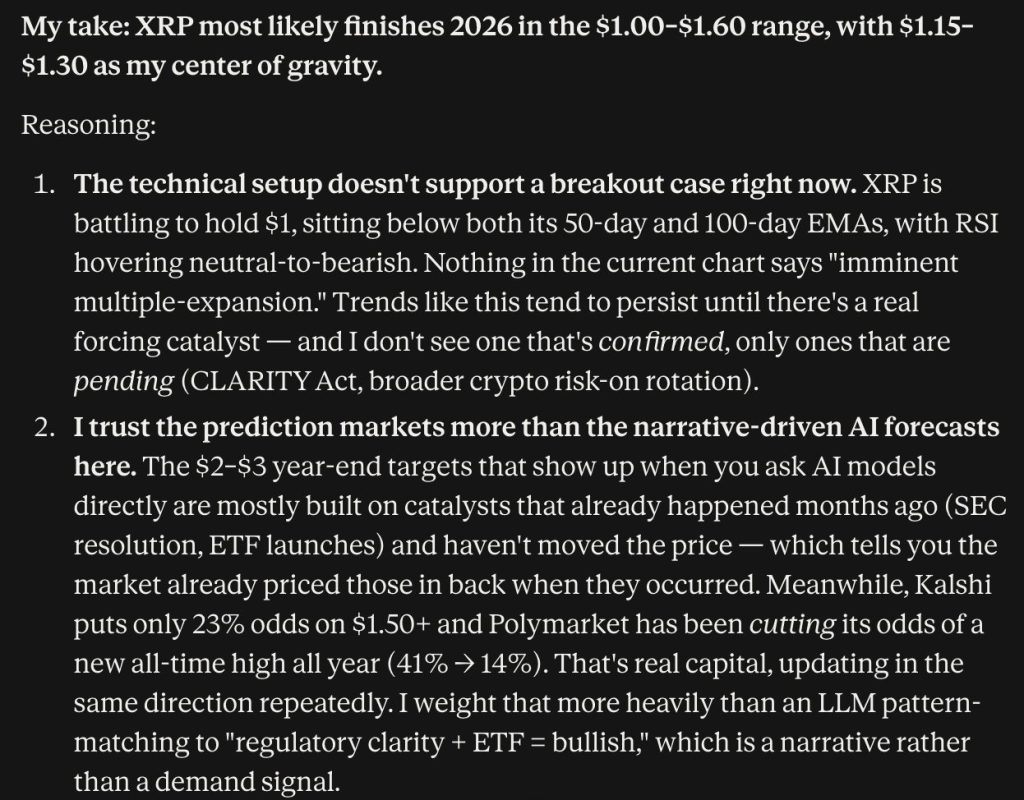
When asking Claude AI to predict the XRP price through the remainder of the year, this is what it had to say:
The technical setup doesn’t support a breakout case right now. XRP is struggling to hold $1, sitting below both its 50- and 100-day EMAs, with RSI hovering between neutral and bearish.
Nothing in the current chart says “imminent multiple-expansion.” Trends like this tend to persist until there’s a real forcing catalyst, and I don’t see one that’s confirmed, only pending ones (CLARITY Act, broader crypto risk-on rotation)
I trust the prediction markets more than the narrative-driven AI forecasts here. The $2–$3 year-end targets that show up when you ask AI models directly are mostly based on catalysts that happened months ago (SEC resolution, ETF launches) and haven’t moved the price, which suggests the market already priced them in when they occurred.
Meanwhile, Kalshi puts only 23% odds on $1.50+, and Polymarket has been cutting its odds of a new all-time high all year (from 41% to 14%). That’s real capital, updating in the same direction repeatedly.
Xrp (XRP)
24h7d30d1yAll time
I weigh that more heavily than an LLM pattern-matching to “regulatory clarity + ETF = bullish,” which is a narrative rather than a demand signal.
What would change my mind: sustained ETF inflows breaking meaningfully above the recent ~$2M/week pace, XRP reclaiming and holding the 100-day EMA, or a genuine macro risk-on move dragging the whole crypto market up together. Absent one of those, I don’t see the setup for XRP to run.
Downside case: if $0.99 support fails decisively, $0.85–$0.95 is plausible before finding new footing, but I don’t think a collapse toward the $0.50 zone is likely; liquidity and ETF structural demand act as a floor.
So my honest single number, if forced: XRP ends 2026 at around $1.20, with meaningfully more probability mass below $1.50 than above.
Aside from ‘AI predicts XRP’ and other prediction markets, Kalshi’s annual contract on XRP has a target of closing above $1.50 by the end of 2026 and has been climbing, recently moving from 18% to 23%, a sign that some traders are warming to a stronger back half of the year.
A smaller but notable 10% of bettors are pricing in XRP reaching $2.50, a scenario that would likely require multiple bullish catalysts to align at once, such as broader crypto market strength and further regulatory clarity in Washington.
At the same time, a separate Kalshi market has indicated a 59% probability that XRP will drop below $1 before year-end — underscoring genuine uncertainty rather than consensus.
Shorter-dated Kalshi contracts, which settle in as little as two weeks, have shown roughly 66% odds of XRP closing above $1.35 in the near term, though that probability fell to 43% for the $1.37 threshold, a reminder that short-term sentiment can shift quickly and shouldn’t be read as a year-end forecast.
Polymarket data tells a more cautious story on the high end: the probability of XRP setting a new all-time high before January 2027 has fallen sharply over the year, from around 41% to just 14%, while the odds of XRP even reaching $3 sit near 23%. That’s a notably wider gap than many analysts’ price targets, which have historically clustered at higher levels.
Changpeng Zhao, known as CZ, transferred $965,000 in BNB and BinanceLife tokens to his Giggle Academy education initiative and confirmed he is retiring the public wallet that funded the donation. The address had become one of the most-watched wallets on BNB Chain, and traders were extracting six-figure profits by front-running his token burns before Zhao decided to shut it down.
CZ described the problem as mundane and said that meme coin spam had made the wallet address unusable. Writing on Binance Square, he said he was testing Trust Wallet when unsolicited tokens cluttered the interface to the point he could no longer easily find his own BNB. Every attempt to burn the excess only invited more speculative sends, turning routine housekeeping into a public spectacle, he said he could never fully clean up.
LATEST: CZ officially stops using his public wallet, saying it’s “almost impossible to clean out” as unsolicited meme coins continue piling in.
Multiple traders had been monitoring CZ’s wallet for trading signals, with one reportedly making $282K, a 29x return, after spotting… pic.twitter.com/Ja8LUcU55h
Rather than migrate the balance to a fresh private address, Zhao routed the full amount to Giggle Academy, the free education project he funded after leaving Binance’s leadership. He said he intends to stop using the wallet entirely, effectively turning it into a burn address.
CZ Wallet Turned Into a Trading Signal
The mechanics behind the front-running are simple once mapped out. Because BNB Chain activity is fully visible, any burn Zhao executed reduced the circulating supply in a way that could move the price, and traders watching the address in real time could position ahead of the reaction. Lookonchain’s data shows one operator compounding a small stake into a six-figure exit almost entirely by anticipating those burns.
None of this has moved BNB meaningfully. The token sits around $602, with little to no movement, a mixed backdrop that suggests the market still treats the wallet drama as a niche trading story rather than a price catalyst. Our model carries an A+ rating on BNB with a longer-horizon projection of +34.13% over one year, detailed further on its BNB forecast page.
Retiring the address resolves the specific front-running loophole that produced those six-figure gains, since copy-traders lose their signal once the wallet goes quiet. But the underlying tension is not solved, as any new address Zhao uses may eventually be identified and watched with the same intensity, and the incentive to find it is now measured in hundreds of thousands of dollars per successful guess.
For now, the last recorded activity on the old wallet is the transfer that funded Giggle Academy, closing out a small but lucrative corner of BNB Chain trading.
Bitcoin and Ethereum edged higher into July 31, while a small shift in market dominance suggested traders were again watching whether capital was rotating toward major altcoins.
The validated notes show Bitcoin rising 0.29% to about $64,145.86, while Ethereum traded around the $1,890 to $1,920 range, briefly dipping below $1,900 before recovering. At the same time, BTC and ETH dominance slipped slightly, pointing to a modest move into other crypto assets.
That is not enough to declare “altseason,” and it would be lazy to pretend otherwise.
But it is enough to say the market is becoming more selective. Bitcoin and Ethereum remain the anchors, while traders are scanning altcoins for relative strength, fresh narratives, and clearer catalysts.
For more details, visit the official Coinmarketcap platform.
TL;DR
Bitcoin edged higher to roughly $64,145 on July 31.
Ethereum traded near the $1,900 area after a brief dip.
Slightly lower BTC and ETH dominance suggests traders are watching altcoin rotation, but not enough to call a broad altseason.
The reality is usually much messier. Capital rotates in stages, not all at once. Large caps may move first, then higher-quality altcoins, then more speculative assets. Sometimes rotation lasts days. Sometimes it fades quickly. Sometimes it is only a pause in Bitcoin dominance before BTC takes control again.
That is why the current market deserves a careful read.
Bitcoin and Ethereum are still holding the center. A slight dominance dip does not mean traders have abandoned them. It may simply mean that some capital is searching for better short-term setups elsewhere.
That can happen even while BTC and ETH move higher.
Bitcoin Still Sets The Tone
Bitcoin remains the first asset most traders watch.
When BTC is stable or rising gently, risk appetite often improves. Traders may become more comfortable moving into Ethereum, Solana, XRP, BNB, Chainlink, Sui, or other large-cap altcoins. When Bitcoin drops sharply, that appetite can vanish quickly.
So a modest BTC gain can create room for altcoin movement.
That does not make Bitcoin irrelevant. It makes Bitcoin the weather system the rest of crypto trades under.
At around $64,000, Bitcoin’s position is still strong enough to keep market confidence alive, but not necessarily explosive enough to absorb all attention. That can create the conditions for selective altcoin bids.
Ethereum’s Role Is Different
Ethereum’s position is a little more complicated.
ETH remains the largest smart-contract asset and a major institutional focus, but its market narrative now involves Layer 2s, ETF flows, stablecoins, DeFi revenue, mainnet fees, and competition from faster chains.
When Ethereum trades near $1,900, the market does not just ask whether ETH is rising. It asks whether Ethereum’s broader ecosystem is attracting capital.
If ETH stabilizes, some traders may look further down the ecosystem stack: Uniswap, Aave, ENS, Layer 2s, liquid staking, and other DeFi or infrastructure names. That is how Ethereum strength can sometimes spill into altcoins.
But again, that spillover is not automatic.
ETH can rise without DeFi tokens following. DeFi tokens can rally while ETH stalls. Rotation is never as clean as traders want it to be.
The Altcoin Market Is More Selective Now
The biggest difference from earlier cycles is selectivity.
In older bull phases, almost everything could move once traders decided risk was back. Now, the market is more fragmented. Liquidity is thinner in many assets. Investors are more sensitive to token unlocks, revenue, governance, emissions, legal risk, and actual usage.
That means altcoin rotation may favor stronger narratives rather than every token.
Real-world assets, stablecoin infrastructure, DeFi fee switches, AI compute, exchange-linked tokens, and major ecosystem upgrades may attract more attention than generic price charts.
This is healthier, even if it feels less euphoric.
A market where traders ask “what is the catalyst?” is more mature than one where every ticker moves simply because Bitcoin paused.
Watch Dominance, Not Just Price
The next useful signal is dominance.
If BTC and ETH keep rising while dominance continues to slip, that suggests broader participation. If dominance rebounds sharply, altcoin strength may fade. If BTC rolls over, most altcoins will likely struggle regardless of their individual setups.
So the right read is cautious optimism.
Bitcoin and Ethereum are steady enough to support risk appetite, and there are signs of selective rotation. But the market has not given enough evidence for a sweeping altseason call.
For now, traders are looking beyond the two largest assets, but they are not ignoring them.
That balance may define the next phase of the market.
This article is based on July 31 public crypto market data covering BTC, ETH, and market dominance.
This article was written by the News Desk and edited by Samuel Rae.
This report is based on information released by Coinmarketcap. at Coinmarketcap
Chainlink is drawing technical attention after chart analysis pointed to a bullish pennant forming on LINK, with buy volume beginning to recover as price compresses into a narrowing range.
The setup, shared by crypto analyst Gopal, suggests traders are watching for a breakout after a period of consolidation. A bullish pennant typically forms when price tightens after a strong move, with buyers and sellers compressing volatility before the next directional push.
For LINK, the pattern matters because Chainlink already has one of the stronger infrastructure narratives in crypto. The token is tied to oracles, data feeds, proof-of-reserve, cross-chain messaging, and institutional blockchain rails. When that fundamental narrative meets a clean technical setup, traders tend to pay attention.
But like all chart patterns, the pennant needs confirmation.
It usually appears after price moves higher, then consolidates inside a narrowing structure. The market pauses, volatility compresses, and traders wait to see whether buyers can regain control.
If price breaks above the pennant with volume, the pattern can signal continuation. If price breaks down instead, the setup fails.
That is the important line for LINK.
The current analysis points to compression and rebounding buy volume, but the market still needs confirmation. Traders will want to see price push through resistance rather than simply move sideways inside the structure.
Volume matters because it shows whether the breakout has real participation. Without volume, a move above resistance can fade quickly.
Chainlink Has A Stronger Backdrop Than Many Altcoins
LINK is not just a chart trade.
Chainlink remains one of crypto’s most important infrastructure projects. Its oracle networks support DeFi applications, pricing data, proof-of-reserve systems, automation, and cross-chain messaging. The project also continues to appear in institutional tokenization and financial-market infrastructure discussions.
That gives LINK a stronger fundamental backdrop than many speculative altcoins.
Still, the token does not always capture that narrative cleanly. Chainlink can be widely used while LINK price still moves with the broader altcoin cycle. That is why technical setups become important. They give traders a way to judge when the market is starting to reward the narrative.
A bullish pennant with improving volume can suggest that buyers are returning. It does not prove a major move is coming, but it gives traders a structure to watch.
The Breakout Needs Confirmation
For LINK bulls, the next step is simple: break above the pennant and hold.
A clean breakout would show that compression is resolving in favour of buyers. Ideally, that move would come with stronger volume and a broader altcoin market that is not fighting the trend.
If LINK breaks out while Bitcoin and Ethereum are stable, the setup becomes more credible. If LINK attempts to break out during a weak market, traders may be more cautious.
Support also matters. A failed breakout that drops back into the pennant can weaken confidence quickly. A breakdown below the structure would shift attention to lower support and suggest the market was not ready for continuation.
That is why technical traders tend to wait for confirmation rather than buying every early pattern.
LINK’s Infrastructure Narrative Still Helps
The reason LINK technical setups attract attention is that Chainlink has a clear story behind the chart.
Cross-chain communication, real-world asset tokenization, data feeds, and institutional crypto infrastructure are all live themes. Chainlink sits close to each of them. If the market rotates back into higher-quality infrastructure tokens, LINK is one of the assets traders are likely to revisit.
The bullish pennant setup may therefore become more important if it lines up with renewed demand for infrastructure names.
But the market still has to show it.
For now, LINK is compressing, buy volume is improving, and traders have a clear level to watch. That is enough for a technical setup, but not enough for a confirmed breakout.
The next move will decide whether this becomes a continuation pattern or another failed altcoin rally attempt.
This article is based on the referenced X chart post and TradingView market data.
This article was written by the News Desk and edited by Samuel Rae.
This report is based on publicly available market and on-chain data. at X
SUI is drawing fresh attention from technical traders after chart analysis pointed to a bullish flag pattern forming on the daily chart.
The setup, shared by crypto analyst Gopal, shows SUI consolidating inside a downward-sloping channel after a stronger upward move. In technical-analysis terms, that kind of structure can become a continuation pattern if price breaks above the upper channel with enough volume.
The key word is “if.”
Chart patterns do not guarantee direction, and a bullish flag can fail if buyers do not follow through. But the setup gives traders a clear level to watch at a time when altcoin momentum is becoming more selective.
For SUI, the question is whether consolidation is cooling the market before another leg higher, or whether the earlier impulse is losing strength.
A bullish flag usually appears after a sharp upward move.
The market rallies, then price begins to consolidate in a controlled downward or sideways channel. Instead of collapsing, the asset holds most of the previous gains while traders take profit and new buyers wait for confirmation.
If price breaks above the channel, traders often interpret it as a sign that the previous trend is resuming.
That is the optimistic reading for SUI.
The danger is that traders see the pattern too early. A channel can look like a flag until it breaks down. Volume can fade. Buyers can fail to show up. A broader market pullback can invalidate the setup before it confirms.
That is why confirmation matters.
For SUI, the bullish case depends on price clearing the upper boundary of the channel with stronger trading activity. Without that breakout, the pattern remains potential, not proof.
Why SUI Is On Traders’ Screens
SUI has become one of the more closely watched altcoins because it sits in the high-performance layer-1 category.
The network competes on speed, developer experience, object-based architecture, and consumer-facing applications. That gives SUI a narrative that can attract traders when capital rotates into newer layer-1 ecosystems.
Technical setups become more powerful when they align with a broader story.
If traders already believe SUI is one of the stronger altcoin candidates in a risk-on move, a bullish flag can give them a clean entry signal. If the wider market is weak, the same pattern may struggle to play out.
That is the current tension.
Altcoin traders are looking for assets that can outperform, but they are also more cautious after a choppy market. SUI needs both chart confirmation and broader risk appetite to turn the setup into a stronger move.
Volume Is The Deciding Factor
The most important part of this setup is volume.
A breakout without volume can be unreliable. It may trap late buyers before price slips back into the channel. A breakout with strong volume suggests new demand is entering and that traders are willing to chase the move.
That is especially important for altcoins, where liquidity can be thinner and false moves more common.
TradingView price action can help validate whether the pattern is still intact, but traders will also watch broader market conditions. If Bitcoin stabilises and altcoins begin moving again, SUI has a better environment for a technical breakout. If majors weaken, even a good-looking pattern can fail.
That does not make the chart useless. It just means the chart needs context.
The Setup Is Clean, But Not Confirmed
The best way to frame SUI here is as a technical setup waiting for confirmation.
The bullish flag structure gives traders a clear invalidation point and a clear breakout zone. That is useful. It creates a tradeable map. But the market has not confirmed the move until price exits the channel with conviction.
For readers, that distinction matters.
Technical-analysis stories can become too promotional when they treat patterns as outcomes. A better approach is to explain what traders are watching, what would confirm the setup, and what would weaken it.
In SUI’s case, the bullish argument is straightforward: consolidation after strength can reset the market before continuation. The bearish or cautious argument is just as simple: without volume, the flag may fade into a normal pullback.
The next move will decide which reading is right.
For now, SUI is on the watchlist because the structure is clear. Traders just need the breakout to make it real.
This article is based on the referenced X chart post and TradingView market data.
This article was written by the News Desk and edited by Samuel Rae.
This report is based on publicly available market and on-chain data. at X
Uniswap founder Hayden Adams has proposed expanding protocol fees across Uniswap v4 and several network deployments, putting one of DeFi’s longest-running governance debates back at the centre of the market.
Protocol fees are a sensitive topic for Uniswap because the exchange is one of DeFi’s most important pieces of infrastructure. It processes huge volumes, sits across multiple chains, and remains a core liquidity venue for tokens. But for years, the question has been whether that usage should translate into direct economic value for the protocol and UNI governance.
The new proposal, published through Uniswap governance, targets protocol-level fee activation across multiple deployments, including v4 pools and the newly launched Robinhood Chain.
For UNI holders and DeFi users, this is not just a technical governance item. It goes to the heart of how DeFi protocols should capture value.
Hayden Adams has proposed expanding Uniswap protocol fees across several network deployments.
The proposal includes v4 pools and Robinhood Chain activity.
The debate matters because it could reshape how Uniswap captures value from its own trading infrastructure.
Why Protocol Fees Matter For Uniswap
Uniswap is widely used, but usage and token value have not always moved together.
That has been one of the biggest debates around UNI. The protocol is critical to DeFi, but the token has often struggled with the question of direct value capture. Governance rights matter, but investors also want to know whether protocol activity can translate into a stronger economic model.
Protocol fees are one possible answer.
If activated, a portion of trading fees can be routed to protocol-controlled mechanisms rather than flowing only to liquidity providers. That can create a clearer link between exchange activity and the protocol’s treasury, buyback/burn mechanics, or other governance-directed uses.
The details matter. Fee rates, affected pools, chain selection, and how collections are handled can all change how traders, liquidity providers, and token holders respond.
For Uniswap, the challenge is balancing value capture with liquidity competitiveness. If fees are too aggressive, liquidity may migrate. If fees are too light, token holders may see little impact.
Multi-Chain DeFi Makes The Debate Harder
Uniswap is no longer just an Ethereum mainnet protocol.
It exists across multiple networks, and v4 is designed to make liquidity architecture more flexible. That multi-chain footprint creates opportunity, but it also makes governance more complicated.
Different chains have different users, fee environments, liquidity profiles, and competitive pressures. A fee model that works on Ethereum may not work the same way on Base, Arbitrum, Optimism, BNB Chain, Robinhood Chain, or Polygon.
That is why this proposal matters. It is not only about turning on a switch. It is about deciding how Uniswap should operate as a cross-chain liquidity protocol.
The governance materials note that fee collections would be routed into TokenJars and claimed for burning through UNI bridging to mainnet. That kind of structure shows how much DeFi governance has evolved. Fee activation now involves not just a governance vote, but cross-chain accounting, collection mechanisms, and execution details.
The more networks Uniswap supports, the more important those mechanics become.
What UNI Holders Will Be Watching
UNI holders will likely focus on whether the proposal creates a clearer path for token value.
That does not mean the market will instantly reprice UNI. Governance proposals can take time, and implementation matters more than the headline. But the direction is important. If Uniswap can show a credible method for turning protocol volume into economic value, the token’s investment case becomes easier to explain.
Liquidity providers will be watching from another angle.
They want to know whether protocol fees reduce their share of trading economics and whether any fee changes make certain pools less attractive. DeFi liquidity is mobile. If LPs believe another venue offers better returns, they can move.
Users care about execution quality. If fee activation damages liquidity or worsens pricing, traders may notice. If the change is small enough to preserve competitiveness, users may barely feel it.
That is the balance Uniswap governance has to strike.
DeFi Is Moving From Growth To Value Capture
The proposal also says something bigger about DeFi’s maturity.
Early DeFi was mostly about growth: liquidity, volume, users, integrations, and TVL. Mature protocols eventually face a different question: how does that activity support long-term economics?
Uniswap is one of the clearest examples because it is both widely used and heavily scrutinised. If a protocol of its size cannot find a sustainable value-capture model, investors will keep asking difficult questions about governance tokens across the sector.
That is why this debate reaches beyond Uniswap.
Other DeFi protocols are watching the same issue. They need to reward users, keep liquidity, satisfy governance, and avoid creating regulatory problems. Protocol fees sit right at the intersection of those pressures.
For now, the proposal gives the market a fresh reason to pay attention to UNI governance. It may not settle the value-capture debate immediately, but it moves the discussion into a more concrete phase.
If approved and implemented cleanly, it could become one of the more important DeFi governance developments of the year.
This article is based on the Uniswap governance forum.
This article was written by the News Desk and edited by Samuel Rae.
This report is based on information released by Uniswap Governance Forum. at Uniswap Governance Forum
 Login
Login