 Login
Login
Readers’ Tips: 5 Clever Garden Ideas
2 September 2026 at 05:00
Get great advice about how to organize your tools, grow mint in a container, and more

Use the Moon to find Antares and the Teapot, spot brilliant Venus, welcome the equinox, and see the Harvest Moon near Saturn and Neptune.

The Moon joins a tea party… Venus cranks up the brightness… the seasons officially change… and the Harvest Moon meets up with some planetary neighbors.
That’s What’s Up for September.
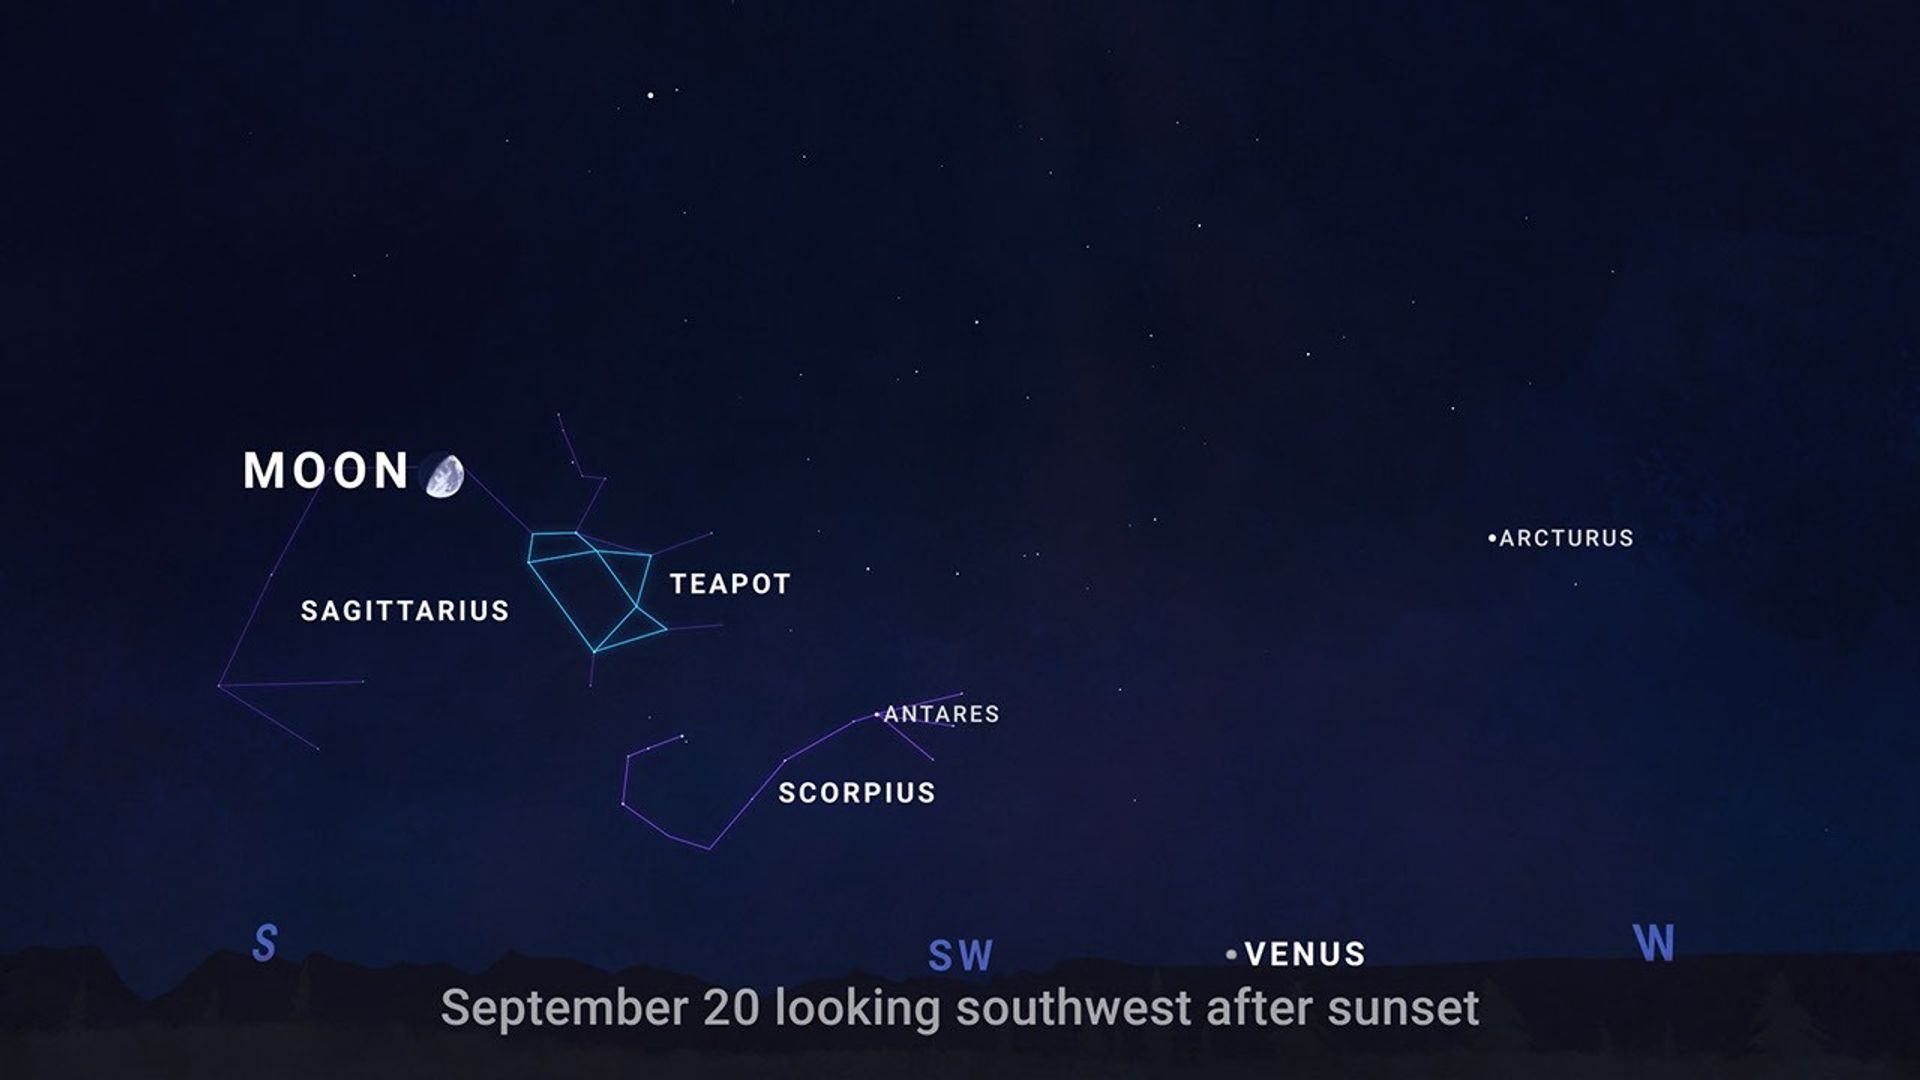
From September 14 through 20, let the Moon guide you to a few celestial landmarks. About an hour after sunset, look south to find the Moon in the evening sky.
Night by night, the Moon shifts position against the background stars, passing near Antares.
This bright, reddish star marks the heart of the constellation Scorpius.
Next you’ll see the Teapot, a group of stars in neighboring Sagittarius that really does resemble a teapot, complete with a handle, lid, and spout.
If you are under an especially dark sky… you may see hazy steam rising from the Teapot’s spout.
Follow that steam to its thickest part, and you’ll be looking toward the center of our Milky Way galaxy.
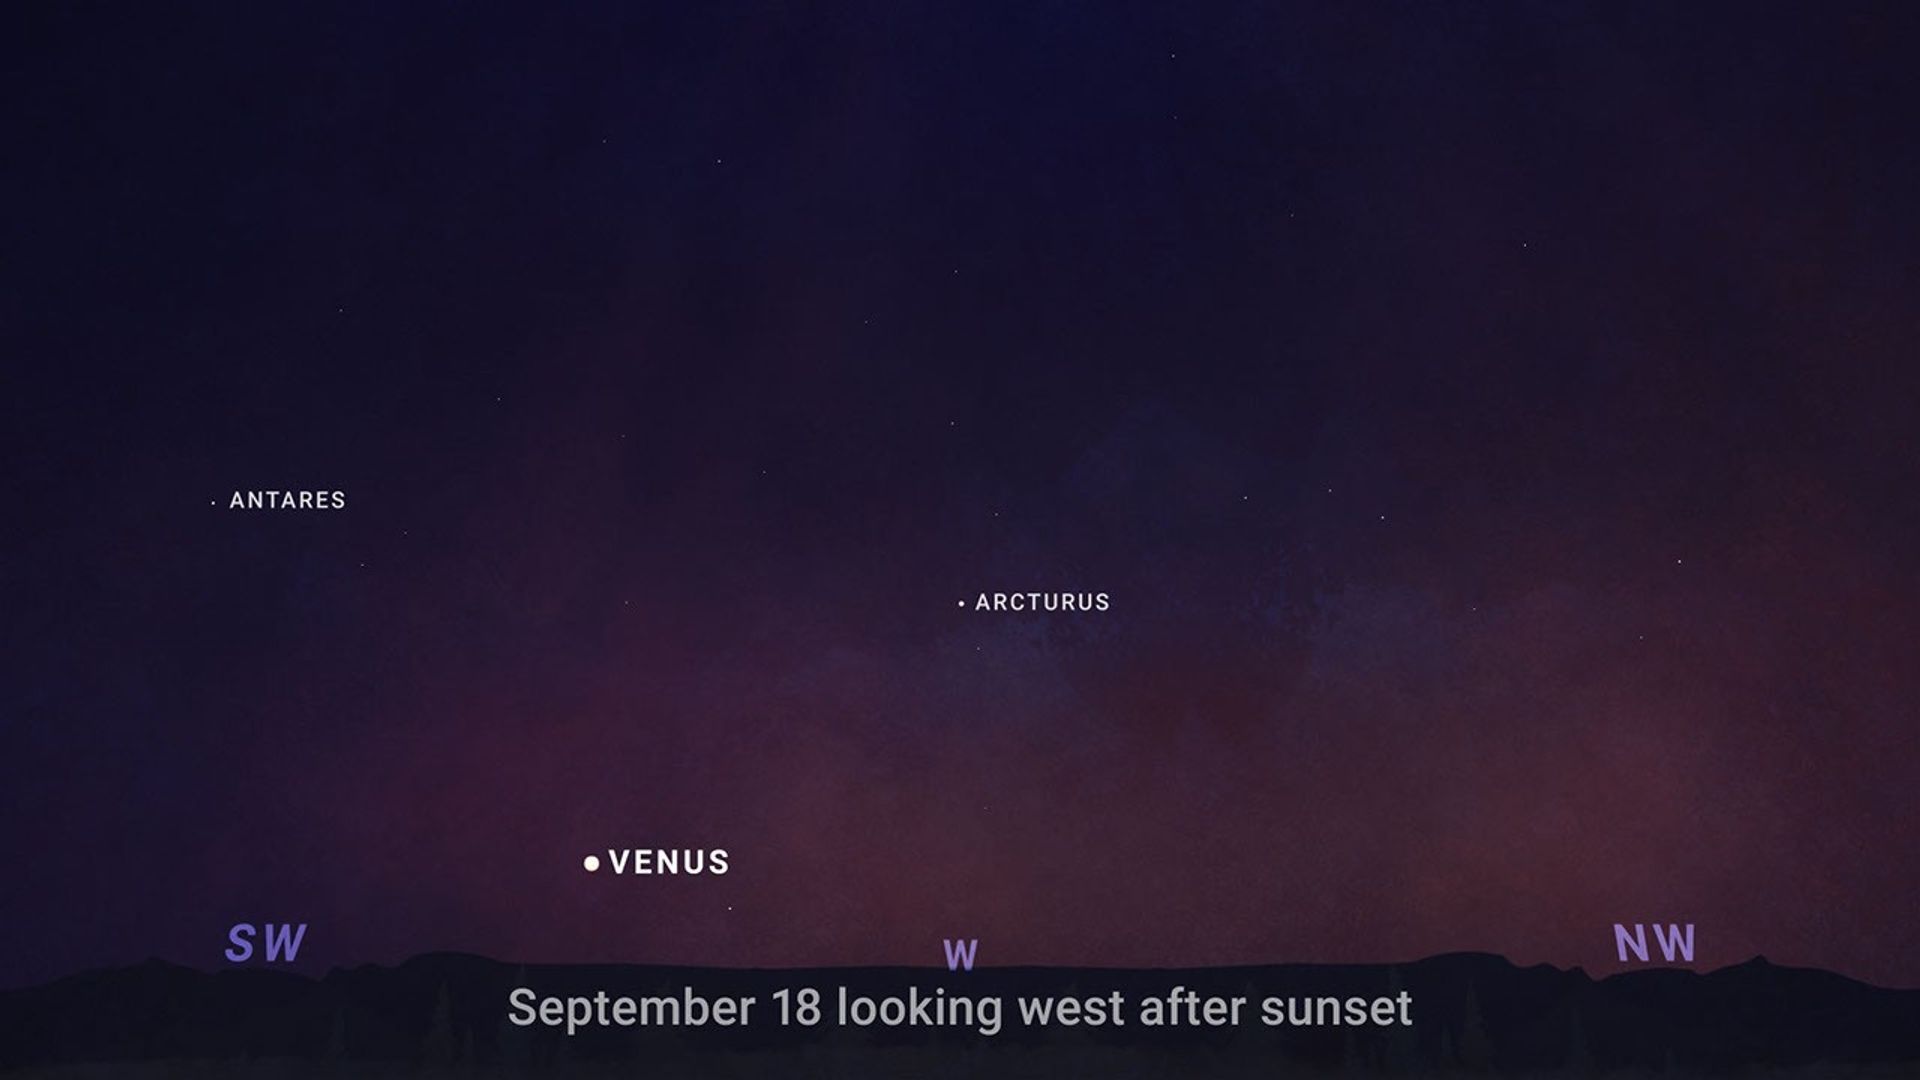
Look west on September 18 as Venus hits peak brilliance, shining at its brightest of this evening appearance..
You won’t have to search hard to find it. Shortly after sunset, Venus will stand out as a brilliant point of light low above the western horizon, outshining every star around it. A clear view of the horizon will give you the best chance to catch it before it sets.
On September 19, celebrate International Observe the Moon Night!
People around the world are invited to look up and connect with our nearest celestial neighbor while learning more about lunar science, exploration, and the many ways the Moon has shaped cultures around the world. Find an event near you — or learn how to participate from wherever you are — at go.nasa.gov/ObserveTheMoon.
Then on September 22, it’s officially fall in the Northern Hemisphere …while spring begins in the Southern Hemisphere.
That’s the September equinox, when the Sun is directly above Earth’s equator and day and night are close to equal in length around the world.
From there, daylight keeps getting shorter in the Northern Hemisphere and longer in the Southern Hemisphere.
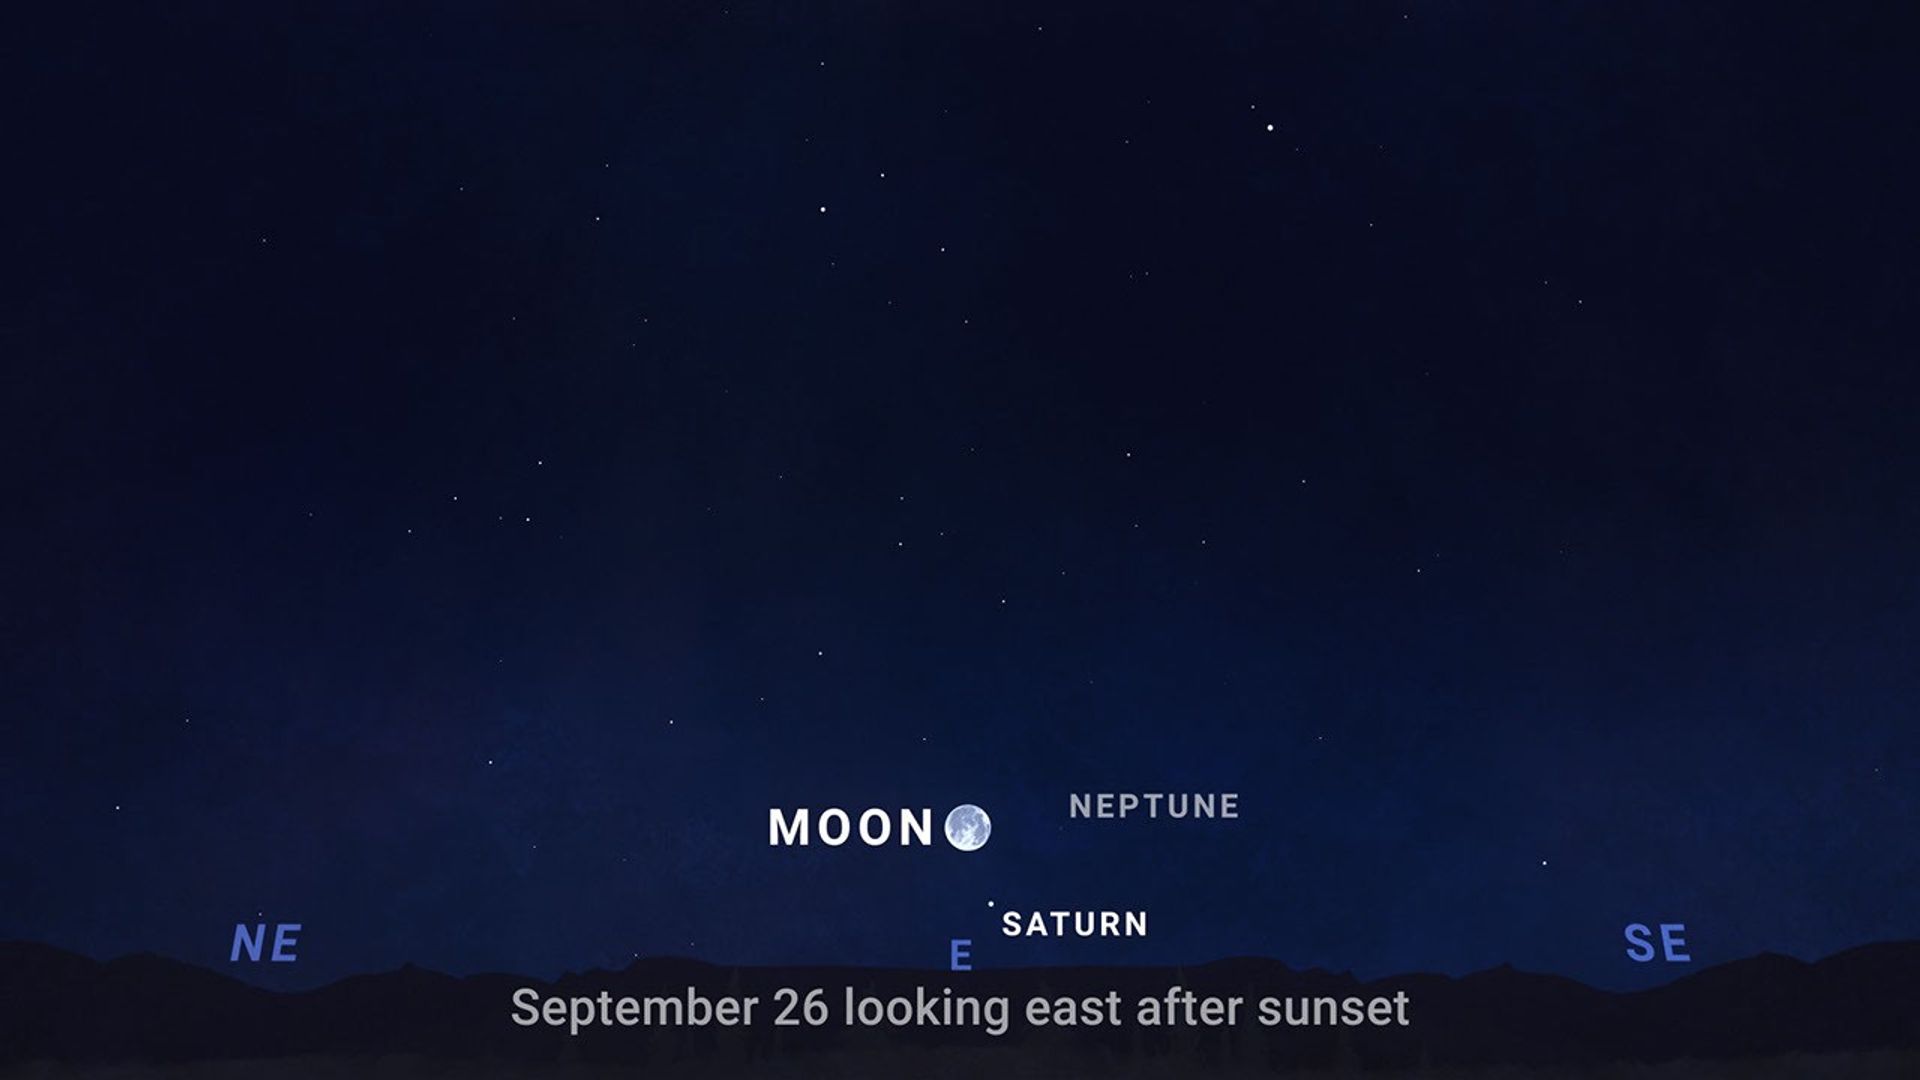
And on September 26, the Harvest Moon takes center stage, rising in the east shortly after sunset.
It won’t be alone. Saturn appears nearby, with faint Neptune completing a wide triangle in the sky.
Saturn is the easy one-you can see it with just your eyes. Neptune is a bit more challenging. At around magnitude 8, it’s too faint to see with the unaided eye …so you’ll need binoculars or a telescope to spot it. Darker skies and good observing conditions can help bring it into view.
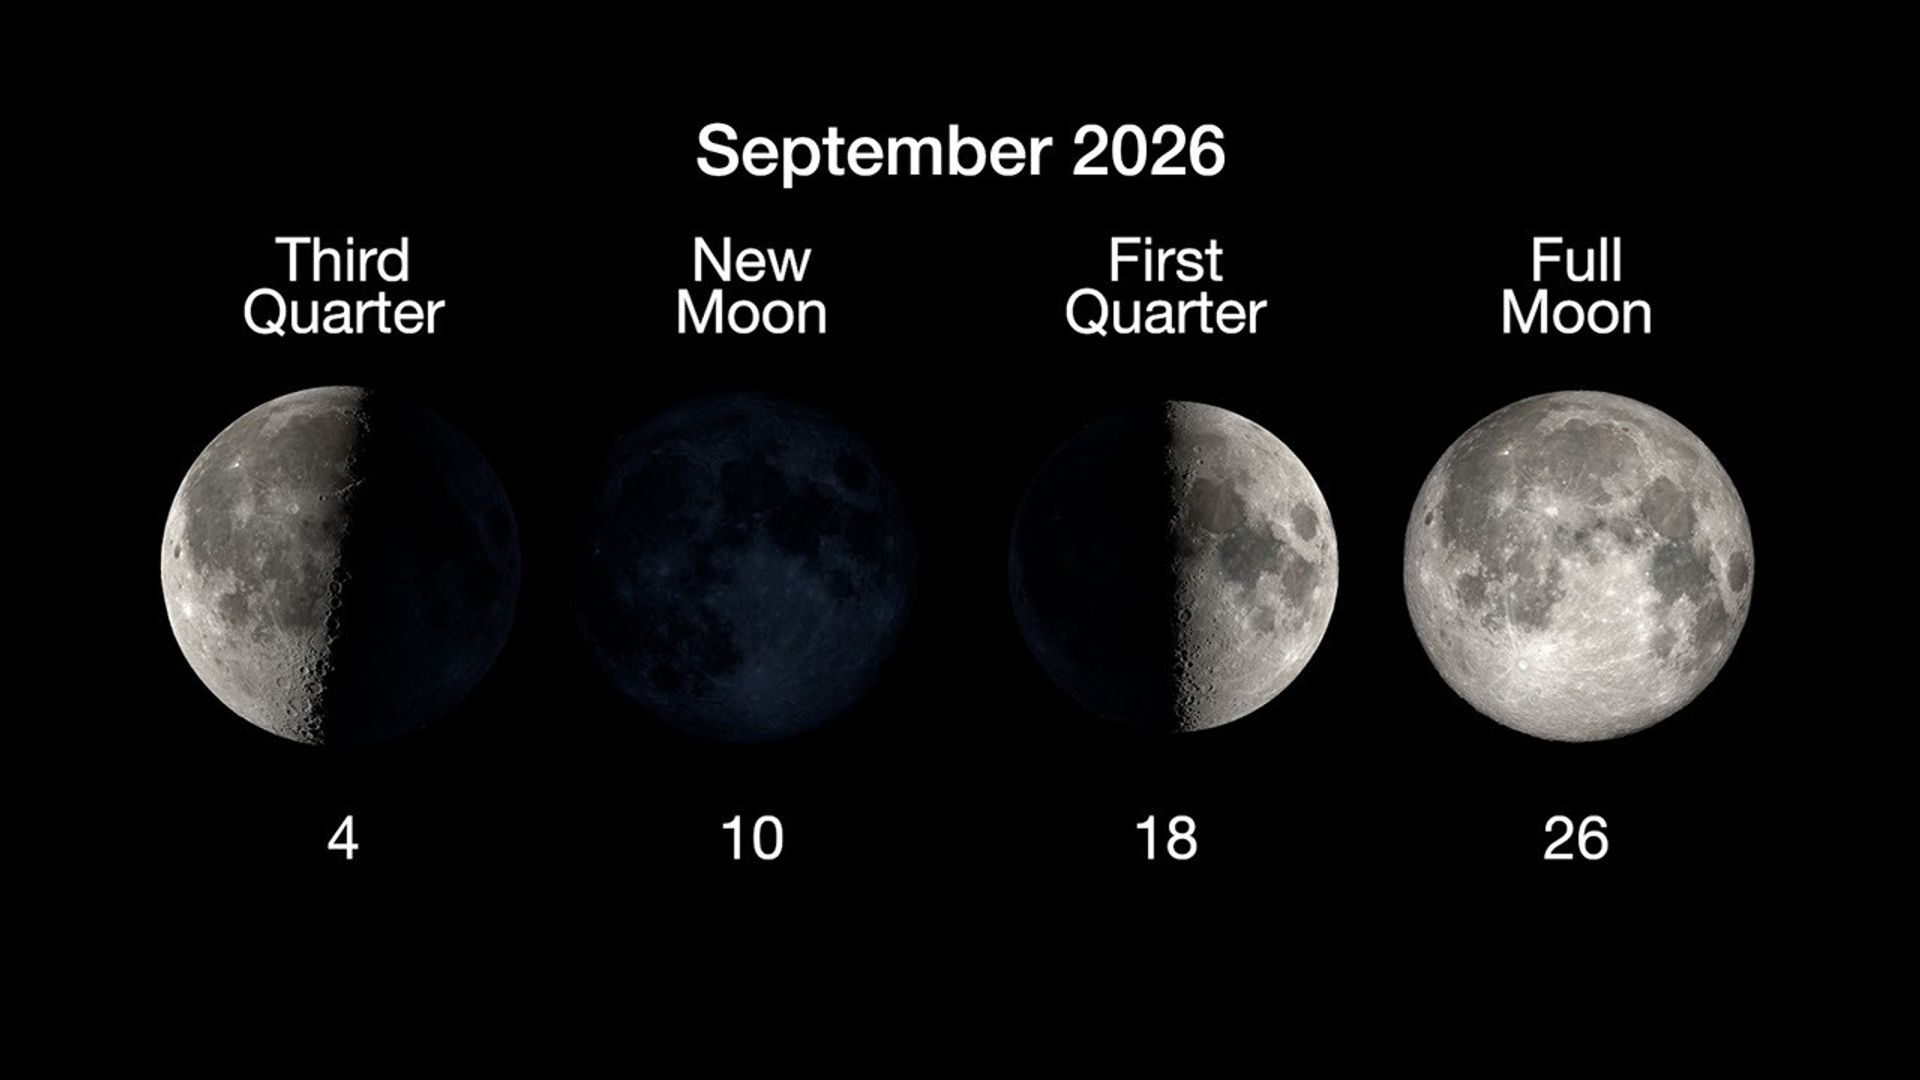
Here are the phases of the Moon for September.
You can stay up to date on all of NASA’s missions exploring the solar system and beyond at NASA Science. I’m Raquel Villanueva from NASA’s Jet Propulsion Laboratory, and that’s What’s Up this month.

Open interest (OI) rises when two traders create a new long-short contract pair, falls when both sides close an existing contract pair, and stays flat when one trader opens while the other closes. The key is that OI counts open contracts — not buy orders, sell orders, volume, or market direction.
Many traders see open interest move alongside price and assume the explanation is obvious: “OI is up, so more people are buying,” or “OI is down, so traders are selling.” That is incomplete.
Every futures trade has both a buyer and a seller. Yet each participant can be doing one of two things: opening a position or closing one. That creates four underlying combinations — and only one of them increases OI.
Understanding this mechanic helps traders read derivatives data with more precision. It also removes one of the most persistent misunderstandings in futures markets: a buy order does not always add a long position, and a sell order does not always add a short position.
Open interest is the total number of futures or perpetual contracts that remain open at a given time.
If one trader opens one BTC perpetual long and another trader opens the matching one-contract short, open interest increases by one contract. That contract remains part of OI until both sides have exited their positions.
Unlike trading volume, OI does not reset over a time period. Volume measures how much has traded during a session. Open interest measures how many contracts are still active after those trades are complete.
A simple way to remember the difference:
These three indicators can move in different directions. High volume can occur while OI stays flat. OI can rise while price falls. A price rally can happen while OI declines if existing short positions are being closed.
For every executed futures trade, ask one question:
Did this trade create a new contract, close an existing contract, or transfer an existing contract from one trader to another?
The answer determines the change in open interest.
Buyer’s actionSeller’s actionChange in OIOpens a longOpens a short+1Closes a shortCloses a long-1Opens a longCloses a long0Closes a shortOpens a short0
The buyer and seller are always matched, but their intent is not necessarily symmetrical. This is the foundation of OI analysis.
This is the clearest OI expansion scenario.
A trader who does not currently hold a position decides to open a long. Another trader who does not currently hold a position decides to open a short. Their orders match, creating a brand-new futures contract.
Result: Open interest increases by one contract.
Example:
This can happen during bullish or bearish conditions. OI increasing does not tell you which side is “winning.” It only shows that more capital and more outstanding exposure are entering the market.
If price rises while OI rises, new long exposure may be entering — but new shorts are also being created to take the other side. If price falls while OI rises, fresh short exposure may be building — but new longs are still being created too.
The price move shows which side is more aggressive. OI shows that the market’s total outstanding leverage is expanding.
OI falls when an existing long and an existing short close the same contract.
Imagine a long holder who wants to exit by selling. The matched buyer is a short holder buying to close. Neither trader is creating fresh exposure; both are removing an existing position from the market.
Result: Open interest decreases by one contract.
Example:
This is often called position liquidation or deleveraging, although not every position close is a forced liquidation. It can simply reflect traders taking profit, cutting losses, or reducing risk.
When price rises and OI falls, short covering may be contributing to the move. When price falls and OI falls, long positions may be exiting. In both cases, the market has less outstanding exposure after the trade.
This is where many traders get confused.
One trader buys to open a new long position. The other trader sells to close an existing long position. A contract has changed hands, but the total number of active contracts has not changed.
Result: Open interest remains unchanged.
Example:
Trader A now owns the long exposure that Trader B previously held. The number of outstanding contracts remains the same because one long position replaced another long position.
This is a form of position turnover. Trading activity may be high, but OI does not rise because the market is transferring existing exposure rather than creating new exposure.
The reverse can also occur.
A trader sells to open a new short position. The matched buyer is a trader buying to close an existing short position. One short leaves the market, while another short replaces it.
Result: Open interest remains unchanged.
Example:
Again, the market is experiencing turnover rather than expansion or contraction. There may be substantial volume, but the total number of open contracts is unchanged.
A common mistake is assuming that every buyer is opening a long and every seller is opening a short.
That is not how futures accounting works.
A buy order can mean:
A sell order can mean:
This is why OI cannot be interpreted from order direction alone. A green candle and increasing volume do not automatically mean OI is rising. Likewise, a red candle does not automatically mean OI is falling.
To interpret OI properly, traders need to combine it with price, volume, funding conditions, and market structure.
Price and OI combinations can provide useful context, but they are not standalone trading signals.
PriceOIPossible interpretationRisingRisingNew positions are entering during an upward move.FallingRisingNew positions are entering during a downward move.RisingFallingExisting shorts may be closing or leverage is reducing.FallingFallingExisting longs may be closing or leverage is reducing.
The word possible matters. OI does not reveal every trader’s exact motive, account size, liquidation threshold, or strategy. It is a structural metric, not a guaranteed directional forecast.
A sharp OI increase can indicate growing conviction, but it can also signal crowded leverage and greater liquidation risk. A sharp OI decline can reflect capitulation, profit-taking, or a market reset after excessive positioning.
Flat OI is not “no activity.”
A market can have intense trading volume while open interest barely changes. That often means positions are changing hands: some traders are opening while others are closing.
This distinction matters when assessing momentum. If price moves strongly but OI remains flat, the move may be driven more by position rotation than broad leverage expansion. If price and OI rise together over time, more capital is remaining committed to active derivatives positions.
Neither outcome is inherently bullish or bearish. The goal is to understand what type of participation is driving the move.
The fastest way to internalize OI mechanics is to watch how positions change in a live trading environment without risking capital.
Open a simulated BTC perpetual position, then close it. Observe how order execution, market depth, price, volume, and derivatives data interact. Repeat the process at different times and compare whether active positioning appears to expand, contract, or rotate.
Try this simple exercise:
Start practicing on the Phemex BTC-MUSDT simulated trading page.
Open interest becomes much easier to read once you stop treating it as a “buy versus sell” metric. It is a count of surviving contracts. New long plus new short: OI rises. Closing long plus closing short: OI falls. When one side opens and the other closes, OI stays flat — even though trades continue to execute.
Website | Twitter | Telegram | Reddit|Discord | Facebook | Instagram | YouTube
How Open Interest Is Calculated: What Causes OI to Increase, Decrease, or Stay Flat? was originally published in Coinmonks on Medium, where people are continuing the conversation by highlighting and responding to this story.
During Black Hat and DEF CON, you can expect to run into more than 400 vendors and 50,000 attendees. Both conferences are going to be full of life, with various...
The post DEF CON Diaries #2: How to Avoid Being Overhwhelmed appeared first on Cyber Defense Magazine.
It is that time of year again: Hacker Summer Camp! For those of you not familiar with that term, Hacker Summer Camp is when cybersecurity professionals, hackers, and tech enthusiasts...
The post DEF CON Diaries #1: What You Need to Know and Have appeared first on Cyber Defense Magazine.
From avoiding the sun to bug bites, our skincare routine requires a little more effort in the summer ... Read More
The post Sun Safety for Gardeners: How to Stay Safe in the Sun appeared first on Garden Therapy.
These gardening apps are like having a mini master gardener in your phone. From helping you plan your ... Read More
The post From Seed to Screen: Top 12 Gardening Apps for Green Thumbs appeared first on Garden Therapy.
