❌

Normal view

There are new articles available, click to refresh the page.
Before yesterdayMain stream

The journey of a paper unicorn: adventures inside a modern warehouse

Introduction

Imagine you’ve ordered a small paper unicorn from an online marketplace. You clicked β€œBuy”, received a cheerful notification, and expect a courier to bring the box tomorrow. If the unicorn is delayed by a day, it will be annoying but not catastrophic: an apology, a discount promo codeΒ β€” and the incident is forgotten.

Now let’s multiply one late unicorn by several hundred thousand orders.

Packages start heading to the wrong cities. The website shows an item is in stock, even though the required bin is empty. Conveyors stop, boxes get stuck between floors, the cargo piles up with no freight manifest. Trucks line up at the gates, and every minute of downtime turns into blown schedules, support tickets, fines, and lost sales.

It is at exactly this scale that a cyberincident in a warehouse becomes a problem for the entire business. A modern warehouse is no longer just a big building with shelving. It is a tightly interconnected hybrid system: web applications, radio channels, and an automated factory. Physical processes here depend on data, and errors in data have very physical consequences. Examples include an outage that affected warehouse management systems at the grocery giant Morrisons, and the 2025 Form 10-K annual report of United Natural Foods, Inc. (UNFI), which confirmed unauthorized activity on information technology systems that impacted order fulfillment. More recently, reports emerged that a cyberattack disrupted eight CEVA Logistics warehouses across Europe and exposed customer delivery data.

This paper follows a single order through a warehouse to show where the operation is vulnerable, the stages it traverses, the systems that drive it, and the points where an attacker can reach them. We then set out the threat model: what is at risk, who is in a position to take it, and how each risk lands on the business. From there, we look at how an attacker gets in, and what reaching the warehouse management system costs in practical terms: orders unshipped, inventory records nobody can trust, and an operation that stops. We close with recommendations on where the controls that matter actually sit.

Tracing the unicorn

A modern warehouse is a sequence of stages involving many machines and people, all working together to keep the business process stable so that, in the end, your order gets delivered. This process consists of eight main stages, shown in the figure below.
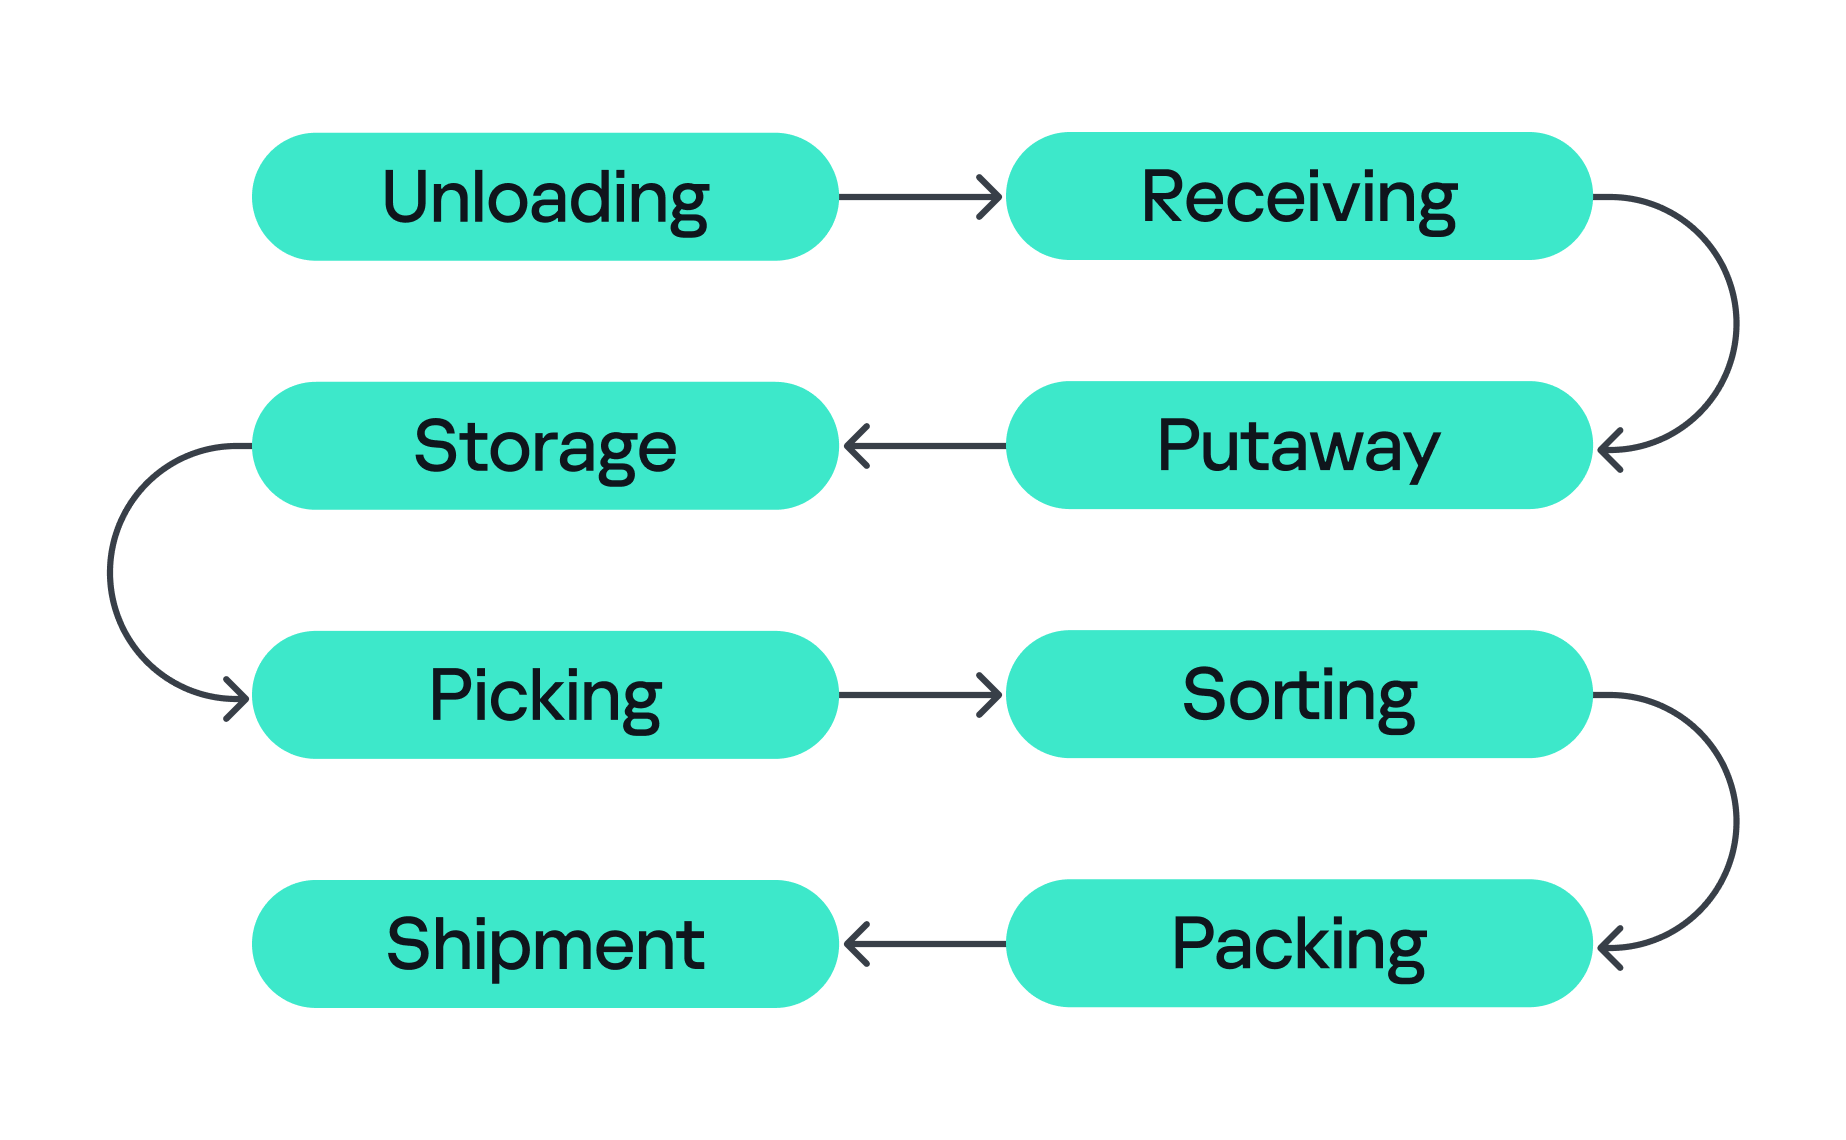
Stages of order fulfillment

Stages of order fulfillment

So let’s assume we’ve ordered our paper unicorn and are waiting for it at home. Let’s follow our order through all the main stages, from its arrival at the warehouse to the final stop on its journey.

  1. Unloading
    First, the unicorn arrives in the unloading zone, packed in a big truck. The driver is assigned a gate, for example, via a tablet with kiosk mode enabled, or an outdoor display board, indicating where the truck should park and where the cargo will be unloaded. Even at this very first step, a digital command (the gate number on the screen) is already triggering a physical action. Therefore, incorrectly assigned gates can create a queue, delay unloading, or send goods into the wrong workflow.
  2. Receiving
    At this stage, employees identify the cargo. They scan a barcode using a portable data terminal (PDT) and the central system receives a message indicating that this object arrives at the warehouse. From this moment, the unicorn exists in two forms at once: as a real box and as a record in the information system. If these two versions diverge, the error is inherited by all subsequent processes.
  3. Putaway
    Next, the goods are moved into internal storage. Two new devices come into play here. First, a thermal printer, connected to the internal network over Wi-Fi, creates an internal label for each item. Then an employee, forklift, or automated system moves the goods to the assigned bin, often with the help of lifts controlled by PLCs. Both of these devices can be valuable attack entry points: one can let an adversary pivot into the internal network, while the other can give them control over an electric motor.
  4. Storage
    Then the unicorn goes into storage. Many distribution centers use multi-level mezzanine structures: several floors of metal shelving inside a huge space. They allow efficient use of the building’s height, but at the same time complicate control over the technical infrastructure. Wi-Fi access points, cameras, switches, cables, and sensors may be mounted high overhead or buried deep inside the rows. A forgotten Ethernet cable or misconfigured networked device (access point or switch) left behind in a dark corner can become a convenient initial access point into critical infrastructure.
  5. Picking
    When the customer places an order, picking begins if the goods were already stored in the warehouse or as soon as they are unloaded. A PDT, workstation, light indicator, or voice terminal directs the employee to the required bin where they pick the goods and move them to the next stage. These devices are themselves potential attack entry points: compromising a workstation or PDT could allow an attacker to manipulate picking information, which could misdirect employees to the wrong bin. Here, both the speed and integrity of the information are critical, and any manipulation or disruption can lead to wrong orders, delays, or problems in subsequent stages.
  6. Sorting
    At the sorting stage, the warehouse starts to look more like a factory. Boxes move through conveyor belts and pass through different scanners, diverters, and chutes. The sorting plans are usually stored and managed by dedicated servers, while PLCs are responsible for controlling the machinery and executing these plans. For example, when the warehouse management system (WMS) decides that our unicorn should take route A, the control system needs to activate the right diverter at the right moment, sometimes within a fraction of a second.
  7. Packing
    During packing, an employee or a robotic arm places the goods into the final box, prints the shipping label, and sometimes measures the dimensions and weight of the package. Safety mechanisms usually prevent robotic arms from leaving the controlled zone and harming nearby operators, but their compromise might inflict physical damage on the packages being processed.
  8. Shipment
    Finally, at the shipping stage, the parcel heads to the gates. Automated guided vehicles (AGVs) and autonomous mobile robots (AMRs) move containers and pallets across the warehouse, while the dock management system coordinates the truck that will carry the unicorn onward to a store, a sorting center, or straight to the customer. These robots are themselves a potential target for attackers. Attacks can be conducted against AGVs and AMRs to interfere with their operation, for example by affecting their navigation or preventing them from reaching their intended destination.

All eight stages are coordinated by the WMS. It looks like a large web application, but in its role it’s closer to the operating system of the entire warehouse: it knows which goods exist, where they’re located, who or what should move them, and where they go next, linking employees, inventory levels, storage addresses, tasks, and orders. It also exchanges data externally: with ERP systems, transport platforms, marketplaces, dark stores, and external carriers.

Surrounding the WMS is an even larger digital ecosystem: identity services, databases, APIs, printers, carrier systems, technicians’ laptops, video surveillance, access control, fire and gas alarms, power supply, and a building management system (BMS).

That is why a single β€œwarehouse network” doesn’t really exist. As we’ve seen, there are many overlapping technologiesΒ β€” IT infrastructure, OT systems, radio, cloud services, building security, and automationΒ β€” layered on top of one another. A lone vulnerability scanner will never tell you whether a warehouse is secure.

Hunting the unicorn

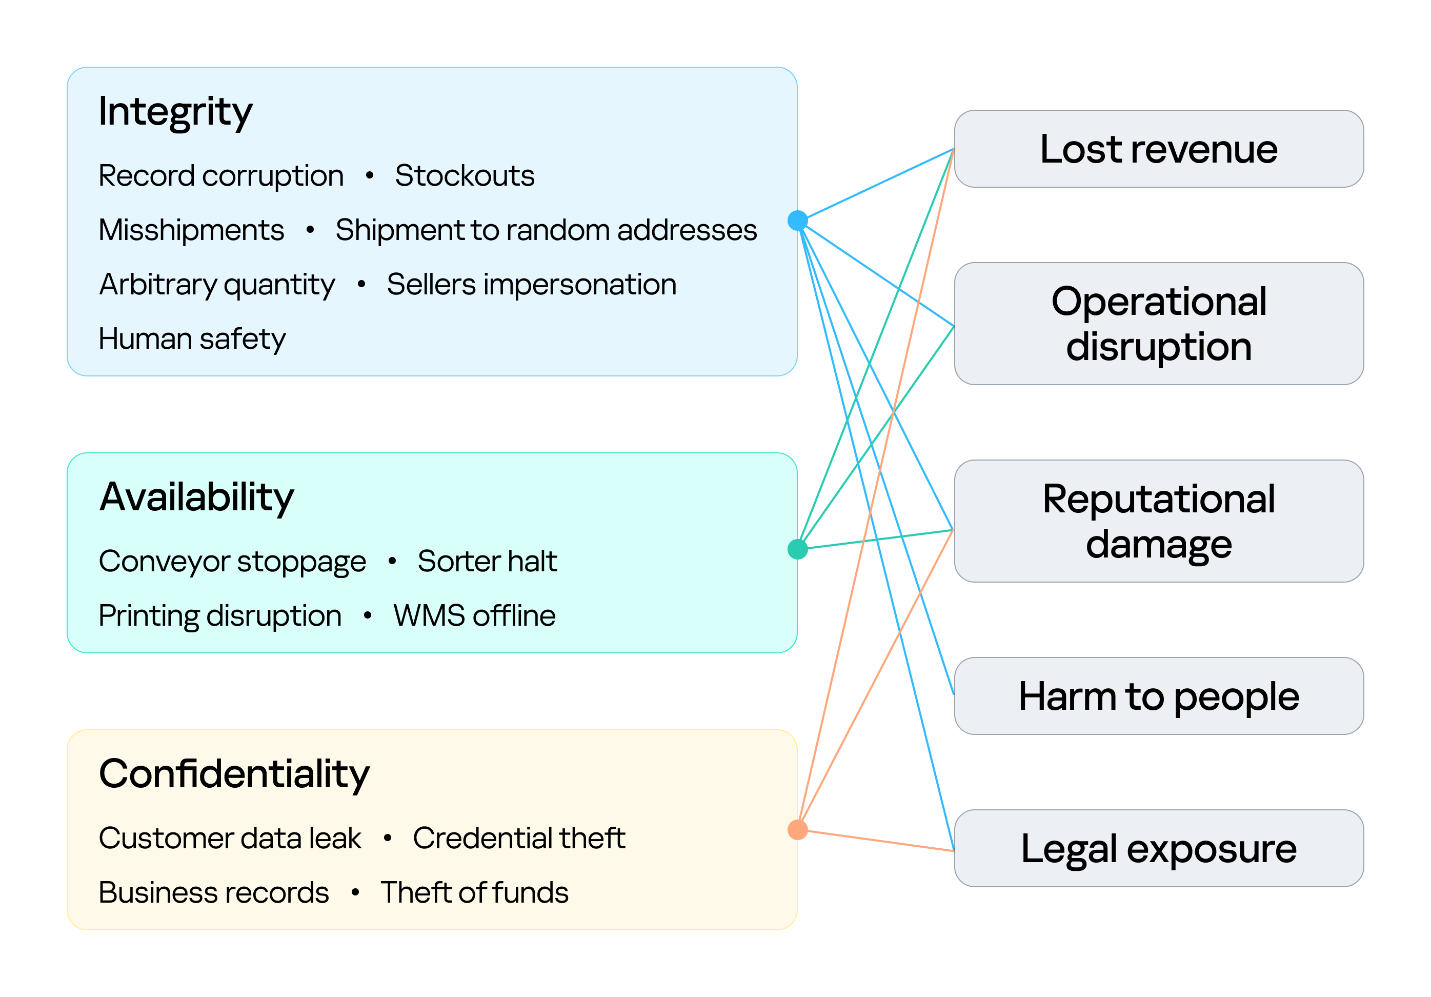
Securing an environment such as a warehouse requires a comprehensive security assessment covering all of its interconnected systems. This involves identifying vulnerabilities across each system and understanding how weaknesses can be combined into attack paths that a real attacker could exploit. But a vulnerability only matters in proportion to what it exposes and who is able to reach it, so before looking at the weaknesses themselves, we need to understand what an attacker in this environment is actually after, because in a warehouse, the blast radius extends well beyond data. Everything we just traced β€” the systems, the devices, and the people operating them β€” exists to keep goods moving, and attacks in various parts along that chain can affect the business differently. The chart below shows what is at risk in the warehouse and where those risks land for the business. The segment on the left groups them under the three core security properties: integrity, availability, and confidentiality. The segment on the right maps each property to the business outcomes a failure can cause.
Warehouse risks

Warehouse risks

The first area at risk is integrity. Inventory counts, locations, orders, and shipment data must stay in sync with the physical world. Corrupting a record silently desynchronizes the operation, and because the eight stages form a dependency chain, one falsified entry early on is inherited downstream, surfacing later as stockouts and mis-shipments. In its deliberate forms, this lets an attacker redirect goods, release stock, and perform other actions on behalf of the platform’s vendors under cover of legitimate records. Integrity is also a safety concern: when people or machines act on information that no longer reflects the physical environment, a data failure can become a physical incident. This is why integrity is the only property linked to all five outcomes, including harm to people.

The second is availability, the warehouse’s ability to keep goods moving. Halting a conveyor, a sorter, label printing, or the WMS stops orders from shipping, and in a business built on speed, every hour of downtime means delayed deliveries and broken promises. Ransomware can bring the whole warehouse to a standstill. The impact shows up as operational disruption, lost revenue, and reputational damage.

The third is confidentiality. Customer data, business records, and system credentials are valuable targets. Their exposure leads to legal liability and reputational damage, and stolen credentials often open the door to further attacks. Where the WMS connects to financial or ERP processes, the risk extends to theft of funds.
Knowing what is at risk tells us what an attacker stands to gain; the next question is who is in a position to take it. Threat actors differ in the access they already hold. For example, an attacker may be authenticated and privileged, have limited physical or remote access, or have no legitimate access to the environment at all. Based on their relationship with the warehouse and their level of access, threat actors can generally be divided into two categories:

  1. External. An attacker with no legitimate relationship with the warehouse or the organization, operating without authorized access. External attackers can be divided into two categories based on their physical proximity to the environment:
    1. Remote. An attacker operating from outside the site’s physical area, reaching the environment through whatever the organization exposes or makes reachable over the internet, including web services, remote access infrastructure, and third-party connections used by suppliers, carriers, and integrators.
    2. Proximate. An attacker with no legitimate access who has nevertheless moved within physical range of the site’s locally reachable technologies. They may, for example, be in a parking lot, a neighboring unit, or a delivery bay. Their proximity may allow them to interact with wireless, radio, Bluetooth, or other short-range interfaces without possessing an account, badge, employment relationship, or other authorized access.
  2. Internal. An individual with legitimate access to the warehouse, its systems, or its information, who intentionally or unintentionally creates a security risk. This includes employees, administrators, operators, contractors, and temporary staff.

Combining these threat actors and their access levels with the risks identified earlier, the vulnerabilities present in each system, the resulting attack surfaces, and the potential attack paths between them provides a threat model for the warehouse environment. This allows an organization to understand how different systems and people could be targeted, how individual weaknesses could be combined, and where security controls are most needed.

Cornering the unicorn

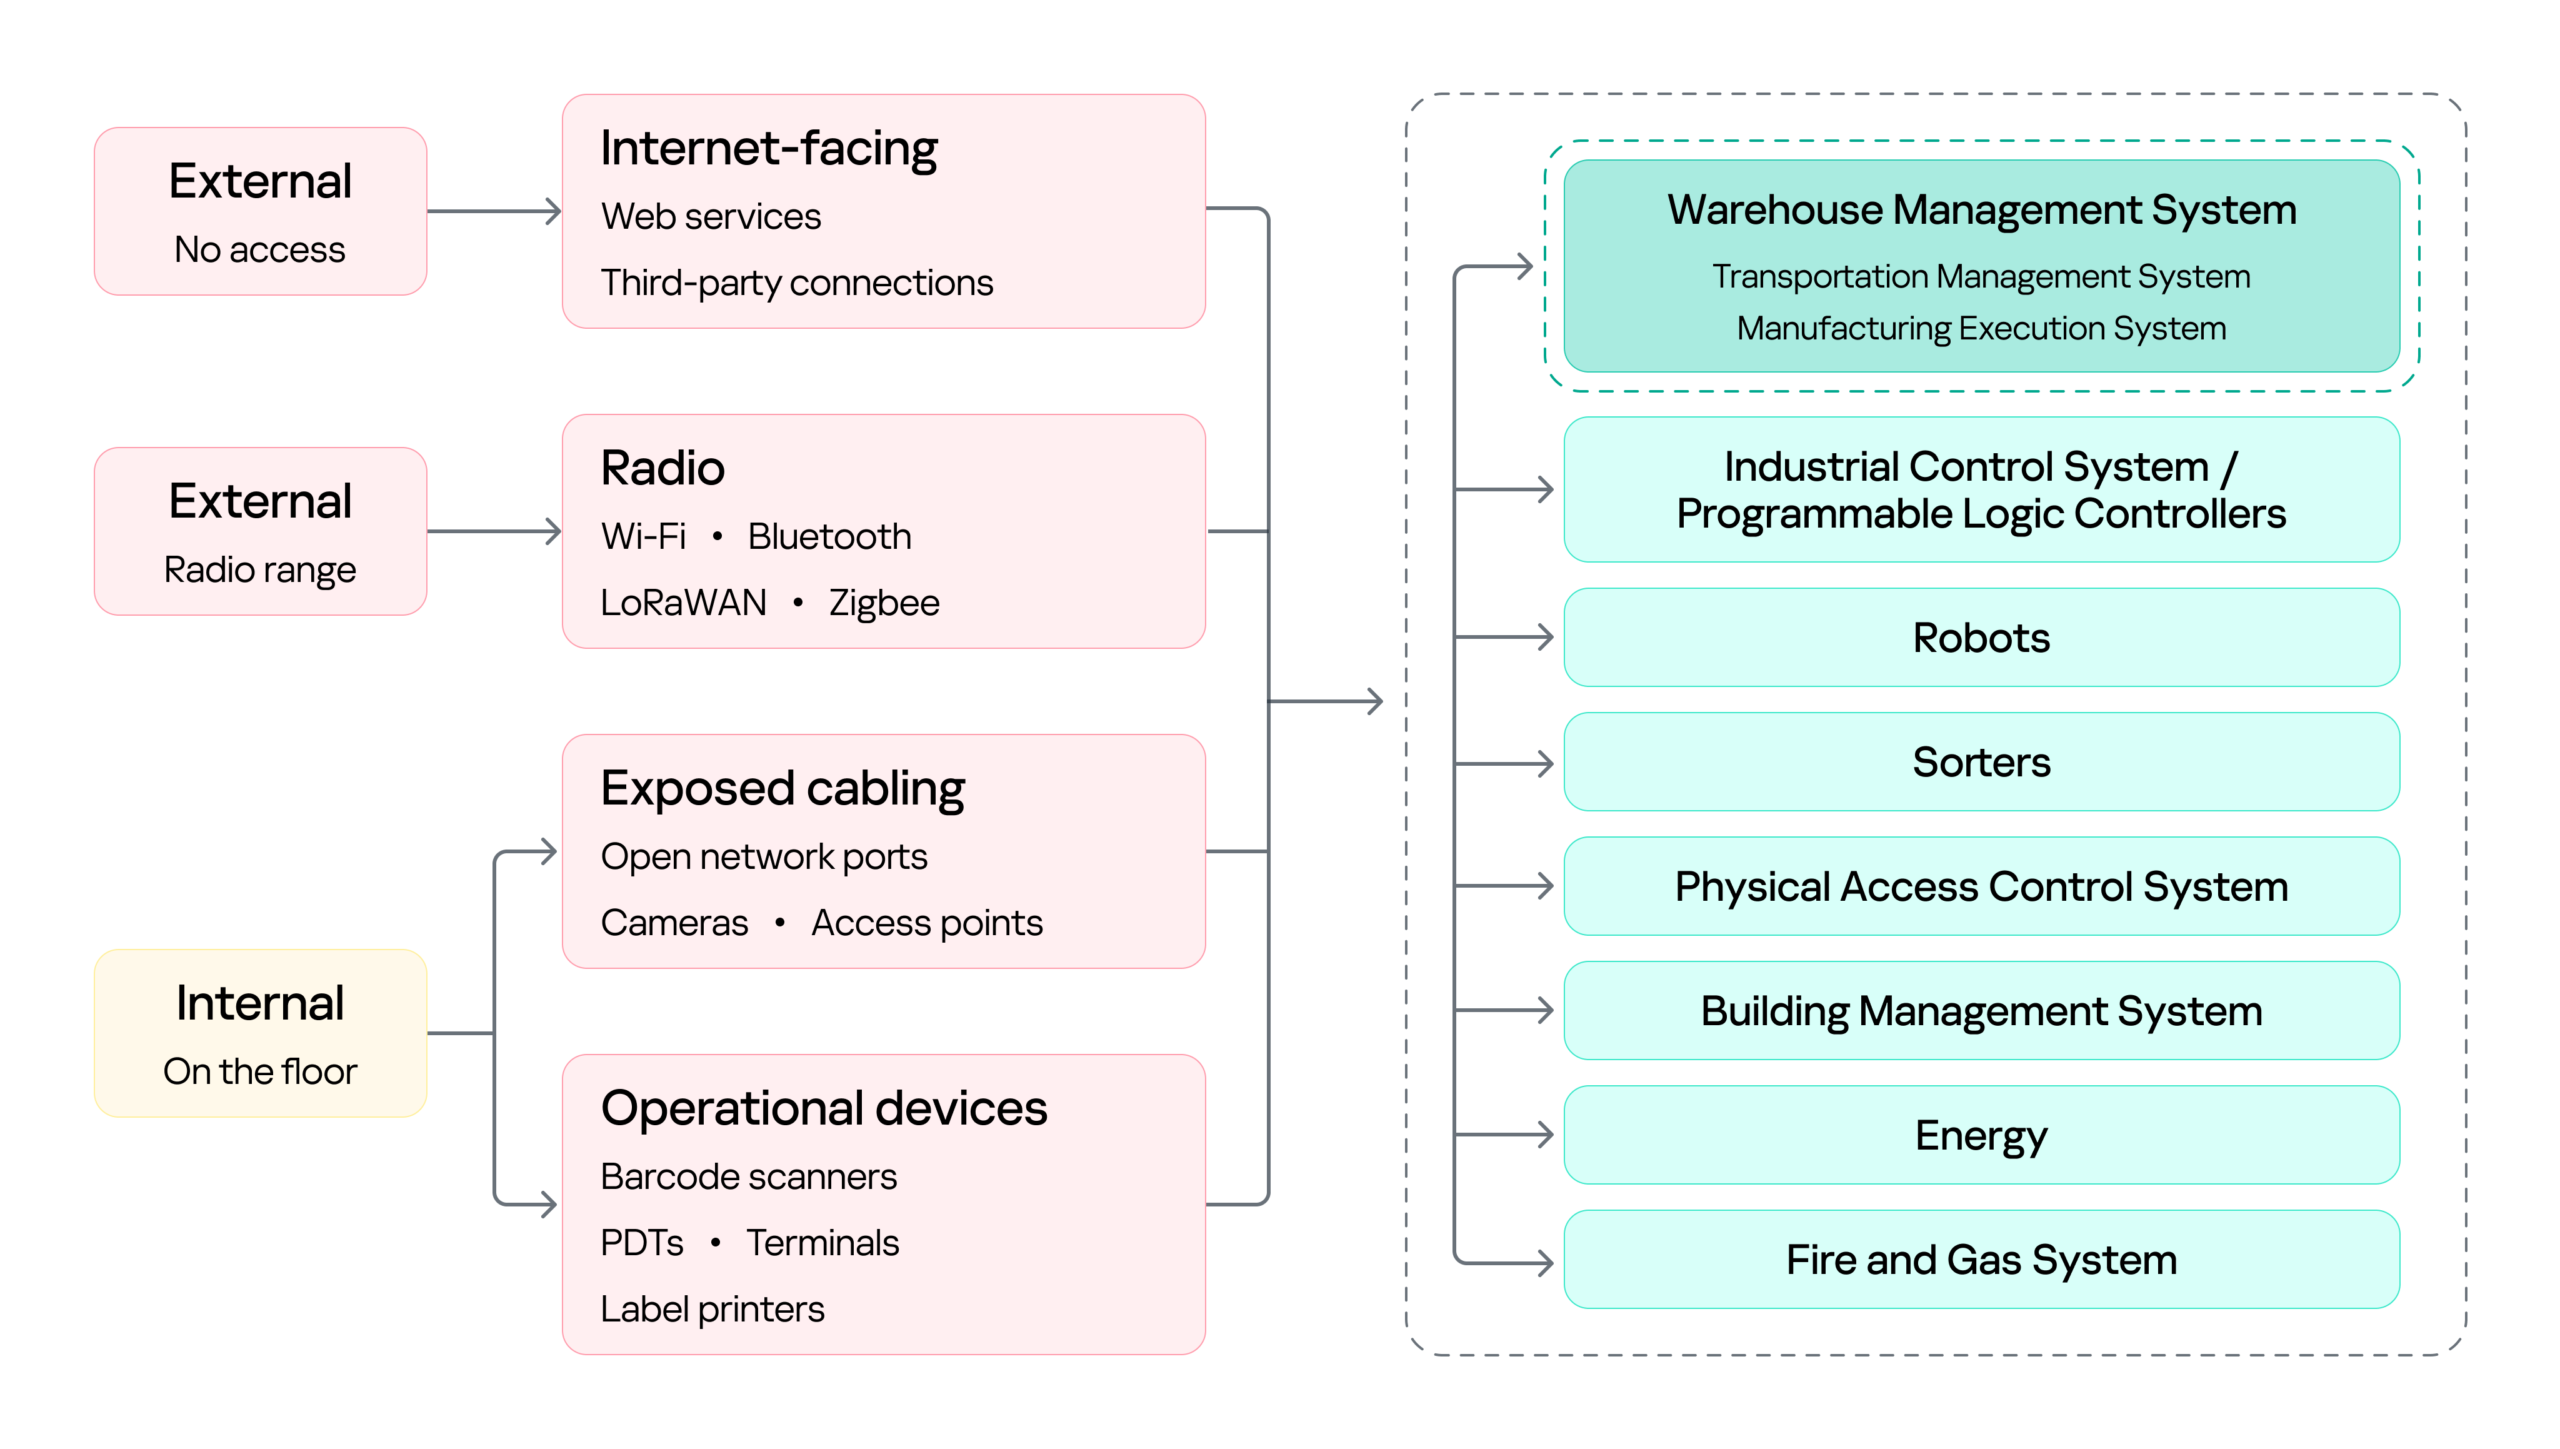
Knowing what is at risk and who might come after it still leaves the most practical question open: how they would actually get in, and how far they could go once they did. The diagram below sets out the warehouse’s attack surface: every point where an attacker can get in, organized by the access that reaching each point requires.
Warehouse attack surface

Warehouse attack surface

On the left are the attacker categories discussed above, distinguished by where they stand and what access they already hold. Each reaches the environment through a different set of entry points, and the impact of a successful attack can land on several systems, from the WMS to OT systems such as robots, sorters, and physical access control system (PACS). The WMS is highlighted because it is the most significant of these: it coordinates the OT systems, so compromising it can affect the entire operation rather than a single process.

Next, we will cover the initial access vectors, the points a threat actor can use to reach the warehouse environment. Following that, we turn to the impact on the logistics processes themselves, focusing on the WMS, since its compromise affects every logistics operation that depends on it.

Initial attack vectors

Internet-facing services

Remote access through internet-facing services, third-party connections, and corporate networks gives an external attacker a foothold on the warehouse network infrastructure. It is a well-covered problem and not specific to this environment, so we note it here as an entry point but will not examine it further.

Wi-Fi, Bluetooth, and other radio channels

Wi-Fi connects handhelds, tablets, printers, cameras, and workstations. Bluetooth serves scanners, headsets, and positioning beacons. Zigbee and similar low-power protocols run lighting, sensors, and building automation, while LoRaWAN carries telemetry over long distances. Cellular provides a backup channel for kiosks and contractor equipment, and proprietary protocols control industrial panels and specialized machinery.

Radio passes through windows, gates, roofing, and thin external panels, so a network built for receiving and processing goods may be reachable from the parking lot and, with a directional antenna, from considerably farther away.

That reach matters in two ways. It gives an external attacker a place to start, as proximity alone is enough to reach the Wi-Fi and the low-power protocols, and from there to gain an initial foothold in the warehouse networks.

However, radio does not only lead into the network. It also connects directly to the field devices and carries the live control traffic of warehouse operations, which makes availability a first-order concern. If hundreds of handhelds lose their connection at once, picking stops. If an AGV loses its control channel, the safe reaction may be to halt in place, and a stopped machine can block an entire route.

Physical network

The scale of the warehouse itself is part of the attack surface. A fulfillment warehouse can run up to tens of thousands of square meters, with racking climbing several stories and walkways threading through it. Structured cabling runs along that racking, cameras and access points are mounted on that, and wall jacks sit behind pallets that have not moved in months. Almost none of it is in anyone’s line of sight.

That gives a person in the warehouse something a normal office does not: unsupervised access to live network infrastructure. Unplugging a ceiling camera leaves an active port. An unused jack behind a shelf leaves another. Neither requires tools, credentials, or any interaction with a system that logs anything. And since the camera or access point sits on the same segment as the rest of the site, the compromised port, not being isolated, opens a path to the network core.

Barcode scanners

Barcode scanners are everywhere in a warehouse. They are the main tool workers use to tell the system what is moving and where, supporting receiving, picking, packing, and inventory management. A typical setup has handheld scanners communicating with a base station, which is in turn connected to a workstation or another business system.

This makes the scanner an entry point into the core network in two ways.

First, through the barcode itself. Since the scanner acts as a keyboard to the connected host, a maliciously crafted barcode or QR code can inject keystrokes when scanned, potentially giving the attacker an initial foothold on the host without directly accessing the network.

Second, through the scanner’s wireless link. During a customer engagement, with the provided test stand of such a device, we discovered that an attacker within range could inject keystrokes into the connected host and potentially achieve remote code execution without user interaction. This attack pattern was observed across multiple vendors, including, for example, Honeywell devices affected by CVE-2026-4272.

In both cases, the result is the same: a foothold on a host inside the warehouse network. The scanner is simply the entry point; the significance of that foothold comes from the host’s trusted position within the operational environment and its connectivity to core systems.

Portable data terminals

Portable data terminals (PDTs) are essentially ordinary Android devices with an embedded barcode scanner, carried by workers to scan items; each scan is passed to a dedicated application that forwards it to a remote server over an API. To keep workers on task, the devices usually run in kiosk mode, locking the user to that single application and preventing interaction with the rest of the Android system.

That lockdown is exactly what an attacker wants to break, and breaking it is what turns the terminal into an initial access vector: escaping the kiosk can expose the Wi-Fi password of the network the terminal is connected to, or allow malicious software to be installed that gives the attacker remote access to the network over the internet.

Printers

Warehouses contain different types of printers. Alongside the usual IT printers used for documents and paperwork, there are specialized thermal printers, small devices that use heated elements on the printhead to create labels, barcodes, and tags. As we mentioned earlier, these are mainly used to print the labels, usually containing barcodes, that are attached to goods during the putaway stage.

Here we focus on mobile thermal printers: small, battery-powered devices that workers can carry or wear. They typically connect to the internal network over Wi-Fi to receive print commands, while also supporting Bluetooth for connecting to nearby devices. This combination makes them a potential entry point into the internal network.

Some models, such as the Zebra ZQ630, support multiple interfaces and can run applications directly on the device. During a security assessment, we discovered that apps can be uploaded and executed over Bluetooth. By exploiting a pairing misconfiguration, an attacker within Bluetooth range could bypass pairing, upload malicious software, and gain an initial foothold through the printer.

Impact on logistics processes (attacks on WMS)

With a foothold in the network, an attacker can pivot to the logistics processes themselves: from the WMS through the warehouse infrastructure to the PLCs and the machinery they drive. As we saw earlier, all OT systems and devices are interconnected and the WMS sits at the head of that chain: it is the system of record every other process reads from and writes to, so compromising it reaches all of them at once. That, and its being specific to this environment, is why it is the focus here.

Warehouse management systems (WMS) are the software platforms that optimize warehouse processes from the entry of goods to their exit. They provide real-time visibility into inventory and orchestrate end-to-end fulfillment by integrating with many warehouse subsystems and pieces of automation equipment, such as conveyors, PLCs, robotics, scanners, and voice systems. A typical WMS includes modules for receiving, inventory control, order management, labor management, shipping, and reporting. Major vendors include SAP EWM, Oracle Warehouse Management, Manhattan Active, Blue Yonder, Infor, KΓΆrber/HighJump, Microsoft, and TECSYS.

To picture how central this is, think back to our unicorn. From the moment it was scanned at receiving, it stopped being only a physical box and became a record inside the WMS, a record the system then used to decide where it should be stored, when it should be picked, how it should be sorted, and where it should ship. Every device employed along the wayΒ β€” the PDT at receiving, the printer at putaway, the workstation at picking, the conveyor at sortingΒ β€” was really just talking to the WMS. It is the thread that ties all eight stages together, which is exactly what makes it such a valuable target.

Because modern WMS platforms are usually web-based and heavily interconnected, they inherit common web and API vulnerabilities alongside flaws specific to the WMS itself. A recent example is CVE-2026-70774 in Oracle Warehouse Management, part of Oracle E-Business Suite. Oracle rated it High and described it as an easily exploitable authorization bypass flaw in which a low-privileged attacker with network access can compromise the application, affecting integrity and availability by allowing unauthorized creation, deletion, or modification of critical data.

A flaw like this may look like a typical web application issue, but its consequences in a warehouse are more serious, because the WMS is the system of record. If an attacker can modify its data, they can alter stock levels, bin locations, receiving records, picking tasks, or shipment information, silently corrupting the digital twin of the warehouse. And since the eight stages form a dependency chain, that corruption doesn’t stay contained: a falsified record at receiving is inherited by putaway, picking, and everything downstream. The physical box and its record diverge, and every later process trusts the record.

The most direct version of this attack comes from an authorization bypass flaw like the Oracle vulnerability above. Here the threat actor can be an external attacker who has reached the application over the network, or an insider such as a low-privileged operator or storekeeper who already holds a legitimate account.

The danger grows when such a flaw is chained with others. An external attacker who combines remote code execution with SQL injection could generate shipment orders to arbitrary addresses together with the documents needed for goods to physically leave the warehouse, fabricate waybills, acceptance or transfer records, and registers, while also exposing customer data such as names and delivery addresses. In effect, the goods are sent out with legitimate-looking paperwork.

This is why ordinary web vulnerabilities carry considerable weight in a WMS. For an external attacker or an insider probing beyond their assigned role, broken access control could open a path into another warehouse zone, allow manipulation of other workers’ tasks, permit unauthorized exception operations, or expose administrative APIs. A server-side request forgery flaw could force the WMS server to reach resources an external attacker cannot touch directly, and if the network is flat or only formally segmented, that server may in turn reach internal management panels, cloud service interfaces, or systems sitting close to the operational network, turning a single web bug into a bridge between IT and OT.

Attacks on a WMS don’t always target the application directly, though. As we saw while tracing the unicorn, the warehouse is full of connected devices that already hold trusted access. A handheld terminal carries authenticated WMS API access as a matter of course, and anyone who gains control of that terminal inherits it (by escaping the kiosk, for example). Depending on the device’s permissions, that might mean confirming picks that never occurred, falsifying receiving operations, adjusting stock counts, or marking orders completeΒ β€” something warehouse employees themselves could use to avoid their assigned duties.

Where the WMS is connected to control and automation systems, access to the WMS can extend into physical operations, including conveyors, sorting systems, lifts, doors, and pumps.

PLCs translate WMS instructions and sensor inputs into physical actions. Compromising a system that controls them therefore creates an opportunity to manipulate those actions. The impact can be as simple as a sorting diverter sending boxes down the wrong route, a conveyor repeatedly entering an error state and creating a backlog, or a falsified sensor value causing a line to be treated as clear when it is full.

However the WMS is compromised, the business consequence is the same: inventory corruption, unauthorized shipments, and operational disruption, each reaching the customer in the end as a late or missing delivery, the wrong item in the box, or a personal address exposed to a stranger.

Securing the unicorn

We followed our unicorn through web applications and databases, radio channels and PDTs, printers, conveyors, robots, and the loading zone. Because warehouse environments combine IT, OT, wireless, physical, and human components, security controls should be implemented as a single, coordinated security architecture rather than as isolated measures. Network segmentation should be a foundational control, with clear separation between corporate IT, warehouse OT, operational devices, management networks, and externally connected systems. Segmentation should also extend across facilities and customer environments so that each site and customer integration is isolated from the others, limiting the potential impact of a compromise. A zero-trust approach should reinforce this architecture by requiring explicit authentication and authorization for connections between systems, regardless of their network location, and by applying least-privilege access wherever possible. Regular penetration testing of the corporate IT environment, including domain services, identity infrastructure, and endpoints, should be incorporated into the warehouse security program.

Physical and network access controls should be implemented together. Access to warehouse facilities, network rooms, communication cabinets, and operational areas should be restricted according to business need, with appropriate authentication, monitoring, and access logging. Network infrastructure should be hardened through controls such as switch port security, MAC-based access restrictions where appropriate, and IEEE 802.1X with EAP-TLS for strong device and user authentication. Network equipment should also be securely configured and regularly reviewed to ensure that unused interfaces, insecure management protocols, default credentials, and unnecessary services are disabled.

Web applications and their supporting infrastructure should be governed through a secure software development lifecycle (SSDLC), including security requirements, secure coding practices, code and dependency review, and application security assessment before deployment and throughout the application’s lifecycle. Third-party applications and components should be continuously monitored and updated, with a defined vulnerability and patch management process. This should explicitly include warehouse management systems (WMS), warehouse portals, APIs, and other applications that provide operational or customer-facing functionality.

Wireless technologies should be subject to dedicated security assessment and engineering. Radio-frequency surveys should be conducted to establish expected coverage, identify unauthorized or unexpected signals, validate the availability and protection of operational communications, and determine whether wireless deployments create unintended access paths into warehouse networks. Wireless security should be assessed not only from a connectivity perspective but also in terms of authentication, encryption, device provisioning, protocol exposure, interference resilience, and the potential impact of unauthorized devices.

Warehouse operational devices should be incorporated into the organization’s endpoint security and vulnerability management processes. Devices should receive security updates and firmware patches on a defined schedule, with accelerated remediation for critical vulnerabilities. Security assessments should be performed periodically to identify weaknesses in device configuration, applications, exposed services, and authentication mechanisms.

Personnel security should form an additional layer of the warehouse security architecture. In most industrial and ICS environments, getting inside means clearing background checks, holding relevant qualifications, or proving prior experience; the hiring process itself acts as a filter. A warehouse is different. Roles in sorting, packing, and courier work are hired quickly and in volume, and they typically require no prior expertise, certification, or specialized background at all. An ordinary person can walk in off the street, be hired within days, and immediately hold legitimate physical access to the facility. Therefore, a more restrictive and risk-based approach to hiring should be considered, particularly for roles that provide access to sensitive areas, operational systems, network infrastructure, or customer assets.

Ultimately, all of these measures serve the same objective: protecting the continuity and reliability of the warehouse as a whole. This matters because real warehouses handle food, medicines, machine parts, and the millions of ordinary things people and companies depend on every day. Protecting their journey means seeing the warehouse as it has actually become: a single digital system with doors, motors, shelving, and radio signals, and with entirely real consequences when it fails. And if the security program works, the customer never knows any of this happened. The unicorn simply arrives at the scheduled time.

If your warehouse operations rely on interconnected systems like these, we can help identify the gaps before an adversary does. Reach out to discuss a security assessment.
Threat landscape for industrial automation systems. Q2 2026

27 August 2026 at 06:05

All threats

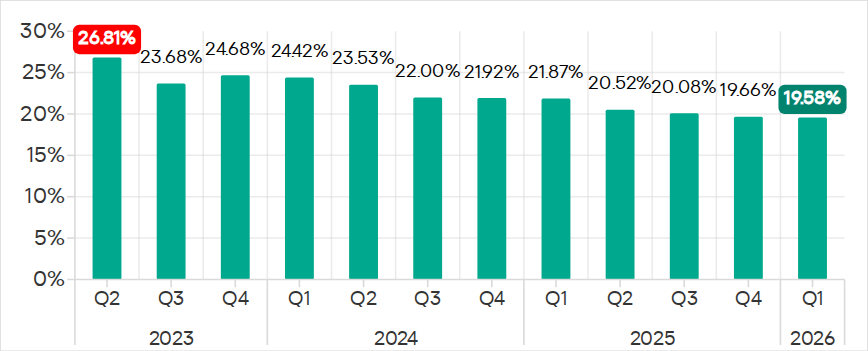
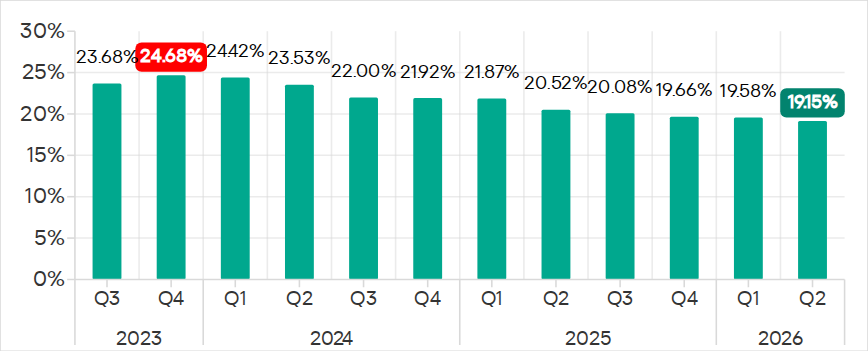
In Q2 2026, the percentage of ICS computers on which malicious objects were blocked continued to decrease, falling to 19.15%, its lowest level since 2022.

Percentage of ICS computers on which malicious objects were blocked, Q3 2023–Q2 2026

Percentage of ICS computers on which malicious objects were blocked, Q3 2023–Q2 2026

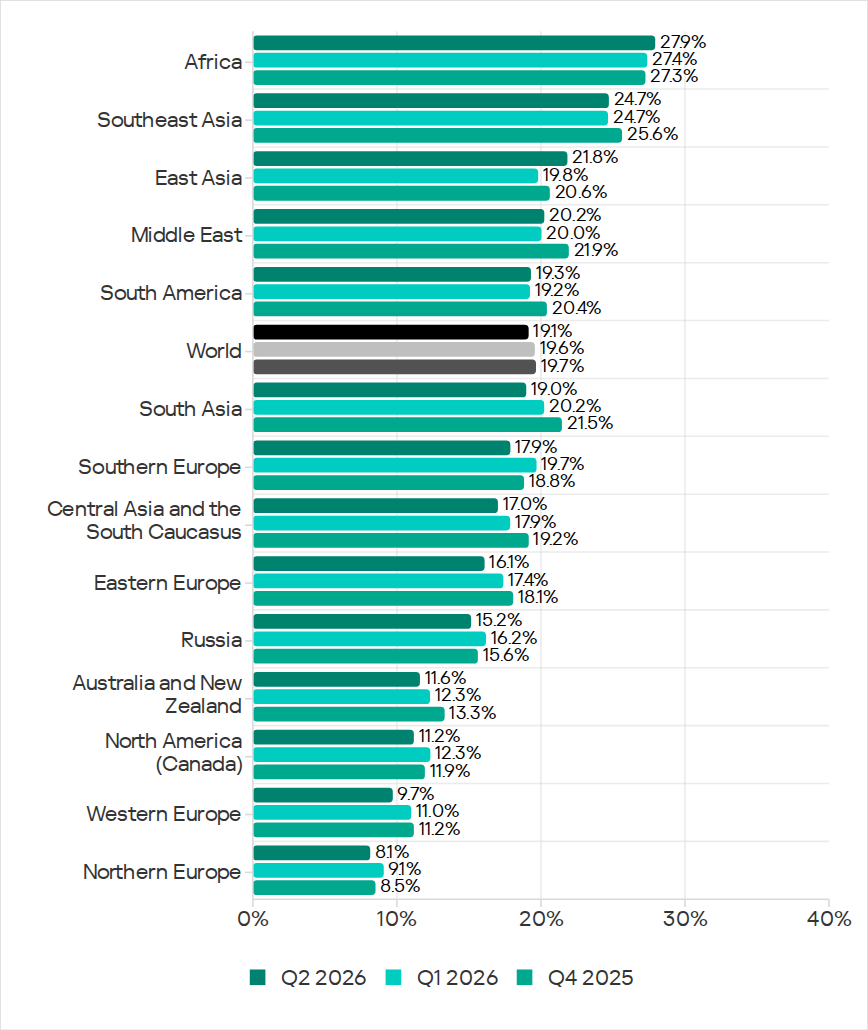
Regionally, the percentages ranged from 8.1% in Northern Europe to 27.9% in Africa.

Regions ranked by percentage of attacked ICS computers

Regions ranked by percentage of attacked ICS computers

The figures increased in five regions over the quarter, most notably in East Asia (by 2.0 pp) and Africa (by 0.5 pp).

East Asia saw increases in percentages for all threats except miners. The region ranked first in terms of growth for malicious scripts and phishing pages, spyware, and viruses. East Asia also led in terms of growth in threats from the internet. The percentage of ICS computers on which email threats were blocked also increased.

Selected industries

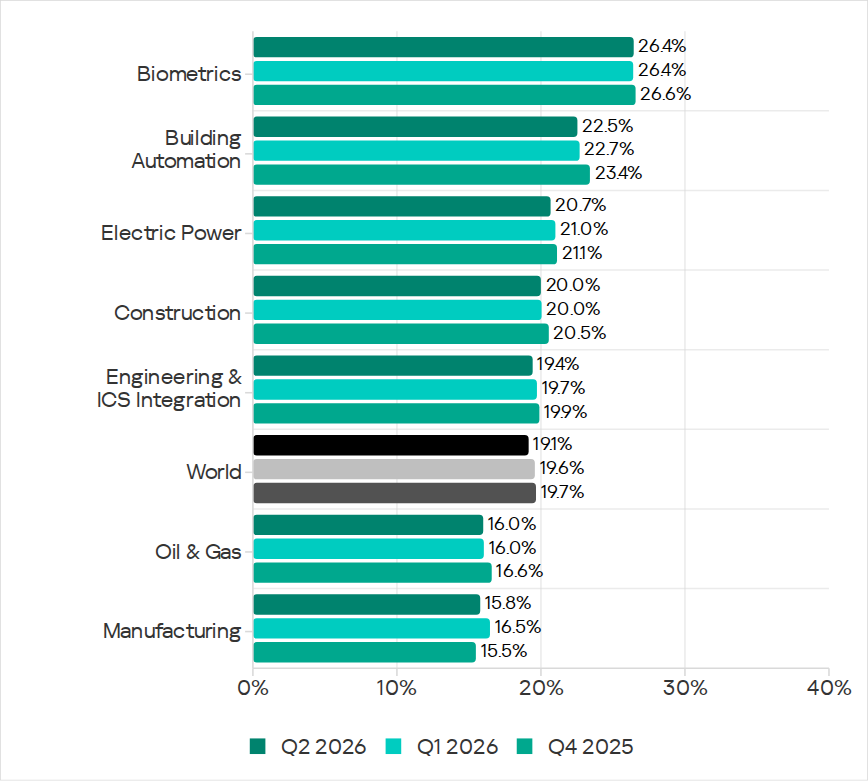
The biometrics sector (26.44%) has traditionally led the rankings of industries and OT infrastructures surveyed in this report in terms of the percentage of ICS computers on which malicious objects were blocked. Biometric systems are characterized by the availability of internet access, extensive email use for data exchange and approvals (e.g. access granting), and, in many cases, minimal cybersecurity controls within the organizations that use them.

Industries ranked by percentage of ICS computers on which malicious objects were blocked

Industries ranked by percentage of ICS computers on which malicious objects were blocked

The biometrics sector ranked first among industries in terms of the following threat categories: malicious scripts and phishing pages, malicious documents, spyware, ransomware, and worms. The sector is also leading among industries in terms of email threats. At the same time, unlike other industries, the percentage of affected ICS computers for email threats in biometrics exceeds that for internet threats.

In all selected industries, the global average follows a downward trend.

Threat categories

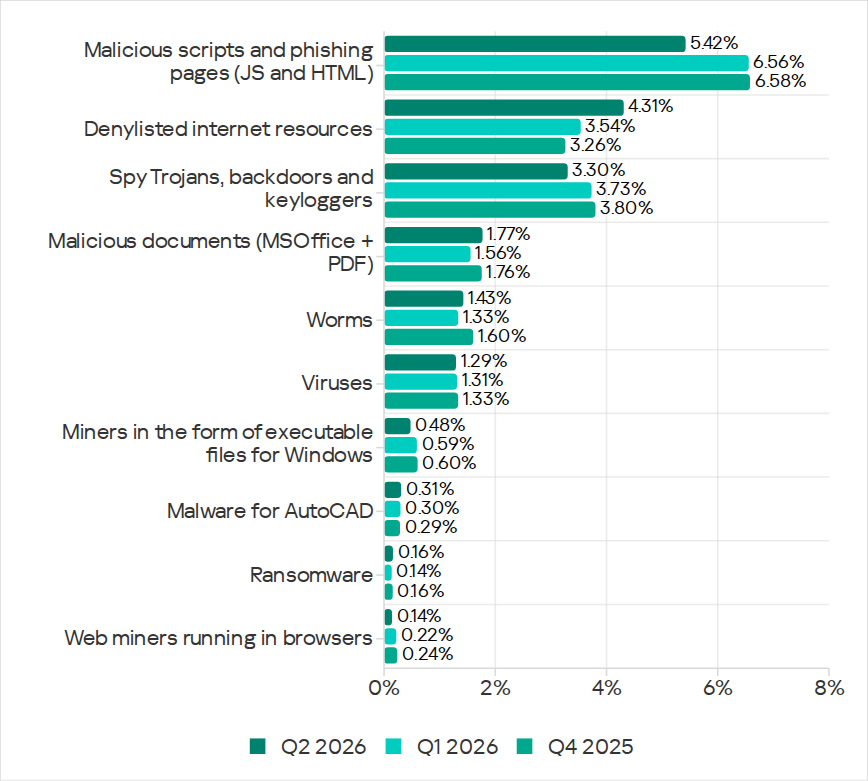
In Q2 2026, Kaspersky security solutions blocked malware from 10,904 different malware families of various categories on industrial automation systems.

Over the quarter, the percentage of ICS computers on which malicious objects of the following categories were blocked increased: denylisted internet resources, malicious documents, worms, ransomware, and malware for AutoCAD.

Percentage of ICS computers on which the activity of malicious objects from various categories was blocked

Percentage of ICS computers on which the activity of malicious objects from various categories was blocked

Malicious scripts and phishing pages (JS and HTML)

Malicious scripts and phishing pages remained in first place in the threat category rankings based on the percentage of ICS computers on which the respective threats were blocked. In Q2 2026, the global average dropped to 5.42%.

Over the quarter, the figure for this category only increased in East Asia, rising by 0.93 pp to 4.86%. This is the second-highest figure in the region in the last three years.

In East Asia, the percentage of ICS computers affected by malicious scripts and phishing pages increased in all the industries surveyed, except construction. The highest figures were recorded for biometrics (9.01%) and building automation (6.49%).

Denylisted internet resources

In Q2 2026, denylisted internet resources rose in the threat category rankings from third to second place, displacing spyware. Globally, the percentage of ICS computers on which denylisted internet resources were blocked has been increasing for two quarters in row and reached 4.31%.

The figures increased in all regions over the quarter, most notably in Russia (by 1.33 pp). Moreover, Russia ranked first (5.17%) among the regions in terms of denylisted internet resources. Since 2022, the region has topped these rankings twice before, both times in Q2: in 2022 and 2024.

Among the selected industries in Russia, the highest figures for the denylisted internet resources were in the electric power (6.61%) and engineering and ICS integration (5.62%) industries.

Malicious documents (MSOffice + PDF)

Malicious documents ranked fourth in the threat category rankings by the percentage of ICS computers on which they were blocked. The percentage for this category decreased over the previous three quarters, reaching its lowest level in three years. However, in Q2 2026, it increased to 1.77%.

Over the quarter, the figures for malicious documents increased in seven regions, most notably in South America (by 1.35 pp) and Southern Europe (by 0.48 pp). These two regions are among the top three in terms of malicious documents, malicious scripts and phishing pages, as well as threats from email clients.

South America ranked second in the rankings of regions in terms of malicious documents. In Q2 2026, the percentage of ICS computers in the region on which this threat was blocked was 3.56%, which was the fourth highest in three years.

Among the selected industries in South America, the highest percentage of ICS computers on which malicious documents were blocked was in biometrics (6.67%).

Southern Europe ranked first in the rankings of regions in terms of malicious documents. In the previous quarter, the percentage of ICS computers in the region on which this threat was blocked was the lowest in three years, but in Q2 2026 it increased to 3.63%.

Among the selected industries in Southern Europe, the highest percentage of ICS computers on which malicious documents were blocked was once again in biometrics (11.48%).

Spyware

Spyware ranked third in the threat category rankings based on the percentage of ICS computers on which it was blocked. The percentage for this category (3.30%) is the lowest since 2022.

Over the quarter, the figures increased in three regions, most notably in East Asia (by 0.53 pp) and Southeast Asia (by 0.42 pp).

East Asia ranked third based on the figures for spyware (4.77%), behind Africa and Southeast Asia. This is the region’s highest rate since Q2 2025. Among the countries and territories in the region, the highest percentage of ICS computers on which spyware was blocked was in mainland China (6.61%). Among the selected industries in East Asia, the highest figures for spyware were in the electric power (11.75%) and manufacturing (5.87%) industries. In all the industries surveyed, the figures are higher than the regional average.

Southeast Asia ranked second after Africa in the ranking of regions in terms of spyware, with 5.32%. Among the selected industries in Southeast Asia, the highest figures for spyware were in biometrics (8.93%) and manufacturing (7.32%). The figures increased in all industries over the quarter.

Ransomware

The percentage of ICS computers on which ransomware was blocked decreased in the previous three quarters but increased to 0.16% in Q2 2026.

During the quarter, the percentage increased in all regions, except Western and Southern Europe and North America (Canada). Africa led the ranking in terms of growth for this metric.

In Q2 2026, Africa ranked first among the regions in terms of the percentage of ICS computers on which ransomware was blocked (0.29%). The only time the figure in the region was higher in the past three years was Q2 2025 (0.31%).

Among the selected industries in Africa, the highest figures for ransomware were in the electric power industry (0.72%) and biometrics (0.52%). Over the quarter, the figures increased in all industries, except manufacturing and construction. The biggest increase was recorded in the electric power industry.

In Russia, the percentage of ICS computers on which ransomware was blocked in biometric systems has increased for three consecutive quarters, reaching 1.22%. This is the highest level of ransomware across all industries in all regions.

Miners

In Q2 2026, the percentage of ICS computers on which miners were blocked was the lowest since 2021, for both miners in the form of executable files for Windows (0.48%) and web miners running in browsers (0.14%).

The figures for both categories decreased in all regions, except for Africa where figures for miners in the form of executable files for Windows increased slightly.

On average, the oil and gas industry led the rankings among the selected industries both in terms of miners in the form of executable files for the Windows OS (0.66%)Β and in terms of web miners (0.34%).

Worms

In Q2 2026, the percentage of ICS computers on which worms were blocked increased to 1.43%.

In Q2 2026, the Middle East (2.11%) was second (after Africa) in the rankings of regions in terms of worms, displacing Central Asia and the South Caucasus.

Among the selected industries in the Middle East, the highest percentage of ICS computers on which worms were blocked was in building automation (2.90%). Over the quarter, the figures increased in all industries.

Australia and New Zealand ranked 12th among the regions in terms of the percentage of ICS computers on which worms were blocked (0.41%). Over the past three years, the figure in this region was only higher in Q2 2024 (0.42%). The figures increased in all the surveyed industries in the region, most notably in manufacturing and electric power. As a result, for these industries they exceeded the regional average by 2.9 and 2.3 times, respectively.

Viruses

In Q2 2026, the percentage of ICS computers on which viruses were blocked decreased to 1.29%.

The top three regions for this metric remain unchanged: Southeast Asia (6.03%), Africa (4.22%), and East Asia (3.14%). These same regions lead the rankings in terms of malware for AutoCAD.

The figures increased in three regions: East Asia, Australia and New Zealand, and Africa, where it has been growing for four consecutive quarters and reached its highest value since 2022.

Among the selected industries in Africa, the highest percentage of ICS computers on which viruses were blocked was in construction (5.47%).

East Asia ranked third among the regions in terms of viruses, reaching the highest level in the region for the past three years. Among the countries and administrative regions of East Asia, mainland China is the clear leader in terms of viruses (5.07%).

Among the selected industries in East Asia, the highest percentage of ICS computers on which viruses were blocked was in construction (5.93%).

In Australia and New Zealand, the increase in the percentage of ICS computers on which viruses were blocked was primarily due to a 4.3-fold increase in the figure for the electric power industry: from 0.29% to 1.24%. For a region where the percentage of attacked ICS computers for all threats is 0.12%, this is a very high value.

Malware for AutoCAD

In Q2 2026, the percentage of ICS computers on which malware for AutoCAD was blocked increased to 0.31%.

The most notable increase over the quarter was observed in Africa. After more than doubling in the previous quarter, the figure for the region continued to rise (although not so dramatically), reaching 1.02%.

Among the selected industries across all regions, the highest percentage of ICS computers on which malware for AutoCAD was blocked was in construction in East Asia (6.38%) and in Southeast Asia (4.05%).

Main threat sources

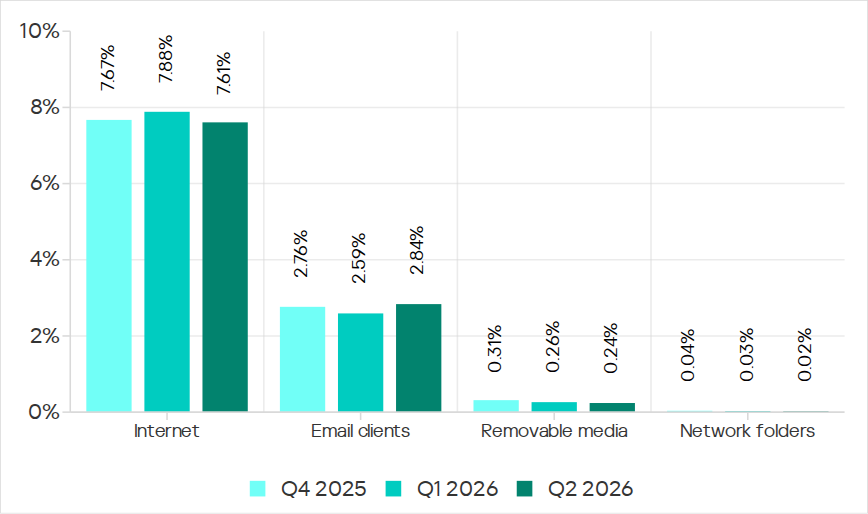
In Q2 2026, of all the threat sources, the percentage increased only for email.

Percentage of ICS computers on which malicious objects from various sources were blocked

Percentage of ICS computers on which malicious objects from various sources were blocked

Internet

The percentage of ICS computers on which threats from the internet were blocked decreased to 7.61%, reaching its lowest level since 2021.

Over the quarter, the percentage increased in three regions: East Asia by 0.8 pp (to 6.3%), South Asia by 0.3 pp (to 10.4%), and Russia by 0.3 pp (to 6.4%).

Among the selected industries across all regions, the highest percentage of ICS computers on which threats from the internet were blocked was in biometrics (13.03%) and engineering and ICS integration (12.16%) in South Asia.

Email

The percentage of ICS computers on which email threats were blocked increased to 2.84%.

In Q2 2026, the percentage of ICS computers on which email threats were blocked increased in South America by 1.0 pp (to 5.2%) and in Africa by 0.7 pp (to 4.3%).

Among the selected industries across all regions, the highest percentage of ICS computers on which email threats were blocked was in biometrics (19.14%) and building automation (12.49%) in Southern Europe.

Removable media

The percentage of ICS computers on which threats from removable media were blocked continued to decrease, reaching 0.24%, the lowest value for the period under review.

Among the selected industries across all regions, the highest percentage of ICS computers on which threats from removable media were blocked was in the electric power industry in East Asia (1.34%) and biometrics in Africa (1.29%).

Network folders

The percentage of ICS computers on which threats from network folders were blocked continued to decrease. In Q2 2026, it was the lowest for the period under review, at 0.023%.

The only region to see an increase in the percentage of ICS computers on which threats from network folders were blocked during the quarter was Africa. This was mainly due to an increase in the building automation figure to 0.05%.

Among the selected industries across all regions, the highest percentage of ICS computers on which threats from network folders were blocked was in biometrics (0.23%), building automation (0.17%), and engineering and ICS integration (0.13%) in East Asia.

For more information on industrial threats see the full version of the report.

Threat landscape for industrial automation systems. Q1 2026

7 July 2026 at 06:00

All threats

The percentage of ICS computers on which malicious objects were blocked continued to decrease, reaching 19.6% in Q1 2026. This is the lowest value in three years, and it is 1.4 times lower than in Q2 2023.

Percentage of ICS computers on which malicious objects were blocked, Q2 2023–Q1 2026

Percentage of ICS computers on which malicious objects were blocked, Q2 2023–Q1 2026

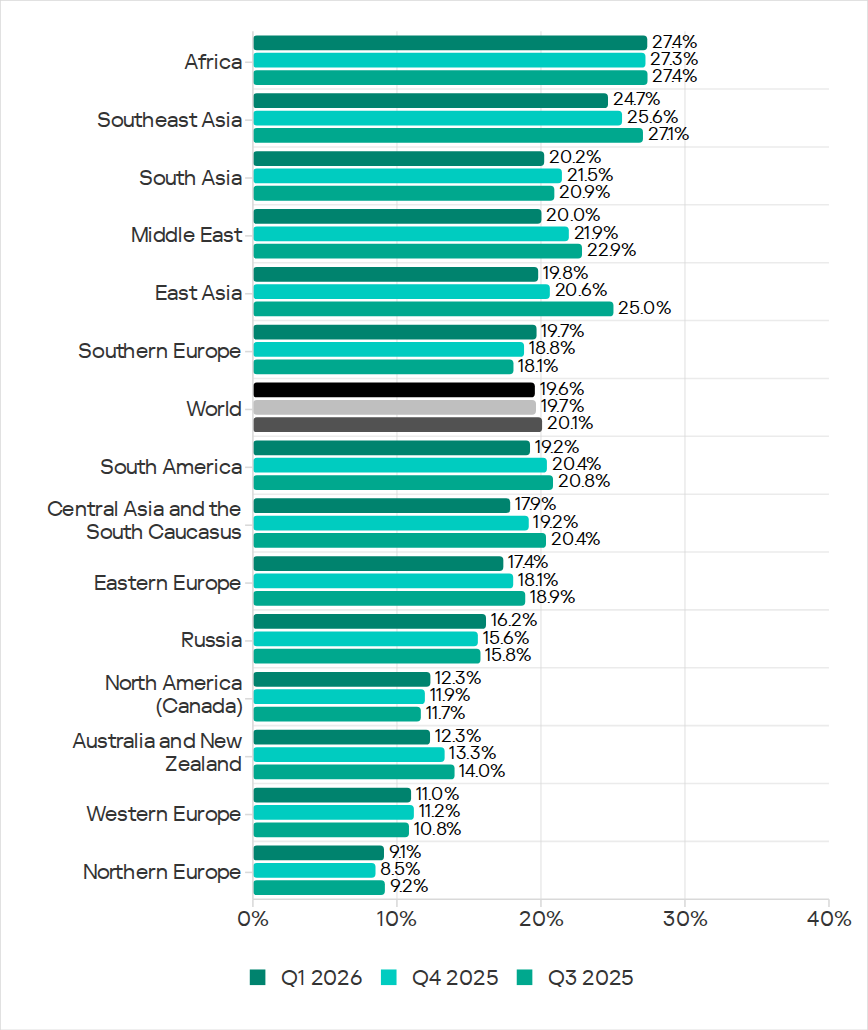
Regionally, the percentages ranged from 9.1% in Northern Europe to 27.4% in Africa.

Regions ranked by percentage of attacked ICS computers

Regions ranked by percentage of attacked ICS computers

The percentage of ICS computers on which malicious objects were blocked increased in five regions over the quarter, most notably in Southern Europe, Northern Europe, and Russia.

In Q1 2026, Southern Europe led the way in growth for internet and email threats. The region also saw the fastest growth in spyware, as well as malicious scripts and phishing pages.

In Russia, the percentage of ICS computers on which malicious objects were blocked exceeded the figures for the previous two quarters. Russia saw an increase in the percentage for threats from the internet, and a slight increase in the figure for threats from email clients (Russia is one of three regions where this figure did not decrease).

Among the threat categories, the greatest increases were observed in the percentages for denylisted internet resources, as well as spyware (distributed in the region via the internet and email clients).

Selected industries

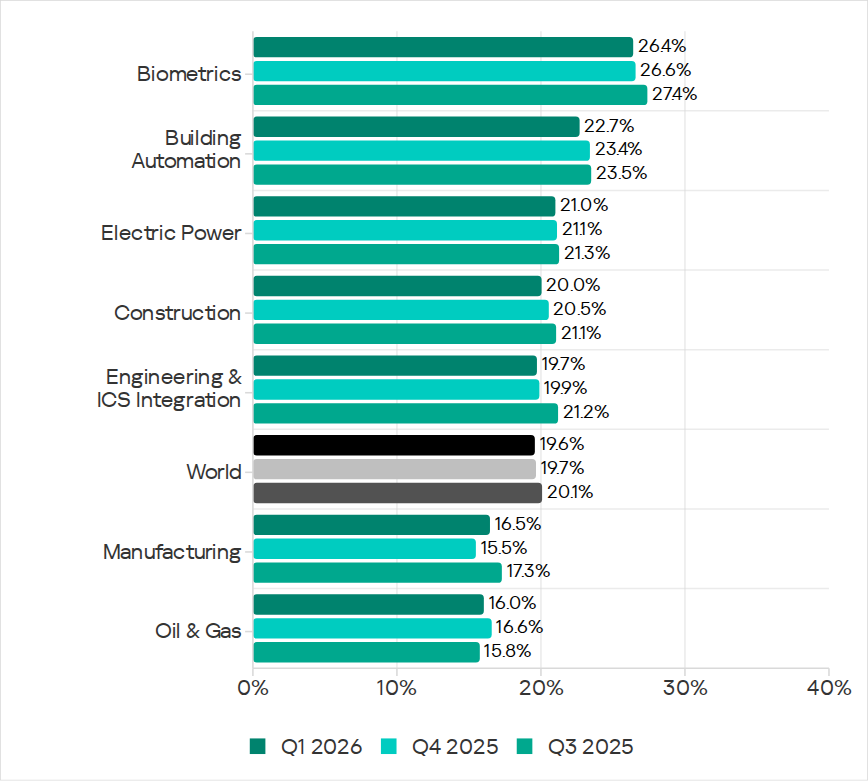
Biometric systems (26.4%) traditionally rank top among the industries and OT infrastructure types covered in this report in terms of the percentage of ICS computers on which malicious objects were blocked. These systems are characterized by internet access, extensive email use for data exchange and approvals (such as access granting), and, in many cases, minimal cybersecurity controls within the organizations that use these systems.

Industries ranked by the percentage of ICS computers on which malicious objects were blocked

Industries ranked by the percentage of ICS computers on which malicious objects were blocked

Biometric systems rank first among industries in terms of email threats. At the same time, unlike other industries, the percentage for email threats in biometric systems exceeds that for internet threats.

In all selected industries, the global average follows a downward trend. In Q1 2026, the percentage of ICS computers on which malicious objects were blocked increased only in the manufacturing sector β€” by 1.0 pp. The percentages for this industry increased across 10 regions, with the most notable increases in Western Europe, Northern Europe, and Russia.

Threat categories

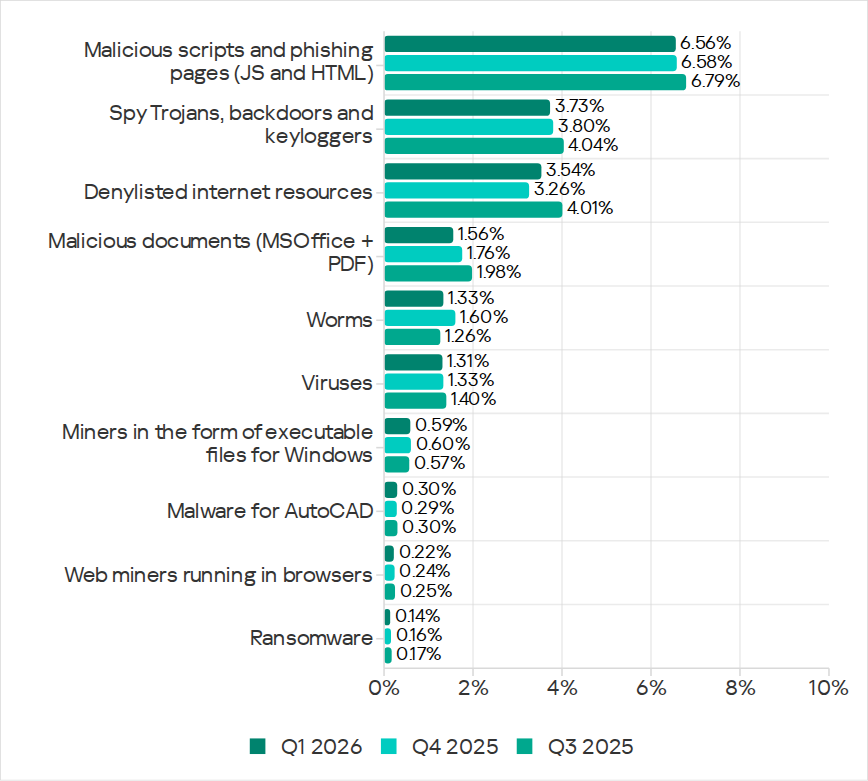
In Q1 2026, Kaspersky security solutions blocked malware from 10,052 different malware families of various categories on industrial automation systems.

Over the quarter, the percentage of ICS computers on which denylisted internet resources were blocked increased (after decreasing over the previous two quarters), and there was a slight increase in the percentage for AutoCAD malware.

Percentage of ICS computers on which the activity of malicious objects from various categories was prevented

Percentage of ICS computers on which the activity of malicious objects from various categories was prevented

Malicious scripts and phishing pages (JS and HTML)

Malicious scripts and phishing pages retained their to spot among threat categories by the percentage of ICS computers on which these threats were blocked. The global average in Q1 2026 was 6.56%.

Over the quarter, the percentages increased in four regions. The most significant change was observed in Southern Europe (9.85%, +0.94 pp). The figures for malicious scripts in the region increased over three consecutive quarters.

Among the selected industries, across all regions, the highest percentages for the malicious scripts and phishing pages category were recorded for biometric systems (19.59%) and building automation (15.43%) in Southern Europe. These same industries lead in similar rankings for malicious documents and spyware.

Spyware

The percentage of ICS computers on which spyware was blocked decreased over two consecutive quarters, dropping to 3.73%. Despite the decline, spyware has ranked second among threat categories by the percentage of attacked computers for three consecutive quarters.

The percentages increased in five regions over the quarter, most notably in Southern Europe (5.46%, +0.35 pp) and Russia (2.84%, +0.24 pp).

In Southern Europe, the percentage of ICS computers on which spyware was blocked increased in all the selected industries except manufacturing. The greatest increase was observed in biometric systems.

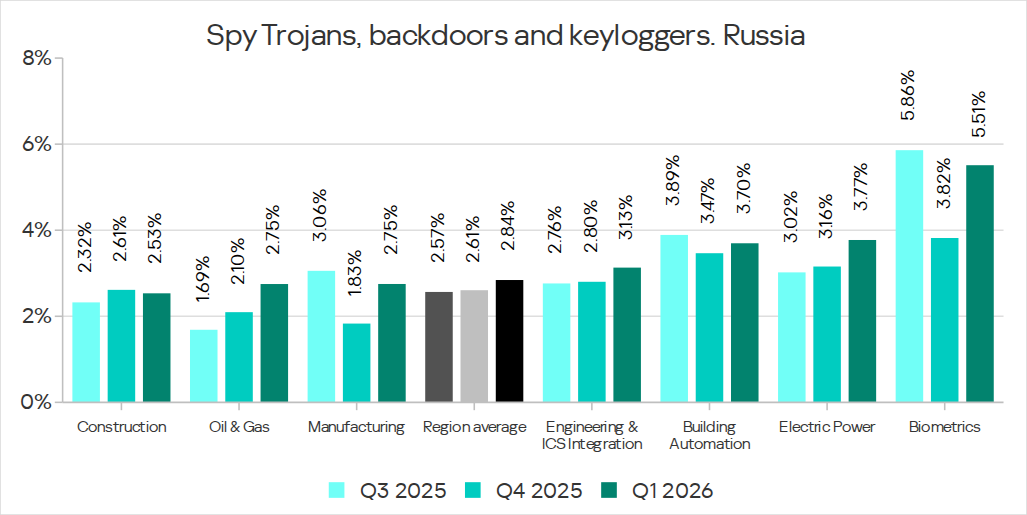
Among the selected industries, the highest percentage of spyware in Russia was recorded in biometric systems. That said, the percentage of ICS computers on which spyware was blocked increased in all industries in the region except construction. The percentage figure has been increasing for two consecutive quarters in the oil and gas industry (by a factor of 1.63 over six months), and for three consecutive quarters in engineering and ICS integration, as well as electric power. In the remaining sectors, the values have been fluctuating.

Percentage of ICS computers on which spyware was blocked in various industries in Russia, Q3 2025–Q1 2026

Percentage of ICS computers on which spyware was blocked in various industries in Russia, Q3 2025–Q1 2026

Denylisted internet resources

The percentage of ICS computers on which denylisted internet resources were blocked increased to 3.54%.

The most notable increase over the quarter occurred in Southeast Asia (4.58%, +0.65 pp). Among the industries in the region, the highest percentage figures for this threat category were recorded in electric power and construction. Over the quarter, the largest increases in percentages figures were observed in the electric power and manufacturing industries.

In North America (Canada), denylisted internet resources (2.14%) showed the greatest increase among all categories β€” by a factor of 1.22.

Among the selected industries across all regions, the highest percentage figures for the denylisted internet resources category were in the electric power (7.11%) and construction (6.25%) industries in Southeast Asia.

Malicious documents (Microsoft Office + PDF)

The percentage figure for this category decreased over two consecutive quarters, reaching its lowest value (1.56%) for the entire period of observations in Q1 2026. It increased just in two regions: Australia and New Zealand (1.12%, +0.04 pp), and Russia (0.62%, +0.01 pp).

Among the selected industries across all regions, the highest percentages for malicious documents were recorded for biometric systems (9.02%) and building automation (6.97%) in Southern Europe. These same industries also lead in similar rankings for malicious scripts and spyware.

Ransomware

The percentage of ICS computers on which ransomware was blocked has decreased for two consecutive quarters, dropping to 0.14%. This is the lowest value among all categories.

The percentage increased in two regions: North America (Canada) (0.11%, +0.04 pp) and slightly in Northern Europe (0.06%, +0.01 pp).

Among the selected industries across all regions, the highest percentages for ransomware were recorded in the oil and gas and manufacturing industries (0.92% and 0.65%, respectively) in Central Asia and the South Caucasus, and in biometric systems (0.89%) in Russia.

Miners in the form of executable files for Windows

The percentage of ICS computers on which miners in the form of executable files for Windows were blocked decreased to 0.59%.

The percentage increased in seven regions. The largest increase was observed in Africa (0.63%, +0.16 pp). Among the selected industries, the largest increases in the region were in the manufacturing and oil and gas industries.

Among the selected industries across all regions, the highest percentages for miners in the form of executable files were recorded in construction (1.99%), biometric systems (1.98%), and the oil and gas industry (1.97%) in Central Asia and the South Caucasus.

Web miners

The percentage of ICS computers on which web miners were blocked has been declining for a year, and in Q1 2026, it reached the lowest value for the entire period under review (0.22%).

At the same time, the percentage increased in seven regions. The largest increases were observed in South Asia (0.28%, +0.11 pp), the Middle East (0.31%, +0.09 pp), and Africa (0.34%, +0.08 pp). Despite the increases, the percentages in these regions for Q1 2026 did not exceed those observed in 2023–2024 and in Q1 2025.

Among the selected industries across all regions, the highest percentages for web miners were recorded for biometric systems (0.97%) in Russia. Biometric systems in South Asia (0.79%) ranked second, and the electric power sector in Southeast Asia (0.76%) ranked third.

Worms

The percentage of ICS computers on which worms were blocked decreased to 1.33%.

The percentage decreased across all regions following an increase in the previous quarter (due to a wave of phishing attacks that distributed the Backdoor.MSIL.XWorm backdoor worm across all regions of the world).

Among the selected industries across all regions, the highest percentage figure for worms was recorded for biometric systems (4.80%) in Central Asia and the South Caucasus. Two industries in Africa – biometric systems (4.04%) and electric power (3.53%) – took the second and third spots, respectively.

Viruses

The percentage of ICS computers on which viruses were blocked decreased to 1.31%.

The top 3 regions by this figure remained the same: Southeast Asia (6.11%, first by a wide margin), Africa (4.15%), and East Asia (2.97%). These same regions are also among the leaders by the percentage of systems affected by AutoCAD malware. The largest increase in this figure was observed in Africa (+0.41 pp).

Among the selected industries across all regions, the highest percentages for viruses were recorded in the construction industry (6.35%) and building automation (5.50%) in Southeast Asia.

Malware for AutoCAD

The percentage of ICS computers on which malware for AutoCAD was blocked increased to 0.30%.

The most notable increase over the quarter was observed in Africa, with the region’s percentage figure rising by 0.47 pp, a very significant increase for this category, and almost doubling (to 0.91%).

Among the selected industries across all regions, the highest percentages for AutoCAD malware were recorded in the construction industry in East Asia (5.58%) and Southeast Asia (3.87%).

Main threat sources

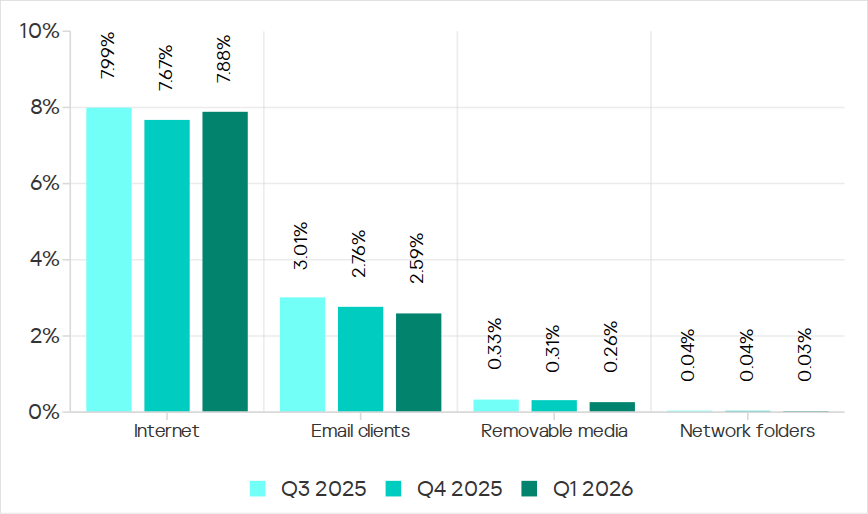
In Q1 2026, the average percentages across all threat sources, except threats from the internet, decreased globally.

Percentage of ICS computers on which malicious objects from various sources were blocked

Percentage of ICS computers on which malicious objects from various sources were blocked

Internet

The percentage of ICS computers on which threats from the internet were blocked increased to 7.88%. However, over the past three years, the percentage figure for internet threats has followed a downward trend.

The largest increases in the percentages were recorded in Southern Europe (8.59%, +0.59 pp), Southeast Asia (10.16%, +0.55 pp), and Northern Europe (4.47%, +0.51 pp).

Among the selected industries across all regions, the highest percentages for threats from the internet were recorded in electric power (13.16%) and construction (12.55%) in Southeast Asia, and in the engineering and ICS integration sector (12.33%) in South Asia.

Email clients

The percentage of ICS computers on which threats delivered via email clients were blocked decreased to 2.59%. This is a three-year low.

The percentage of this threat source increased in three regions: Southern Europe (6.54%, +0.2 pp), East Asia (1.5%, +0.09 pp), and slightly in Russia (0.7%, +0.04 pp).

Among the selected industries across all regions, the highest percentages for email threats were recorded for biometric systems (19.78%) and building automation (12.34%) in Southern Europe. In these two industries, the percentage of ICS computers on which email threats are blocked is higher than the percentage for threats from the internet. A similar situation was observed in two other instances, both in biometric systems (in South America and Southeast Asia).

Removable media

The percentage of ICS computers on which threats were detected when connecting removable media continued to decrease, reaching its lowest value for the period under review (0.26%).

Among the selected industries across all regions, the highest percentages for removable media threats blocked on ICS computers were observed in the electric power sector in Central Asia and the South Caucasus (1.45%), East Asia (1.34%), and Africa (1.16%).

Network folders

The percentage of ICS computers on which threats are blocked in network folders is steadily decreasing. In Q1 2026, it was the lowest for the period under review (0.029%).

East Asia has traditionally led by a wide margin. The percentage for East Asia (0.135%) is 27 times higher than the lowest regional value (recorded in Northern Europe).

The largest increases in the percentages for threats from network folders were observed in Africa (0.037%, +0.006 pp) and South America (0.013%, +0.006 pp).
Among the selected industries across all regions, the construction industry in East Asia, at 0.36%, holds the top positions in the ranking by the percentage of ICS computers on which threats are blocked in network folders.

For more information on industrial threats see the full version of the report.

Beware of the license manager: how a Schneider Electric software vulnerability puts industrial facilities at risk

26 June 2026 at 09:00

About the vulnerability

The CVE-2024-2658 vulnerability was discovered in 2024 within the FlexNet Publisher component of the Schneider Electric Floating License Manager. This software handles license management across various Schneider Electric products used for comprehensive industrial automation ranging from PLC programming to centralized control room implementation. Below, we break down how a single flaw can jeopardize an entire industrial facility, how to detect it on your workstations, and how to minimize the risks.

This vulnerability is a CWE-427: Uncontrolled Search Path Element issue. It stems from a system application referencing an OpenSSL configuration file at a hardcoded path without proper access controls.

This behavior allows a local non-administrator to craft a custom OpenSSL configuration file and force the lmadmin.exe system process – the core service that handles licensing – to load a third-party DLL. Consequently, the attacker’s code executes within the context of the service rather than a standard user account. Under specific conditions, this paves the way for further privilege escalation to the NT AUTHORITY\SYSTEM level.

Once NT AUTHORITY\SYSTEM access is achieved, the adversary can gain full control over local configuration files, sensitive system data, and secrets stored on the host. The potential for lateral movement to other nodes in the industrial network – such as engineering workstations – hinges on network connectivity, availability of stored credentials, and overall network architecture. Furthermore, the attacker can disrupt the operation of the license server itself, directly impacting the availability of engineering software and maintenance.

We will examine the role the FlexNet Publisher component plays within the Schneider Electric Floating License Manager (Schneider Electric FLM), why the hardcoded openssl.cnf path inside the application creates a critical hazard, what the exploit chain looks like, and the necessary mitigation steps to secure your environment.

The role of FlexNet Publisher in Schneider Electric FLM

FlexNet Publisher is a third-party commercial product by Flexera Software. The engineers behind Schneider Electric FLM, along with developers of numerous other industry solutions, integrate FlexNet Publisher as a library to manage product licensing. The underlying issue within FlexNet Publisher is that up to and including version 11.19.6.0, the library failed to restrict low-privileged users from modifying or replacing the openssl.cnf file. This is a textbook example of an Uncontrolled Search Path Element vulnerability (CWE-427).

Schneider Electric FLM relies on a combination of tightly integrated components:

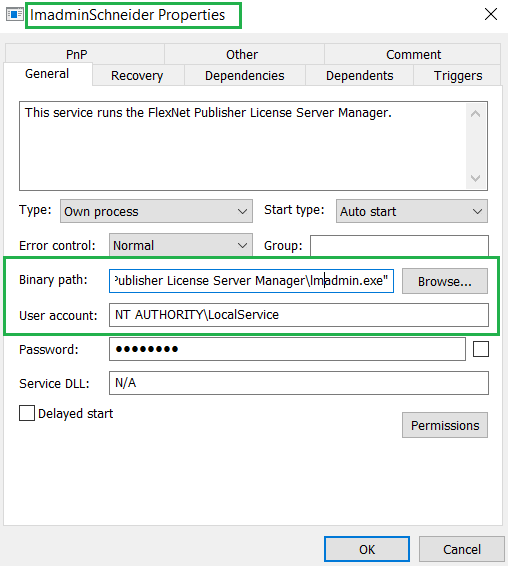
  1. lmadmin.exe: a lightweight 32-bit daemon that services license requests coming from PLCs, HMIs, and SCADA modules. During installation, this component is automatically registered as a Windows service named lmadminSchneider. The service is configured to launch automatically and executes under the NT AUTHORITY\LOCAL SERVICE account.
    Properties of lmadminSchneider: the executable file and security context of the service

    Properties of lmadminSchneider: the executable file and security context of the service

    Properties of lmadminSchneider: the executable file and security context of the service

  2. The openssl.cnf configuration file located in the OpenSSL-contrib subdirectory. This configuration file can specify a path to engine-module, a custom DLL file that FlexNet can automatically load into the lmadmin.exe process space. The application references this configuration file via a hardcoded path built into the binary:
    C:\cygwin\home\nightly\LMADMI~1.4\tier1\lmadmin\contrib\openssl\_RELEA~1\openssl\openssl.cnf

    LMADMI~1.4 is the directory name in MS-DOS 8.3 filename format. Any user authorized to create directories in the root of C:\ can recreate this structure – by default, all authenticated users are allowed to do that. A clean, default installation of Schneider Electric FLM does not actually create that folder.

  3. The FlexNet Publisher component (historically known as FLEXlm): the license management library that reads openssl.cnf, specifically parsing the [engine] section. If a dynamic_path parameter is defined within that section, FlexNet Publisher will load the specified DLL module at the specified path without performing any checks.
  4. The Schneider Electric FLM web portal is a lightweight HTTP server embedded directly within the lmadmin.exe process. It provides access to two main areas: Dashboard (accessible without authentication) and Administration (password-protected). Because the web portal and lmadmin.exe share the same address space, any code loaded via FlexNet Publisher executes directly inside the lmadmin.exe process. This allows an attacker to easily intercept credentials for the Administration portal and leverage them to expand their attack surface across other systems.
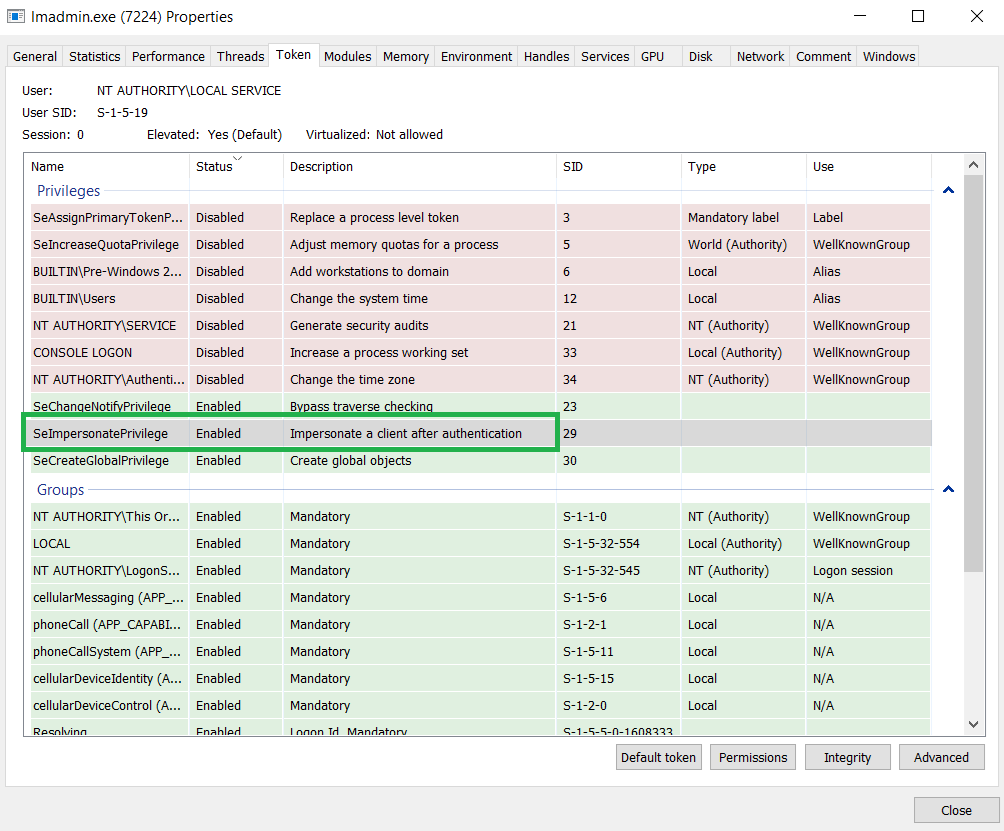
SeImpersonatePrivilege assigned to the lmadmin.exe process

SeImpersonatePrivilege assigned to the lmadmin.exe process

The exploit path

To exploit this vulnerability, the attacker must first have the ability to execute arbitrary code locally on the machine hosting the vulnerable service. The primary weakness exploited here stems from standard Windows NTFS permissions: by default, the root directory of the system drive often allows the Authenticated Users group to create new folders. If these permissions (ACLs) have not been tightened, a non-privileged attacker can manually reconstruct the exact directory structure that lmadmin.exe checks for its OpenSSL configuration:

C:\cygwin\home\nightly\LMADMI~1.4\tier1\lmadmin\contrib\openssl\_RELEA~1\openssl\

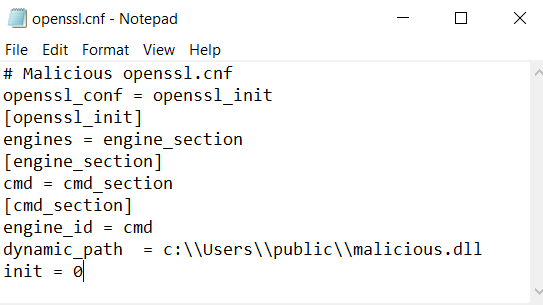
Next, within this newly created openssl.cnf file, the attacker adds a parameter pointing to a malicious engine module hosted in a writeable directory, for example: dynamic_path = C:\\Users\\public\\malicious.dll. When FlexNet Publisher initializes OpenSSL, it parses this section. Upon finding the dynamic_path parameter, it uses it to load the attacker’s DLL. Because vulnerable versions of FlexNet are allowed to read an OpenSSL configuration from an initially non-existent, untrusted path, the lmadmin.exe process accepts the rogue configuration file as legitimate.

Example of a malicious openssl.cnf configuration file

Example of a malicious openssl.cnf configuration file

For lmadmin.exe to parse the openssl.cnf file and execute the malicious DLL, the lmadminSchneider service must be restarted. This can happen under any of the following conditions:

  • After a regular reboot of the host machine.
  • If the user possesses permissions to restart the service – by default, the Authenticated Users group is not allowed to do that.

Upon lmadmin.exe service startup, FlexNet Publisher initializes OpenSSL, opens the openssl.cnf configuration file, and parses the [engine] section. If a dynamic_path is specified, OpenSSL loads the corresponding DLL module directly into the lmadmin.exe process space. Once loaded, the code within the DLL executes in the context of lmadmin.exe. Because the service runs under NT AUTHORITY\LOCAL SERVICE, the malicious code inherits its privileges.

While the NT AUTHORITY\LOCAL SERVICE account is highly restricted by design, a significant risk for further privilege escalation remains. This exposure exists because, in a standard configuration, the service process is granted SeImpersonatePrivilege. This privilege allows the process to impersonate a client’s security context after authentication. Given an appropriate interaction scenario via RPC, COM, or named pipes, an attacker can exploit this to achieve local privilege escalation to NT AUTHORITY\SYSTEM. This is commonly done with tools from the Potato exploit family or similar impersonation abuse techniques. Consequently, while each individual step may appear unremarkable, their combination forms a complete exploit chain: moving from a low-privileged local user to executing code within a service context, and under the right conditions, to achieving a full escalation to NT AUTHORITY\SYSTEM privileges.

Mitigating CVE-2024-2658

  • If your organization does not rely on floating licenses, we recommend completely removing Schneider Electric FLM or avoiding its installation on workstations where it isn’t strictly required. Whenever feasible, use licenses tied to specific machines instead.
  • If still required, Schneider Electric FLM should be hosted on a dedicated server with strictly controlled user access.
  • Use an administrative account when creating the C:\cygwin directory and explicitly deny write permissions to the Authenticated Users group for this folder. This prevents staging a rogue OpenSSL configuration file along the hardcoded path.
  • Finally, update Schneider Electric FLM to version 3.0.0.0 or later.

Detection with Kaspersky solutions

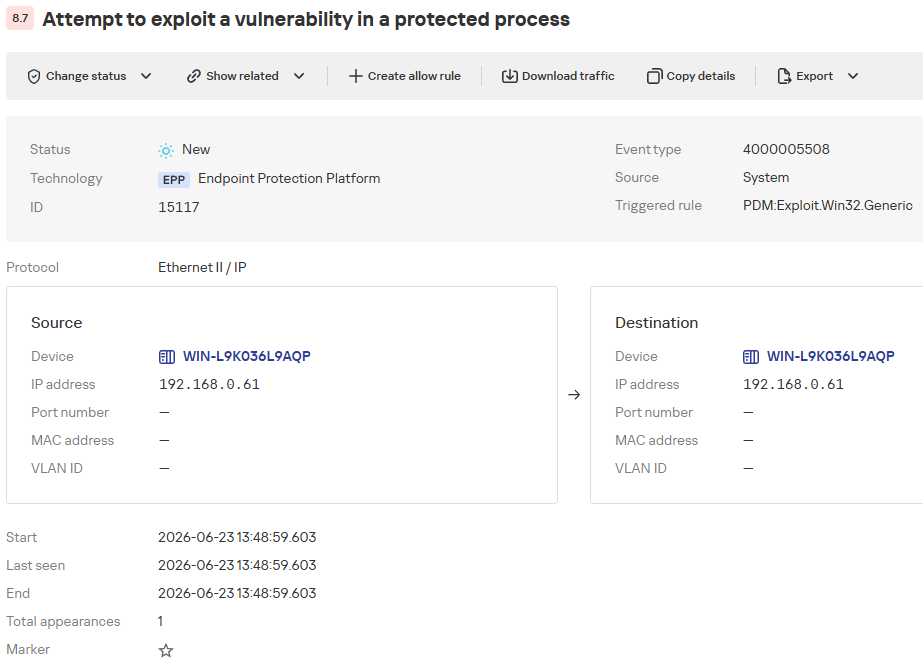
Kaspersky Industrial CyberSecurity successfully detects exploitation attempts targeting this vulnerability. The KICS Vulnerability Manager module flags the presence of the vulnerable software version on endpoints, while the behavioral analysis engine tracks each stage of the attack chain – from the creation of the rogue configuration file on disk to the vulnerable service’s attempt to load the malicious library.

Detecting an exploitation attempt: an overview

Detecting an exploitation attempt: an overview

The KICS alert card consolidates details on the exploitation attempt alongside recommended defensive actions.

Description
The Exploit Prevention component of the EPP application detected attempts to exploit a vulnerability in a protected process. This type of attack may lead to malicious code execution, unauthorized access, or system integrity compromise.

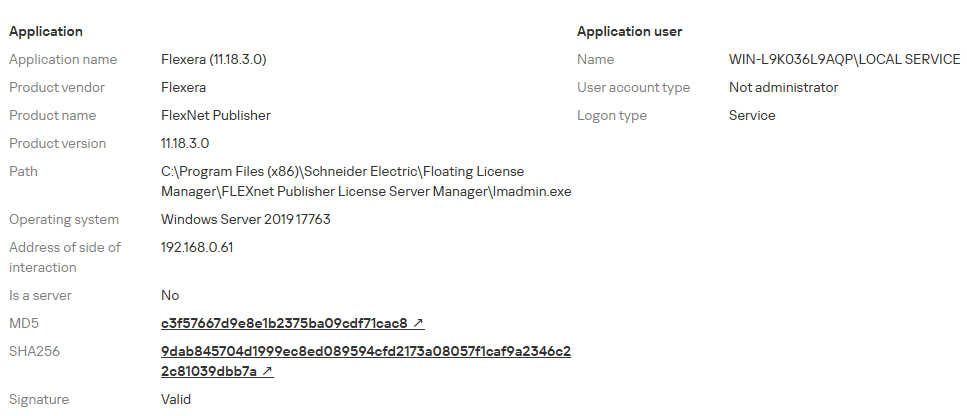
EPP application data
●	Object name: C:\Program Files (x86)\Schneider Electric\Floating License Manager\FLEXnet Publisher License Server Manager\lmadmin.exe.
●	Status: Untreatable.
●	MD5 hash: c3f57667d9e8e1b2375ba09cdf71cac8.
●	SHA256 hash: 9dab845704d1999ec8ed089594cfd2173a08057f1caf9a2346c22c81039dbb7a.

Mitigations
●	Analyze the event and identify the source of the startup or interaction with the process.
●	Make sure that this vulnerability is relevant to your system (check the software version and installed updates).
●	If a vulnerability exploit is confirmed, isolate the device and search for signs of compromise (suspicious files and their checksums, unknown processes/services, or queries to external IPs/FQDNs). Also, check for similar traces on other devices.
●	Install security updates for the attacked software or operating system and run a full scan of the device if necessary.

Detecting an exploitation attempt: target process details

Detecting an exploitation attempt: target process details

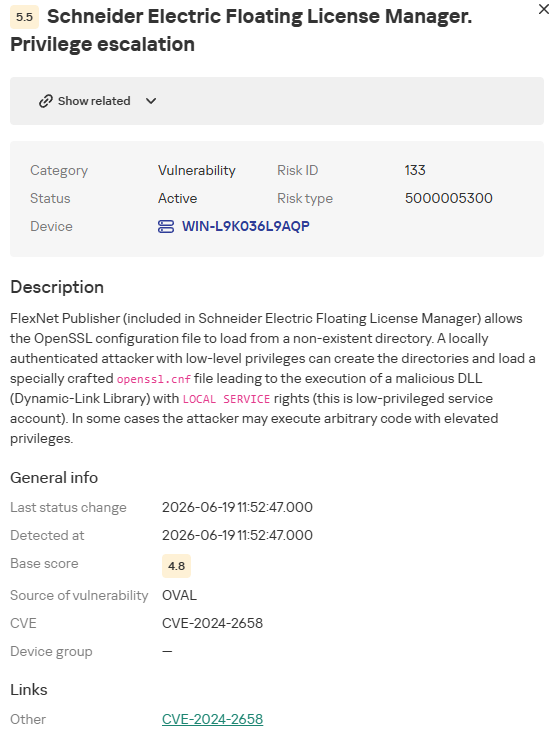
Additionally, to proactively identify the presence of the vulnerability on a host as part of a continuous vulnerability management process, organizations can utilize the OVAL scanning task within KICS products. The following screenshot illustrates how KICS for Nodes highlights the presence of the vulnerable software version.

CVE-2024-2658 vulnerability details

CVE-2024-2658 vulnerability details

Conclusion

The CVE-2024-2658 vulnerability is a prime example of the consequences that dependency-loading mechanisms lacking proper validation can have. In the case of the Schneider Electric Floating License Manager, a local non-administrator can position a rogue openssl.cnf configuration file at the hardcoded path to inject a malicious DLL directly into the lmadmin.exe service context. Given a certain system configuration, this chain can be leveraged to escalate privileges to the NT AUTHORITY\SYSTEM level.

To remediate this vulnerability, organizations must immediately upgrade the affected component (FlexNet Publisher) to a patched version and restrict write permissions for non-privileged users to the C:\cygwin directory. Implementing these controls will significantly reduce exploitation risk, while Kaspersky Industrial CyberSecurity solutions can provide an added layer of defense by detecting anomalous behavior at the earliest stages of the attack.

❌
❌