Normal view

There are new articles available, click to refresh the page.
Before yesterdayMain stream

A Bright Spot at Mount Michael

7 September 2026 at 00:01
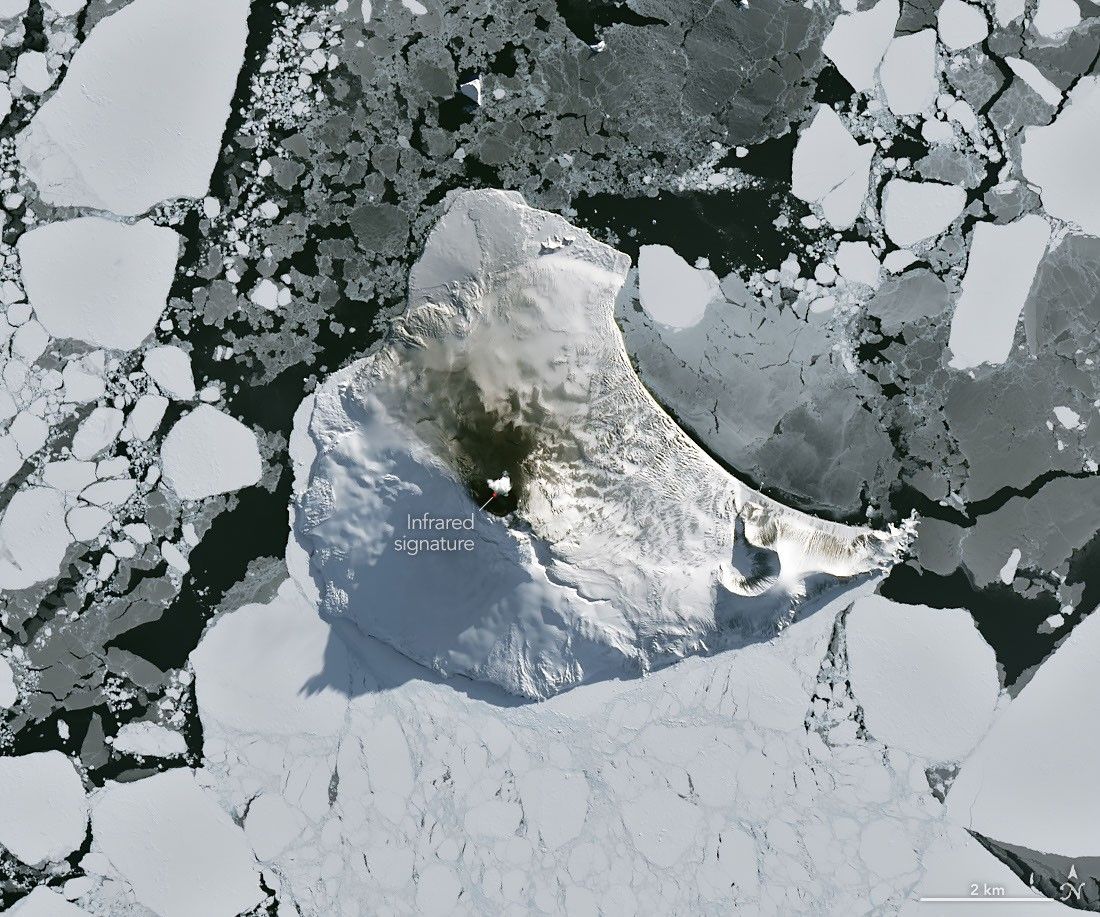
A small ice- and snow-covered island with an active volcanic crater at its center is surrounded by drifting pieces of sea ice. A thermal signal and small plume appear in the crater, and ash darkens the snow on the volcano’s northern slopes.
Mount Michael on Saunders Island, seen in this image acquired with the OLI (Operational Land Imager) on Landsat 8 on August 24, 2026, hosts a frequently active lava lake in its summit crater.
NASA Earth Observatory/Michala Garrison

Winter near the Antarctic Circle brings months of frozen darkness, when sea ice chokes ocean waters and many of its denizens hunker down to ride out the harsh conditions. But as winter began to release its icy grip, an uncommonly clear satellite image revealed that part of this remote realm was still very much awake, at least volcanically speaking.

Mount Michael, the stratovolcano at the center of Saunders Island, rises above the ice-filled South Atlantic Ocean in this image, acquired with the OLI (Operational Land Imager) on the NASA-USGS Landsat 8 satellite on August 24, 2026. The natural-color image is overlaid with an infrared signal (OLI bands 7-6-5), shown in red, revealing heat from the persistent lava lake in its summit crater. A puff of a volcanic plume hovering over the peak, along with darkened snow on its northern slopes, also suggests ongoing activity.

Saunders Island is one of the South Sandwich Islands, a string of small volcanic peaks about 350 kilometers (220 miles) long that formed from the South American plate subducting beneath the tiny South Sandwich plate. Regular eruptions, including at Mount Michael, have occurred on these islands in recent centuries.

Because of the volcanoes’ remoteness, scientists rely on satellite data to understand their activity. An analysis of thermal anomalies in Landsat, Sentinel, and ASTER (Advanced Spaceborne Thermal Emission and Reflection Radiometer) observations spanning 30 years led researchers to conclude that Mount Michael hosts a persistent lava lake in its summit crater. Only a handful of other volcanoes on Earth, including Kīlauea, Nyamulagira, and Erta Ale, are known to have similar, frequently active features.

Thermal observations from the MODIS (Moderate Resolution Imaging Spectroradiometer) and VIIRS (Visible Infrared Imaging Radiometer Suite) instruments have also enabled long-term monitoring of Mount Michael. Data provided through MIROVA, a near-real-time volcanic hot spot detection system, indicate that low-intensity activity has been ongoing at the volcano for the past several years. Other observations from NASA’s Aura satellite show that emissions of sulfur dioxide and other gases are common at Mount Michael.
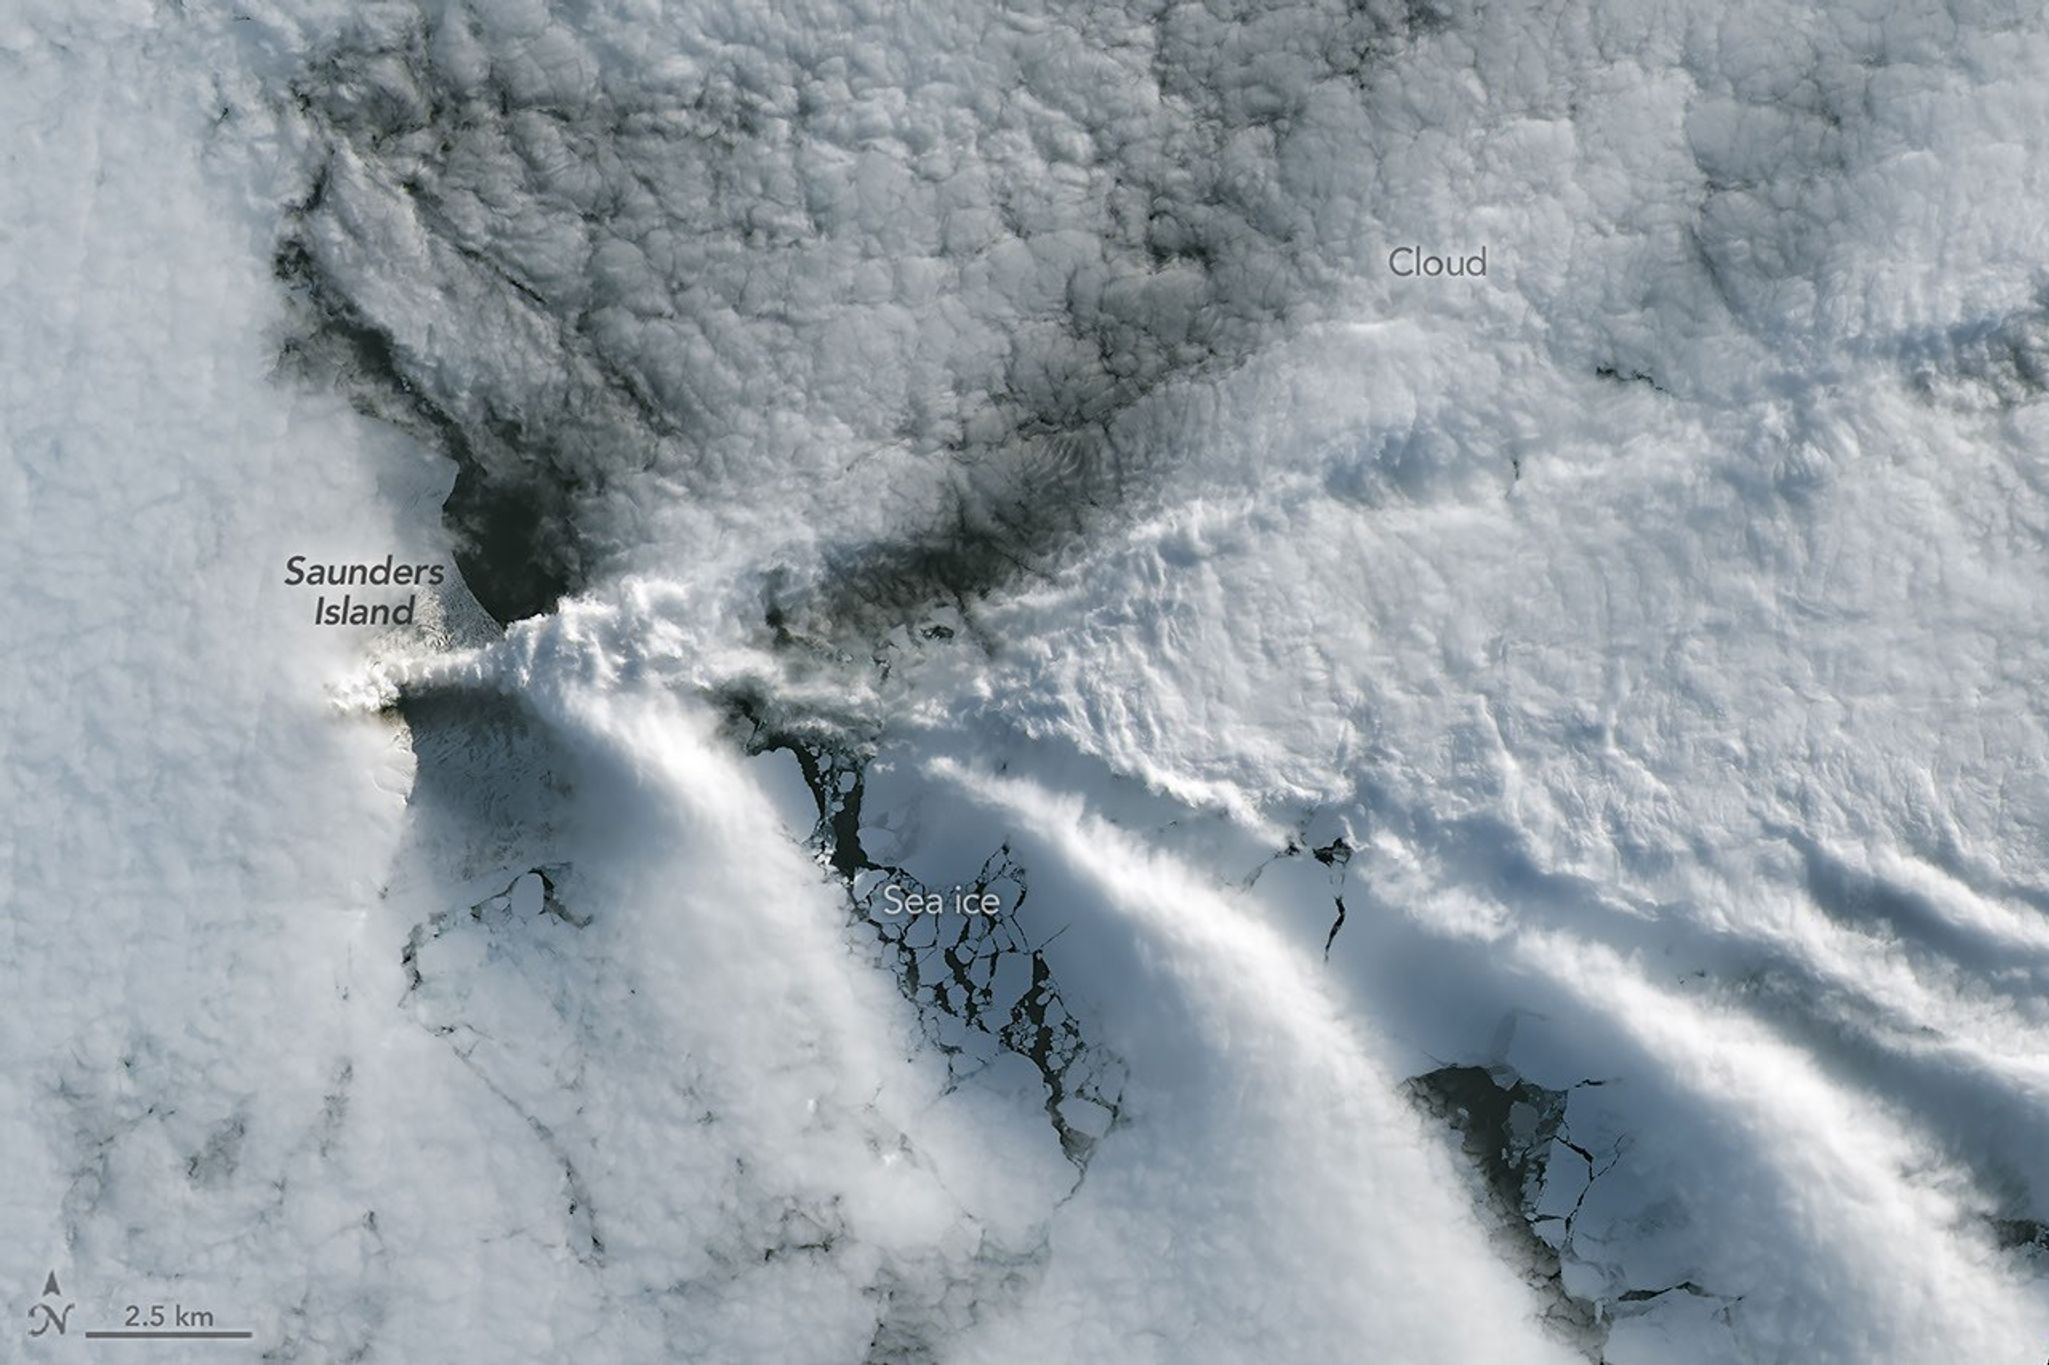
A series of V-shaped wave clouds appears over an ocean filled with pieces of sea ice.
Wave clouds form downwind of Saunders Island in this image acquired with the OLI (Operational Land Imager) on Landsat 9 on September 1, 2026.
NASA Earth Observatory/Michala Garrison

The cloud-free window over Mount Michael would close in short order. One week later, when Landsat 9 passed over the island, a more active atmosphere had returned. But the weather patterns interacted with the island to put on a spectacle of their own. The 843-meter-high (2,766-foot-high) peak jutting from the ocean disturbed passing winds to produce a series of wave clouds resembling the wake of a ship, a familiar phenomenon in this region. False-color imagery captured by NASA’s Aqua satellite indicates that a volcanic track caused by degassing sulfur dioxide was likely present as well.

NASA Earth Observatory images by Michala Garrison, using Landsat data from the U.S. Geological Survey. Story by Lindsey Doermann.

Downloads

A small ice- and snow-covered island with an active volcanic crater at its center is surrounded by drifting pieces of sea ice. A thermal signal and small plume appear in the crater, and ash darkens the snow on the volcano’s northern slopes.

August 24, 2026

JPEG (4.27 MB)

A series of V-shaped wave clouds appears over an ocean filled with pieces of sea ice.

September 1, 2026

JPEG (1.14 MB)

References & Resources

You may also be interested in:

Stay up-to-date with the latest content from NASA as we explore the universe and discover more about our home planet.

Ever Restless Mount Dukono Erupts

2 min read

The volcano on Indonesia’s Halmahera Island routinely ejects ash, volcanic gases, and volcanic bombs.

Article

A Sea of Spinning Clouds

3 min read

Icy, isolated Peter I Island stirred up a show in the atmosphere off the West Antarctic coast.

Article

America’s Emerald Isle

3 min read

Beaver Island is one in a string of verdant and scenic jewels in a northern Lake Michigan archipelago.

Article

A Trio of Tropical Cyclones in the Pacific

4 September 2026 at 00:01
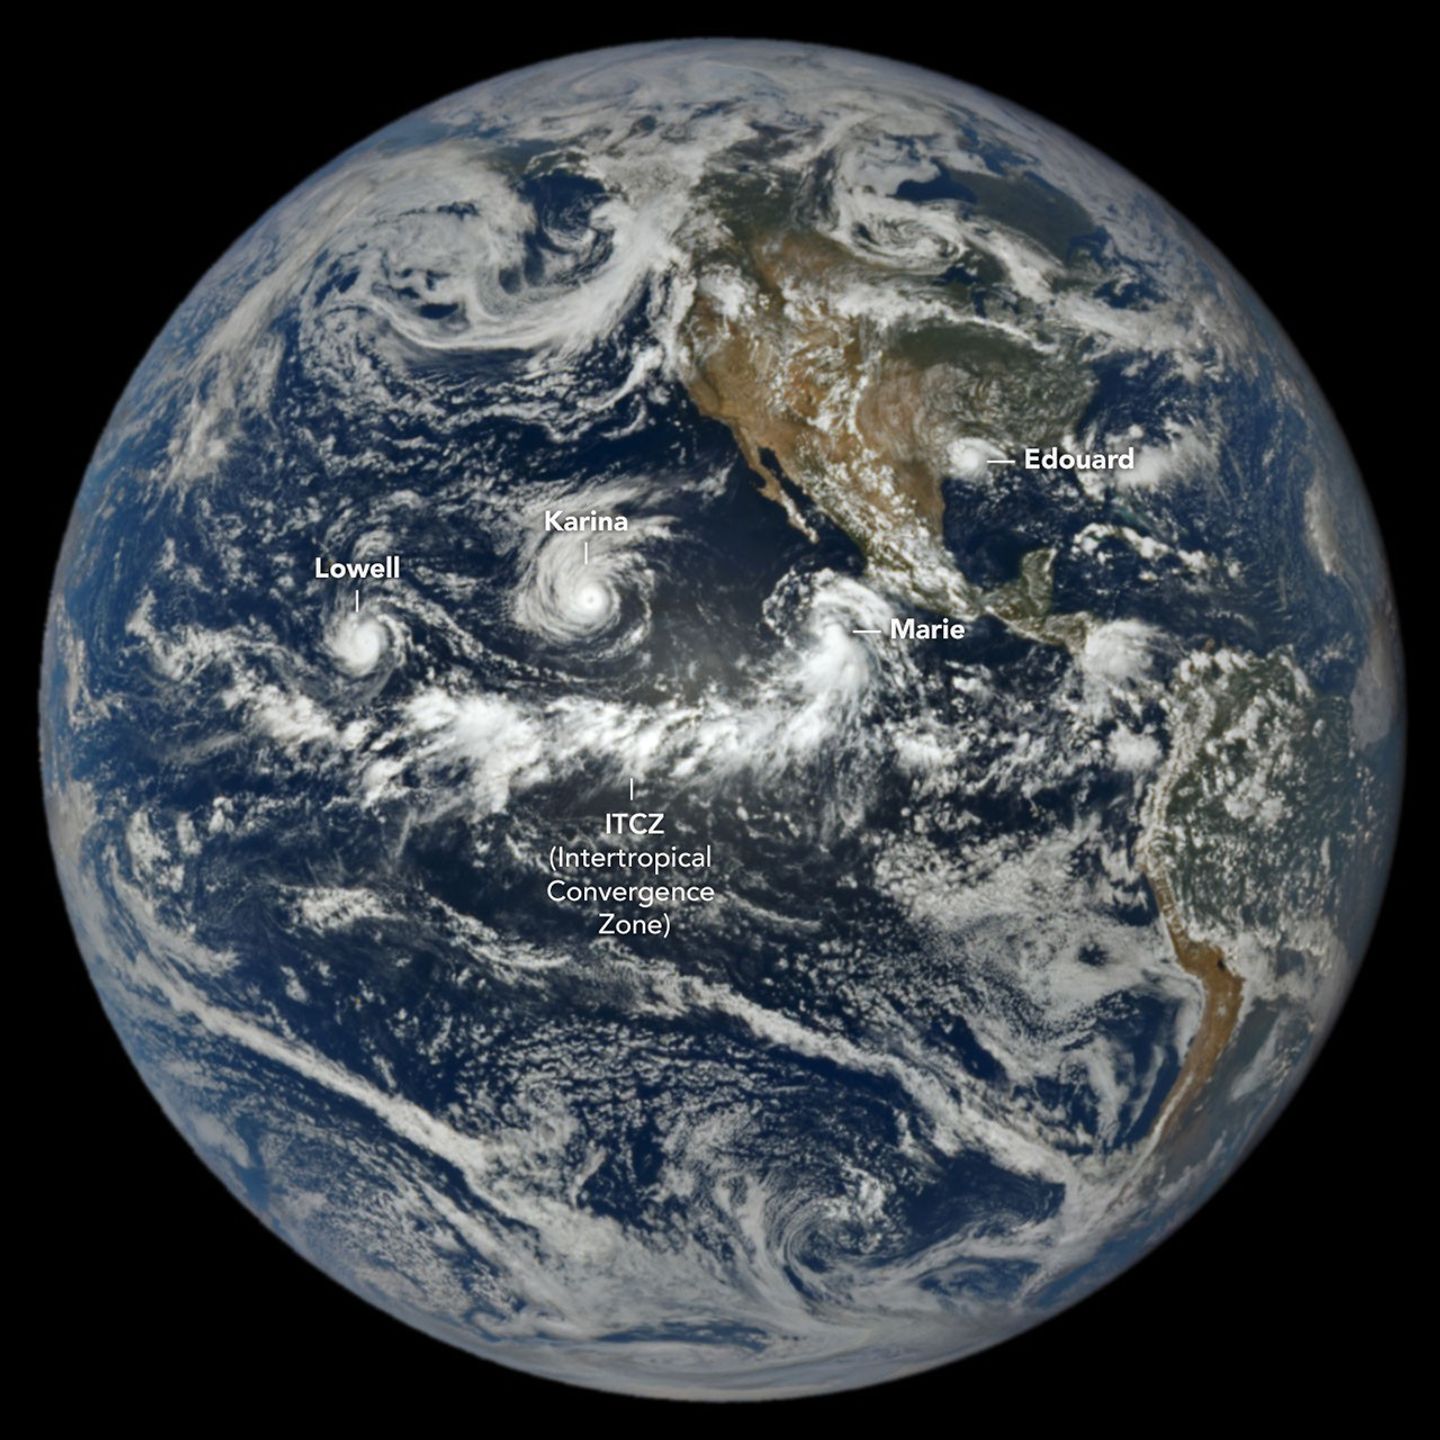
In a full-disk satellite view of Earth, three tropical cyclones—named Lowell, Karina, and Marie—swirl above the blue waters of the Pacific Ocean and to the west of Central America.

When hurricane forecasters released their seasonal outlooks in spring 2026, the El Niño brewing in the Pacific contributed to predictions of below-normal activity in the Atlantic basin but above-normal activity in the northeastern and central Pacific basins. In early September, near the climatological peak of hurricane season, those spring outlooks were on target, with the eastern Pacific buzzing with activity and the Atlantic notably quiet.

As of September 3, the Northeast Pacific had produced 15 named storms and six hurricanes, well above the norm for that point in the season. The Atlantic basin, meanwhile, laboring under unfavorable wind shear conditions, had produced just five named storms and no hurricanes. El Niño typically enhances hurricane activity in the eastern and central Pacific basins because of the unusually warm water temperatures it brings to those parts of the ocean. It tends to suppress hurricane activity in the Atlantic basin by shifting large-scale circulation patterns in a way that makes it harder to sustain storms there.

At 1:14 p.m. Pacific Daylight Time (20:14 Universal Time) on September 1, NASA’s EPIC (Earth Polychromatic Imaging Camera) on the DSCOVR (Deep Space Climate Observatory) satellite captured an image of three tropical cyclones churning simultaneously in the Pacific, along with one in the Atlantic. A band of clouds and thunderstorms associated with the Intertropical Convergence Zone (ITCZ) is visible to the south of the storms. The spacecraft was nearly 1 million miles from Earth and just shy of 93 million miles from the Sun when the image was acquired.

The trio of storms in the Pacific were Lowell, Karina, and Marie. Of the three, Lowell became the strongest, with winds reaching category 5 strength for several hours on September 2. Around the same time, Karina, spinning a few thousand kilometers to the east, achieved category 4 strength, a rare case of category 4 and 5 hurricanes occurring simultaneously in the area. Marie, spinning southwest of Baja California, was still a tropical storm when the image was acquired but was strengthening as it moved northwest.

In the Atlantic, Tropical Storm Edouard was visible to EPIC over Louisiana and Texas, shortly after the short-lived storm made landfall. It brought torrential rains and strong winds that downed trees and power lines. Some areas received 15 to 24 inches (38 to 61 centimeters) of rain, according to National Weather Service meteorologists.

As of September 3, the Atlantic basin’s total accumulated cyclone energy (ACE) index was 4.4, about 9 percent of normal for that date, according to statistics compiled by Colorado State University meteorologists. Meanwhile, the Northeast Pacific basin’s ACE was 130, about 50 percent above normal. The ACE index incorporates both the intensity and longevity of storms, making it easier to compare individual storms and seasons.

Several NASA Earth-observing platforms provide data that can aid in emergency preparedness before landfall and damage assessment and response afterward. Use the “Events” tab on NASA’s Worldview browser to track current hurricanes and explore related NASA data products.

NASA Earth Observatory image by Lauren Dauphin, using data from DSCOVR EPIC. Story by Adam Voiland.

Downloads

In a full-disk satellite view of Earth, three tropical cyclones—named Lowell, Karina, and Marie—swirl above the blue waters of the Pacific Ocean and to the west of Central America.

September 1, 2026

JPEG (1.49 MB)

References & Resources

You may also be interested in:

Stay up-to-date with the latest content from NASA as we explore the universe and discover more about our home planet.

Lala Batters Hawaii

3 min read

The powerful storm delivered extreme rainfall and damaging winds to the state, passing the Island of Hawaiʻi as a category…

Article

Tropical Storm Arthur

2 min read

The first named storm of the 2026 Atlantic hurricane season brought intense rainfall and the threat of flash flooding to…

Article

El Niño Is Underway

4 min read

Satellite observations of sea surface height indicated that the 2026 event continued to strengthen in early June.

Article

Chasing Fire Clouds in Utah

17 August 2026 at 00:01
Natural Color
Brightness Temperature
Textured gray wildfire smoke streams east from a fire burning near Fishlake National Forest. A dark shadow is visible to the east of a tall plume near the fire front.
NASA Earth Observatory/Michala Garrison
A data visualization shows the cloud-top brightness temperature of the same scene. Tall, cold smoky clouds appear white, and warmer plumes at lower heights appear purple.
NASA Earth Observatory/Michala Garrison
Textured gray wildfire smoke streams east from a fire burning near Fishlake National Forest. A dark shadow is visible to the east of a tall plume near the fire front.
NASA Earth Observatory/Michala Garrison
A data visualization shows the cloud-top brightness temperature of the same scene. Tall, cold smoky clouds appear white, and warmer plumes at lower heights appear purple.
NASA Earth Observatory/Michala Garrison
Natural Color
Brightness Temperature
A smoke-infused pyrocumulonimbus (pyroCb) rises from the Widemouth 2 fire in Utah in these images captured by the MODIS (Moderate Resolution Imaging Spectroradiometer) on NASA’s Aqua satellite. The left image is natural color; the right image is false color, revealing cloud-top brightness temperatures below -40°C, a commonly used threshold for identifying pyroCbs. NASA Earth Observatory images by Michala Garrison.

Scientists have long known that volcanoes can launch large quantities of particles into the stratosphere. In the past few decades, it has become clear that wildfires do this, too, by generating towering, smoke-infused pyrocumulonimbus (pyroCb) clouds.

The largest pyroCbs are stunning weather-making features that generate massive thunderheads capable of unleashing lightning, hail, and heavy rain. A growing body of research shows that pyroCbs can also leave an outsized imprint on the upper atmosphere by channeling pulses of particles and gases into the stratosphere’s mostly dry, cloudless confines. Once there, smoke can spread widely and linger for months or years, sometimes circling the globe and likely influencing the ozone layer and Earth’s energy budget.

Understanding these enigmatic and dangerous clouds is why a team of atmospheric scientists—part of a NASA mission called INSPYRE (INjected Smoke and PYRocumulonimbus Experiment)—is spending the summer chasing them with NASA’s ER-2 aircraft, NSF/NCAR’s GV, and a suite of truck-based sensors. The team completed one of its first sampling runs of the summer on August 3, 2026, when the GV flew through a high-altitude pulse of smoke from the Widemouth 2 fire, one of Utah’s largest so far this year.

Lightning ignited the fire on July 27, 2026, but it remained relatively small until August 2, when it more than doubled in size amid intense winds and hot, dry conditions. That afternoon, soon after it had produced two pyroCb bursts, the MODIS (Moderate Resolution Imaging Spectroradiometer) on NASA’s Aqua satellite captured this image (above), showing a chimney of high-altitude cloud and smoke casting a shadow on low-altitude smoke below.

These bursts propelled clouds high enough that Aqua measured cloud-top brightness temperatures well below −40°C, a common threshold for identifying pyroCbs and a sign that the cloud tops were bubbling to the top of the troposphere and sometimes into the stratosphere. The brightness temperature measurements “reveal two discrete pulses of pyroCb action,” said Michael Fromm, a scientist at the U.S. Naval Research Laboratory. “The westernmost is the youngest pulse and stands out in the visible imagery by virtue of its shadow.”

Though relatively routine and minor, this pyroCb event followed a pre-dawn pyroCb from the same fire, imaged by the NOAA weather satellite GOES-West. “Morning pyroCbs are much more unusual,” Fromm said, because they don’t benefit from daytime heating that helps fuel convection. In this case, however, there appeared to be enough atmospheric instability and water vapor in the air to allow for pyroCb development. 

Multiple pyroCbs in a single day could have added unwanted complexity for forecasters and fire officials battling the blaze and organizing evacuations, said David Peterson, INSPYRE’s principal investigator. “Minimizing that sort of uncertainty for fire forecasters is a big part of the reason we’re out here studying this,” he added.

Remote sensing experts like Peterson and Fromm routinely study pyroCbs from afar with satellites, but it’s less common for pilots to chase and sample smoke plumes just hours after they form. In this case, the GV aircraft, on the ground in Colorado when the Widemouth 2 fire blew up, made a beeline for a high-altitude smoke plume as it drifted over New Mexico on August 3. The instruments on the plane sampled smoke at roughly 12 kilometers (8 miles) above the surface, collecting data at a height that isn’t typically incorporated into forecast models.

An aerial image shows a thick, puffy white cloud rising high above a patch of darker smoke visible near a surface of variable mountainous terrain.
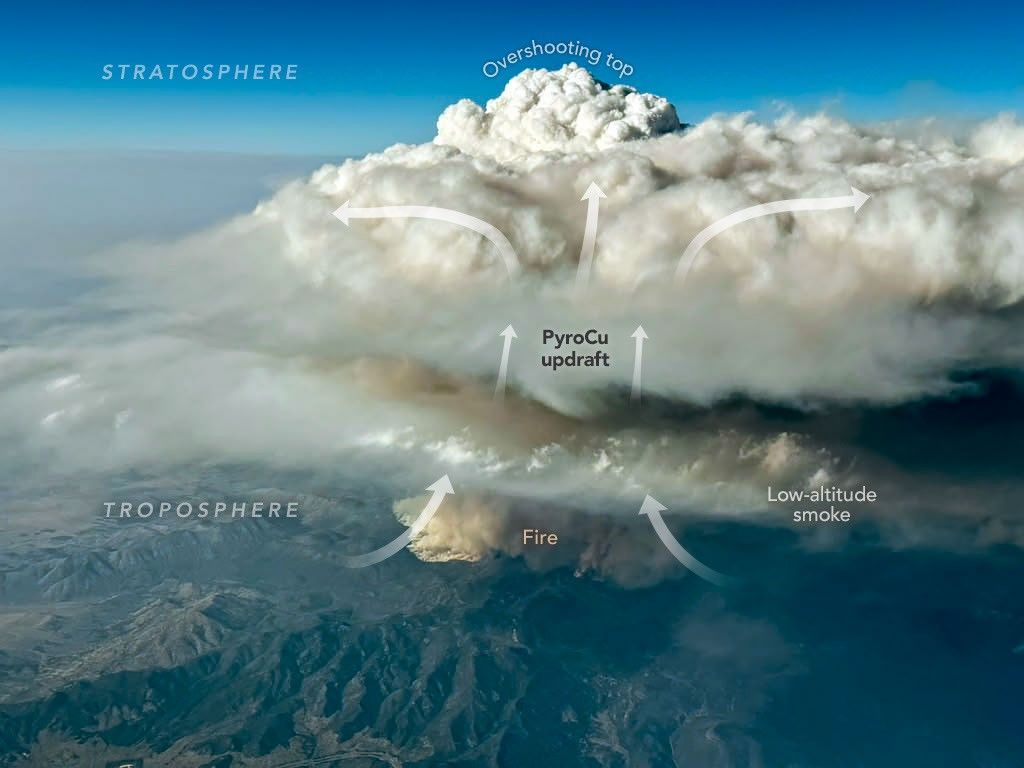
A photo of the Widemouth 2 fire taken from an INSPYRE aircraft during a sampling flight on August 3, 2026, shows a smoke-infused cloud rising high above the fire.
Bernadett Weinzierl/University of Vienna

During that mission, a scientist on board captured this image (above) of a pyrocumulus (pyroCu) billowing up over the Widemouth 2 fire. While not as tall or energetic as pyroCbs, pyroCus are precursor clouds that share many of the same characteristics. Here, heat from the fire is fueling strong convective updrafts, forming a towering cloud with puffy overshooting tops that poke into the upper troposphere as lower-altitude smoke drifts below.

Satellites excel at identifying pyroCbs by measuring the temperature of the cloud tops that form above smoke plumes. Using this technique, researchers have established that wildfires produce about 70 pyroCbs per year, many in dense forests of Canada and Russia, though plenty also occur in grasslands and savannas in the United States and Australia. So far in 2026, Fromm and colleagues have identified at least 13 in the continental United States.

Since one of the first pyroCbs appeared in the scientific literature in the early 2000s, scientists have cataloged well over 700 events, and they now believe that wildfires may contribute up to 25 percent of the black carbon and organic aerosols in the lower stratosphere. The sheer frequency of pyroCbs means that the total mass of particles they inject over the course of a wildfire season may rival that of large volcanic eruptions.

Still, many questions about the enigmatic clouds remain unanswered. It isn’t clear what vegetation is most likely to fuel pyroCbs, why some form more lightning than others, why they form in only a small fraction of fires, and how to accurately forecast them.

“Whether it be their dangerous manifestations on the ground or their long-lasting imprint on the upper troposphere and lower stratosphere,” Fromm said, “pyroCbs continue to surprise us.”

NASA Earth Observatory images by Michala Garrison, using MODIS data from NASA EOSDIS LANCE and GIBS/WorldviewPhoto by Bernadett Weinzierl/University of Vienna. Story by Adam Voiland.

Downloads

Textured gray wildfire smoke streams east from a fire burning near Fishlake National Forest. A dark shadow is visible to the east of a tall plume near the fire front.

August 2, 2026: Natural Color

JPEG (1.63 MB)

A data visualization shows the cloud-top brightness temperature of the same scene. Tall, cold smoky clouds appear white, and warmer plumes at lower heights appear purple.

August 2, 2026: Brightness Temperature

JPEG (1.07 MB)

An aerial image shows a thick, puffy white cloud rising high above a patch of darker smoke visible near a surface of variable mountainous terrain.

August 3, 2026

JPEG (319.28 KB)

References & Resources

You may also be interested in:

Stay up-to-date with the latest content from NASA as we explore the universe and discover more about our home planet.

Cottonwood Fire Chars Utah
5 min read

The blaze burned more than 150 square miles and swept through parts of a ski resort.

Article
Ontario Wildfire Smoke Moves East
3 min read

Canadian wildfires sent plumes of smoke streaming over Ontario, Quebec, and parts of the U.S. Midwest and Northeast.

Article
Cascade Volcanoes Shrouded in Smoke
3 min read

From the International Space Station, astronauts photographed Mount Hood and Mount Rainier as wildfire smoke spread across the Pacific Northwest…

Article
❌
❌