❌

Normal view

There are new articles available, click to refresh the page.
Before yesterdaySecurelist

A new extortion cocktail: office printers, small ransoms, and BitLocker

21 July 2026 at 09:00

Recently, our teams in Latin America investigated a series of incidents involving misconfiguration, the deployment of BitLocker, and the exploitation of corporate printers. Attackers used the devices to notify organizations that their infrastructure had been compromised and they had to pay a ransom to recover their data.

This article analyzes two incidents that occurred in June in Colombia and in May in Mexico. We highlight the similarities in the attackers’ communications and outline emerging trends in ransom amounts.

Initial sign of an attack

In both cases, the affected users initially noticed a padlock icon next to their drives in Windows Explorer. This indicated that the drive was encrypted with BitLocker, blocking access to its contents.

Drive icon indicating that the drive is locked

Drive icon indicating that the drive is locked

A recovery key was required to unlock the drive.
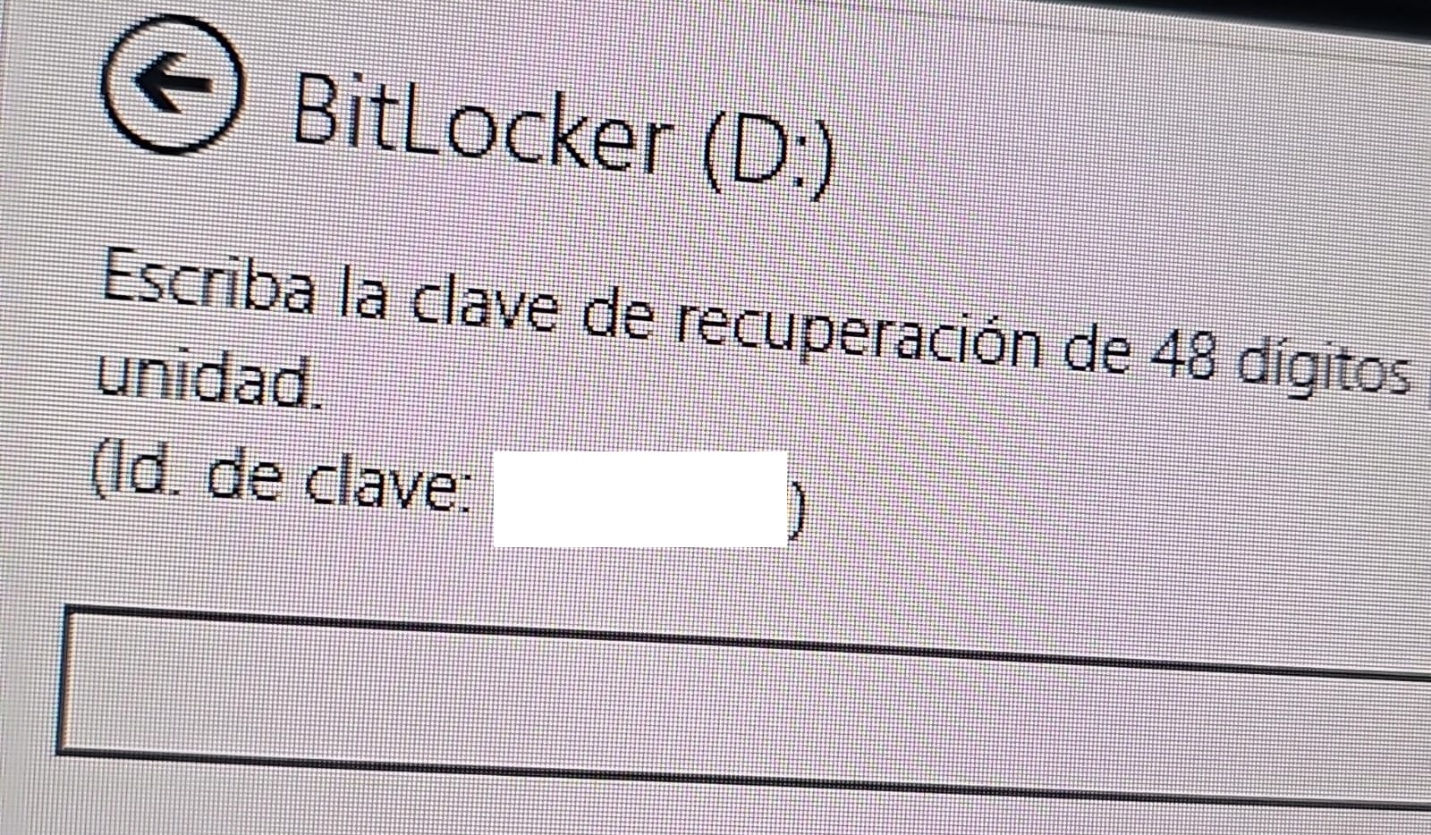
Attempt to access the disk's contents and the prompt for the BitLocker recovery key

Attempt to access the disk’s contents and the prompt for the BitLocker recovery key

This is not the first time we have seen such threats; a few years ago, our team discovered a threat known as ShrinkLocker, which utilized BitLocker to achieve its goals.

First case: abusing RDP to encrypt data

One of the incidents occurred in Colombia in June. The attackers exploited an internet-exposed RDP service on a machine connected to an 8 TB storage device containing mission-critical data. After taking control of the system and manipulating user credentials, the attackers enabled BitLocker exclusively on the drive that primarily stored financial data. Once the encryption was complete, they locked the drive and used the company’s printers to produce ransom notes.

Ransomware note

Ransomware note

Unfortunately, it was not possible to obtain evidence in the case due to the company’s rush to restore the encrypted disk. The communication with the attackers revealed a demand for just $3,000, and the company considered paying the ransom. After that, the system was restored before the forensic team could take any action, eliminating the evidence needed to assess the incident.

Attacker's reply to the victim's email sent to the address in the printed ransom note

Attacker’s reply to the victim’s email sent to the address in the printed ransom note

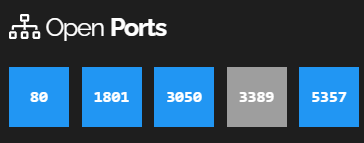
This attack was made possible by an internet-facing remote desktop service (RDP) with additional open ports, which employees used to access corporate information. By exploiting this network exposure and misconfiguration, attackers breached the system, identified an additional drive, and leveraged BitLocker to encrypt the data and demand a ransom payment. Leaving RDP ports open without proper security controls jeopardizes the security of systems and information, as highlighted in the our β€œGlobal Report: Anatomy of a Cyber Worldβ€œ.

Exposed ports identified in the system in recent months

Exposed ports identified in the system in recent months

The company confirmed that, due to compatibility issues with applications required for operation, EPP (Endpoint Protection Platform) protection was disabled on the system, making it easier for attackers to validate, enumerate, and execute applications without revealing malicious activity to central monitoring systems.

Second case: meet the XEntry Team

In another incident, which occurred in Mexico in May, our team identified how the threat actor gained initial access to the infrastructure. They exploited a misconfigured MSSQL service. This allowed them to execute commands on the system after obtaining the database login credentials from code insecurely published on GitHub.
XEntry team attack

XEntry team attack

In this incident, the attack began three months prior to detection, with the intruder discovering and verifying their access to the environment. After confirming their access and privilege level within the MSSQL server settings, which extended beyond the DBMS to the underlying operating system, the attackers initially focused on manipulating certain aspects of the web server configuration on the same system. They lowered the server’s security settings and created web shell files in the publicly accessible folders. Many of these attempts to manipulate the service or create malicious files were contained by existing EPP security controls, but despite the alerts, the necessary investigation to address the activity was not conducted.
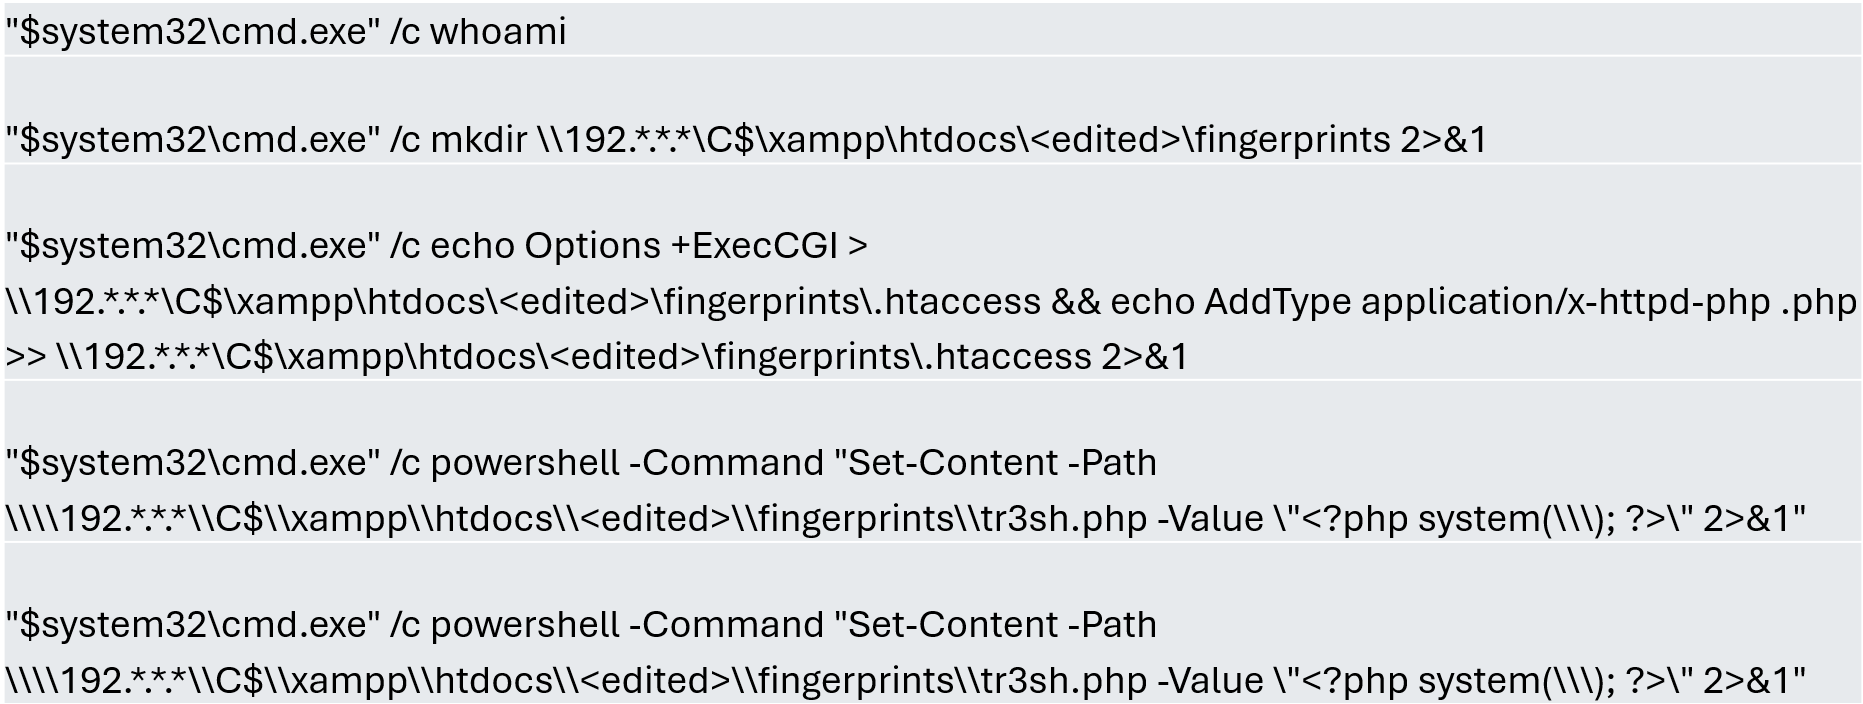
Commands executed when attempting to manipulate the web server

Commands executed when attempting to manipulate the web server

The attackers subsequently confirmed their ability to execute commands locally and set up their attack infrastructure to transmit data via a communications bridge. By exploiting the MSSQL service, they gained access to each of the organization’s internal systems.

The database engine used by the company was Microsoft SQL Server 2019.0150.2160.04, misconfigured to allow operating system сommand execution via the xp_cmdshell extended stored procedure.

Due to this misconfiguration of an internet-exposed service, the attackers established a channel capable of executing any type of command directed at the server and the local infrastructure within its scope.
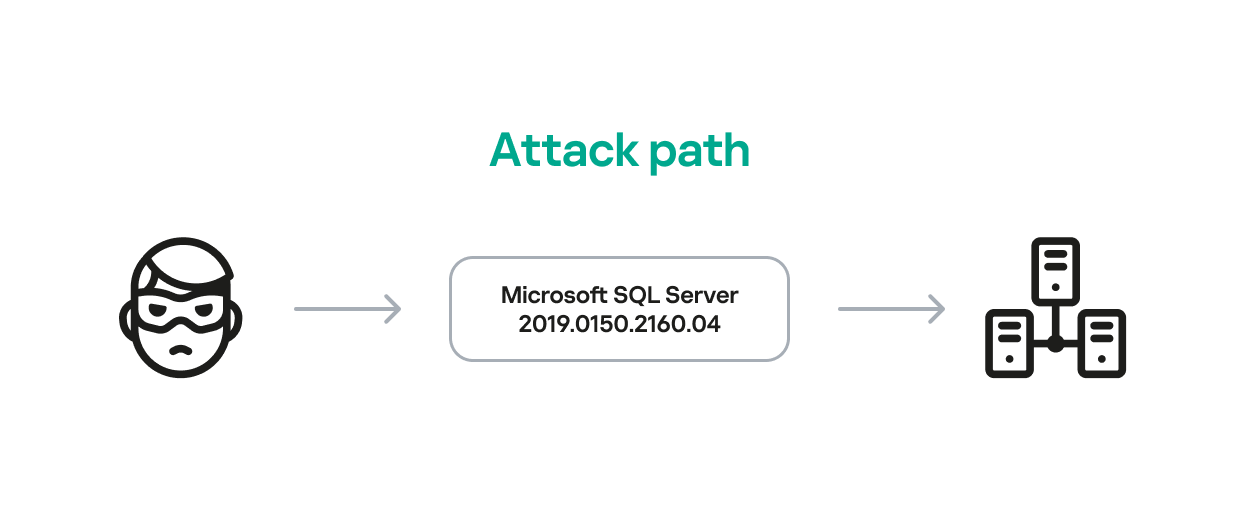
Attack path

One of the main objectives was to identify shared systems and resources that provided access to critical information. Our analysis confirmed the attackers’ access to systems storing configuration parameters for networking, enterprise management, and cloud services, among others.
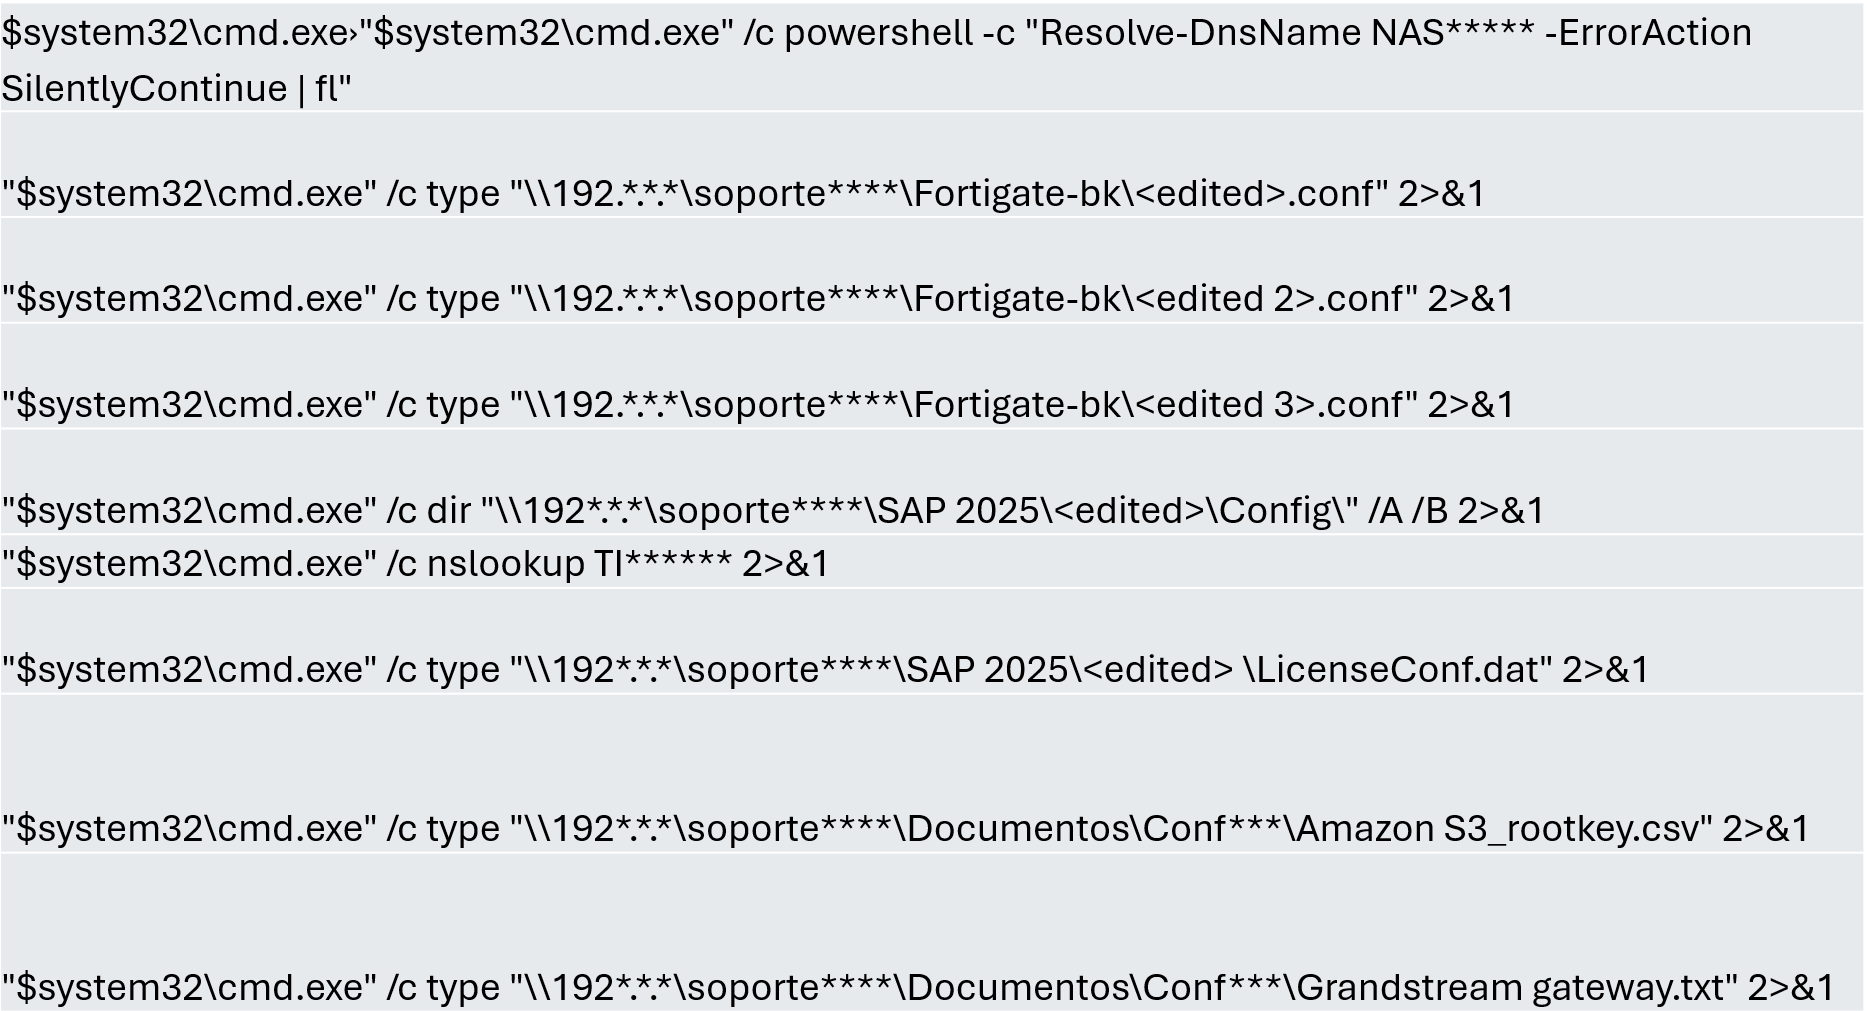
A subset of the critical information identified and collected by the attackers

A subset of the critical information identified and collected by the attackers

In early May, the attackers focused on running additional scans and deploying ManageEngine’s Endpoint Central RMM (Remote Monitoring and Management) to establish persistence and begin the final stages of their intrusion.

Scanning and RMM deployment

Scanning and RMM deployment

Further RMM-type applications, such as Mesh Agent and Tactical RMM, were installed in the days that followed. These were used to deploy scheduled tasks responsible for enabling the BitLocker service and individually encrypting the infrastructure’s disks, generating a key for each encrypted system.
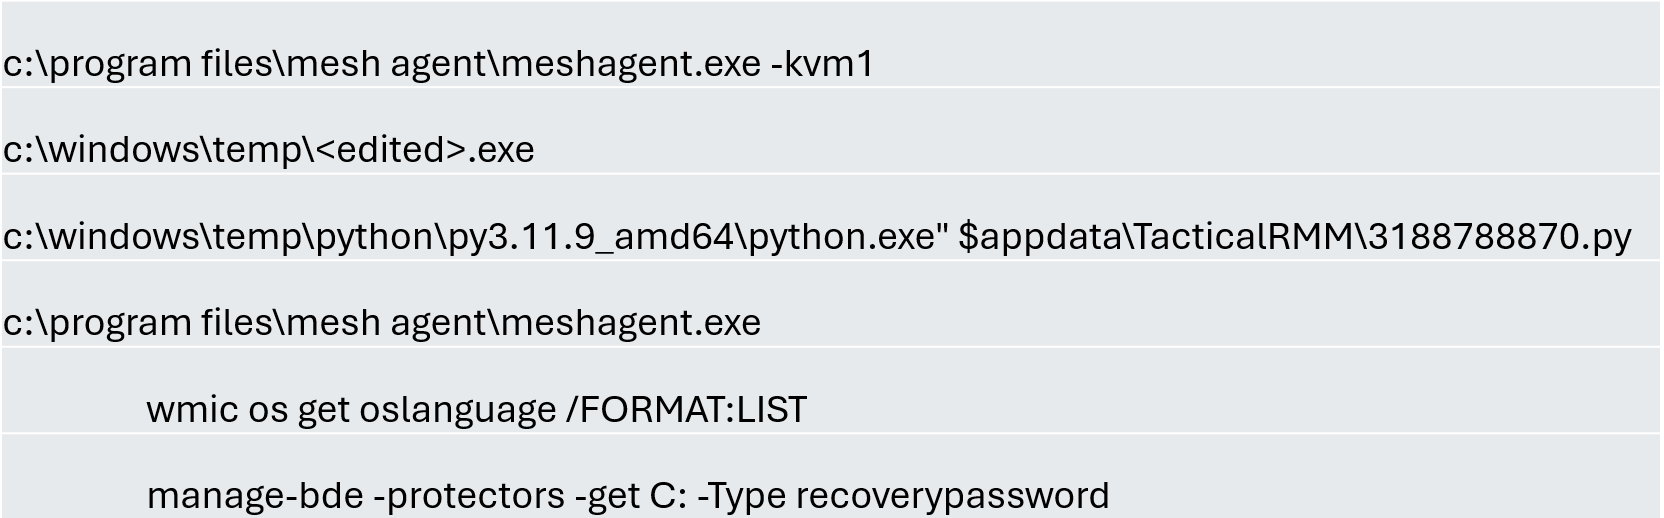
Commands executed through RMM tools to collect Bitlocker keys

Commands executed through RMM tools to collect Bitlocker keys

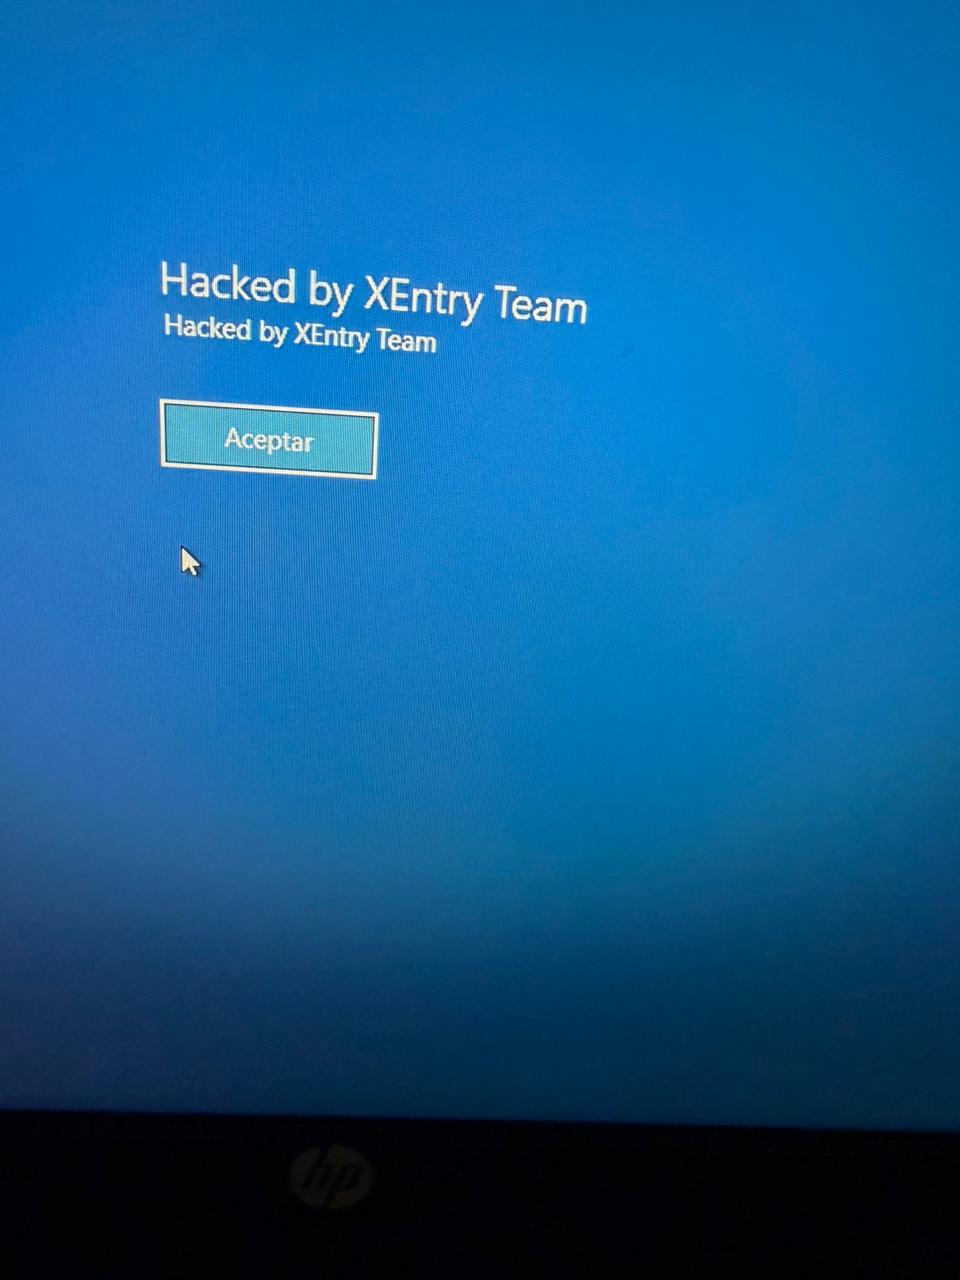
Finally, in mid-May, the attackers managed to execute a Group Policy Object (GPO) used to deploy activation and encryption tasks, as well as other policies responsible for continued deployment of RMM applications via scheduled tasks. The activity initially targeted critical systems but later spread to every system synchronized with the domain controller. Users became aware of the attack when their machines displayed a blue screen with the message β€œHacked by XEntry Team”, and their credentials stopped working to access their systems.

A few hours later, ransom notes began emerging from office printers.

Ransom note printed by the XEntry team

Ransom note printed by the XEntry team

These cases confirm that adversary’s objective is to gain access to infrastructure while avoiding investment in or partnership with ransomware groups. Instead, they leverage built-in Microsoft tools to facilitate data encryption and ransom payments. Monitoring and centralizing logs on protected resources, as well as promptly managing alerts, are critical to countering this type of intrusion.

Conclusions

  • Although the systems under review had security measures in place, there was a lack of proper alert management or inadequate decisions regarding application incompatibilities.
  • We strongly recommend configuring the Remote Desktop Protocol (RDP) in strict accordance with cybersecurity best practices to prevent unauthorized access. This is especially critical: according to our Global Report: Anatomy of a Cyber World, more than 13% of incidents are related to policy violations and configuration errors, confirming that misconfigurations continue to pose a significant risk.
  • Organizations should prioritize strict application control policies and active monitoring of network traffic for command-and-control (C2) communications. This is especially critical: according to the same report, more than 20% of incidents involved the abuse of RMM (Remote Monitoring and Management) tools for execution and C2 strategies. The fact that attackers used more than three distinct tools to gain control during a single incident further underscores the urgent need for these measures.
  • Some questions remain unanswered due to a lack of evidence and a hasty system restoration effort that bypassed critical stages of the incident response process. It is important to ensure an adequate incident response procedure, preserving evidence to confirm all related activities, and adjusting or proposing controls to prevent future incidents involving similar TTPs.
  • Although the ransom notes do not reveal a clear connection between the actors, certain words used in the messages, as well as the method of delivery and communication, may confirm a link:

β€œAs a guarantee, we have no negative online reviews about non-fulfillment of our obligations…” (Ransom note from the first case)

β€œOur reputation is the guarantee that all content will be fulfilled…” (Ransom note from the second case)

Our teams continue to monitor these threats.

Detection signatures

  • Trojan.Multi.Agent.gen
  • Trojan.Win32.GenAutorunMsSqlServerCommandRun.a
  • Trojan.Win32.Generic
  • Exploit.Win32.SCShell.a

Threat landscape for industrial automation systems. Q1 2026

7 July 2026 at 06:00

All threats

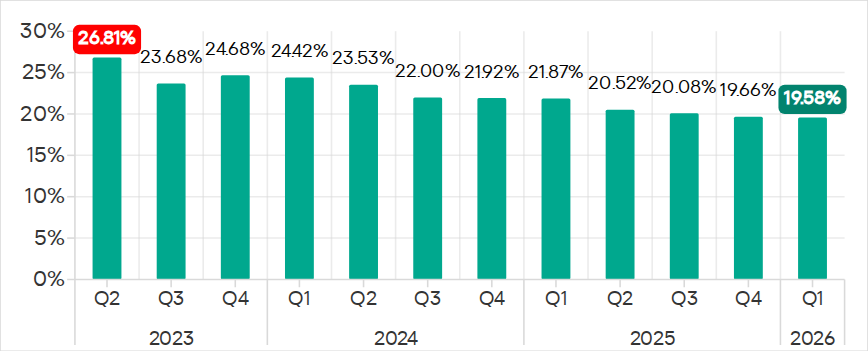
The percentage of ICS computers on which malicious objects were blocked continued to decrease, reaching 19.6% in Q1 2026. This is the lowest value in three years, and it is 1.4 times lower than in Q2 2023.

Percentage of ICS computers on which malicious objects were blocked, Q2 2023–Q1 2026

Percentage of ICS computers on which malicious objects were blocked, Q2 2023–Q1 2026

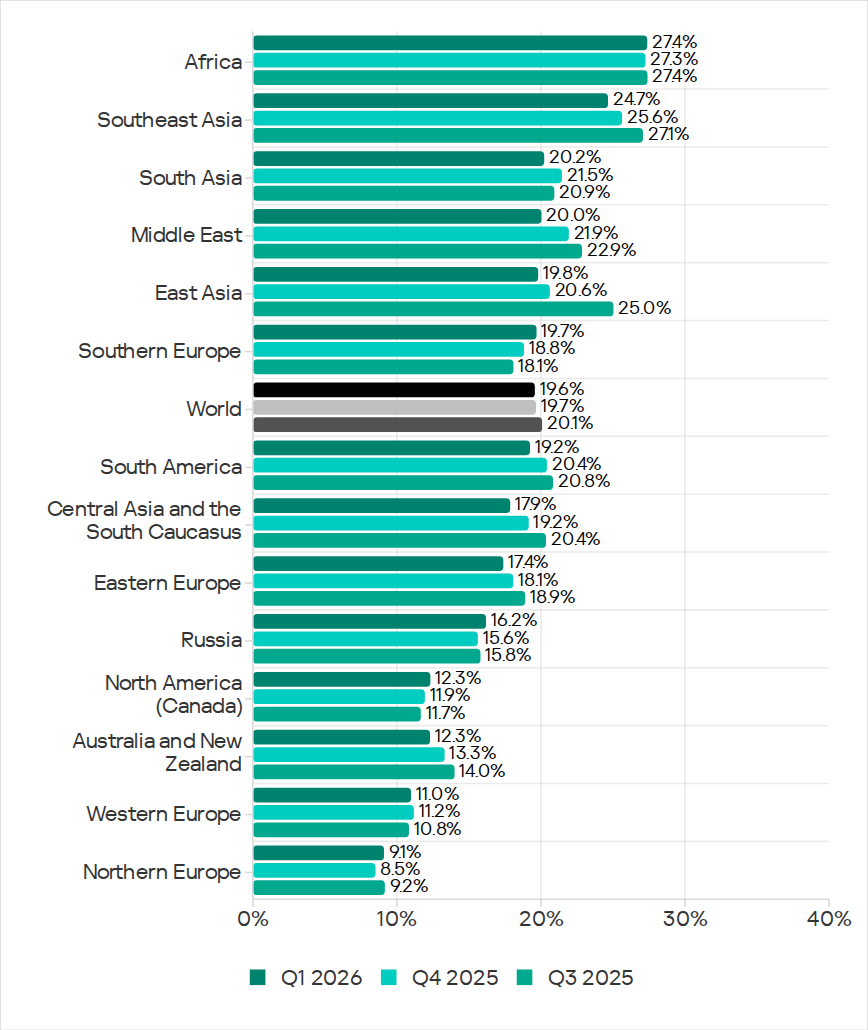
Regionally, the percentages ranged from 9.1% in Northern Europe to 27.4% in Africa.

Regions ranked by percentage of attacked ICS computers

Regions ranked by percentage of attacked ICS computers

The percentage of ICS computers on which malicious objects were blocked increased in five regions over the quarter, most notably in Southern Europe, Northern Europe, and Russia.

In Q1 2026, Southern Europe led the way in growth for internet and email threats. The region also saw the fastest growth in spyware, as well as malicious scripts and phishing pages.

In Russia, the percentage of ICS computers on which malicious objects were blocked exceeded the figures for the previous two quarters. Russia saw an increase in the percentage for threats from the internet, and a slight increase in the figure for threats from email clients (Russia is one of three regions where this figure did not decrease).

Among the threat categories, the greatest increases were observed in the percentages for denylisted internet resources, as well as spyware (distributed in the region via the internet and email clients).

Selected industries

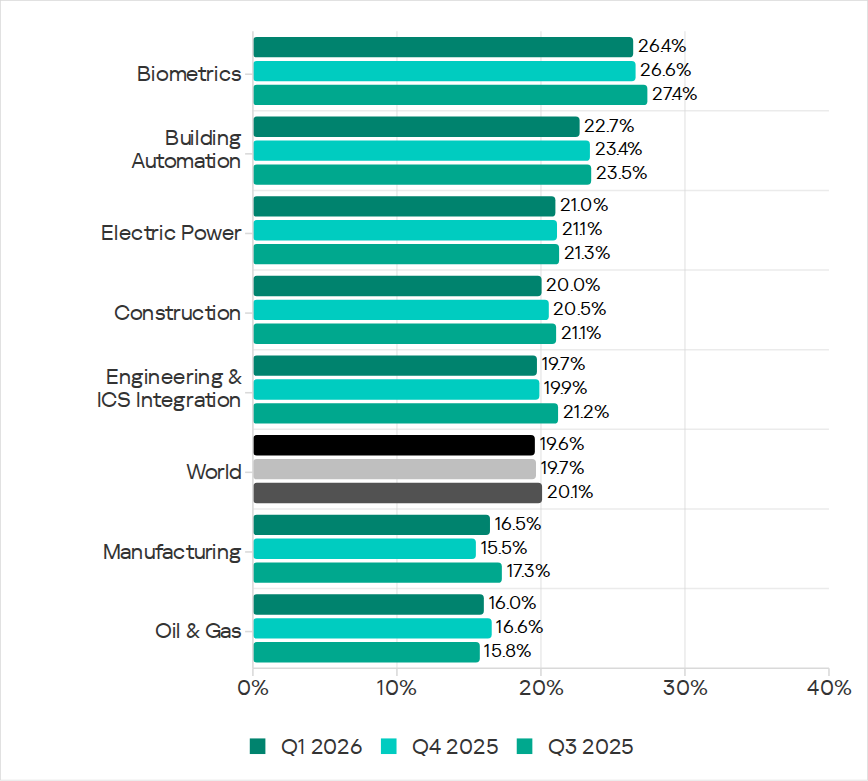
Biometric systems (26.4%) traditionally rank top among the industries and OT infrastructure types covered in this report in terms of the percentage of ICS computers on which malicious objects were blocked. These systems are characterized by internet access, extensive email use for data exchange and approvals (such as access granting), and, in many cases, minimal cybersecurity controls within the organizations that use these systems.

Industries ranked by the percentage of ICS computers on which malicious objects were blocked

Industries ranked by the percentage of ICS computers on which malicious objects were blocked

Biometric systems rank first among industries in terms of email threats. At the same time, unlike other industries, the percentage for email threats in biometric systems exceeds that for internet threats.

In all selected industries, the global average follows a downward trend. In Q1 2026, the percentage of ICS computers on which malicious objects were blocked increased only in the manufacturing sector β€” by 1.0 pp. The percentages for this industry increased across 10 regions, with the most notable increases in Western Europe, Northern Europe, and Russia.

Threat categories

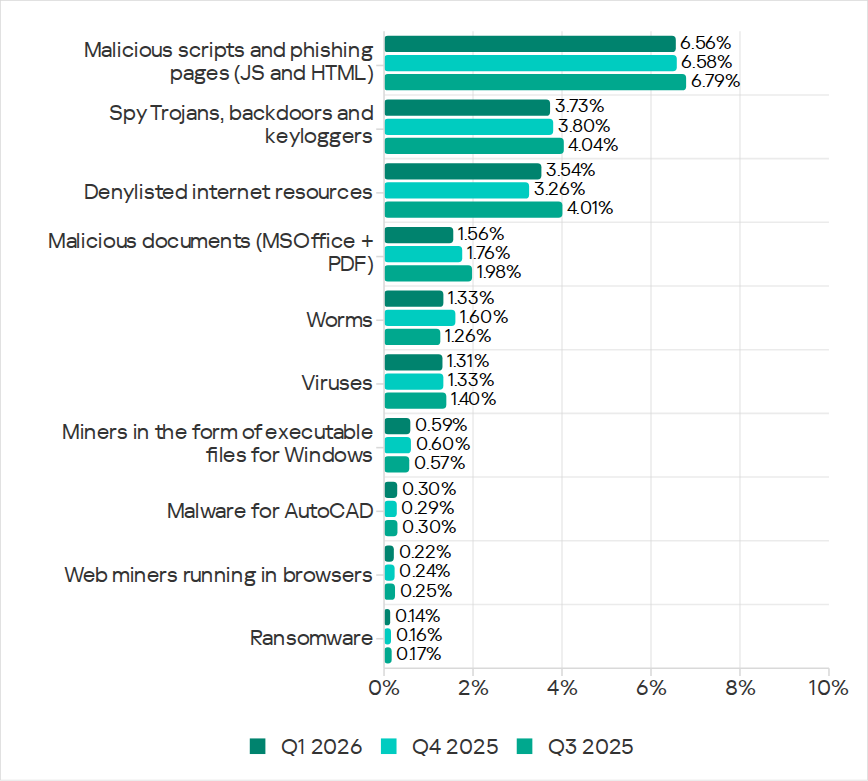
In Q1 2026, Kaspersky security solutions blocked malware from 10,052 different malware families of various categories on industrial automation systems.

Over the quarter, the percentage of ICS computers on which denylisted internet resources were blocked increased (after decreasing over the previous two quarters), and there was a slight increase in the percentage for AutoCAD malware.

Percentage of ICS computers on which the activity of malicious objects from various categories was prevented

Percentage of ICS computers on which the activity of malicious objects from various categories was prevented

Malicious scripts and phishing pages (JS and HTML)

Malicious scripts and phishing pages retained their to spot among threat categories by the percentage of ICS computers on which these threats were blocked. The global average in Q1 2026 was 6.56%.

Over the quarter, the percentages increased in four regions. The most significant change was observed in Southern Europe (9.85%, +0.94 pp). The figures for malicious scripts in the region increased over three consecutive quarters.

Among the selected industries, across all regions, the highest percentages for the malicious scripts and phishing pages category were recorded for biometric systems (19.59%) and building automation (15.43%) in Southern Europe. These same industries lead in similar rankings for malicious documents and spyware.

Spyware

The percentage of ICS computers on which spyware was blocked decreased over two consecutive quarters, dropping to 3.73%. Despite the decline, spyware has ranked second among threat categories by the percentage of attacked computers for three consecutive quarters.

The percentages increased in five regions over the quarter, most notably in Southern Europe (5.46%, +0.35 pp) and Russia (2.84%, +0.24 pp).

In Southern Europe, the percentage of ICS computers on which spyware was blocked increased in all the selected industries except manufacturing. The greatest increase was observed in biometric systems.

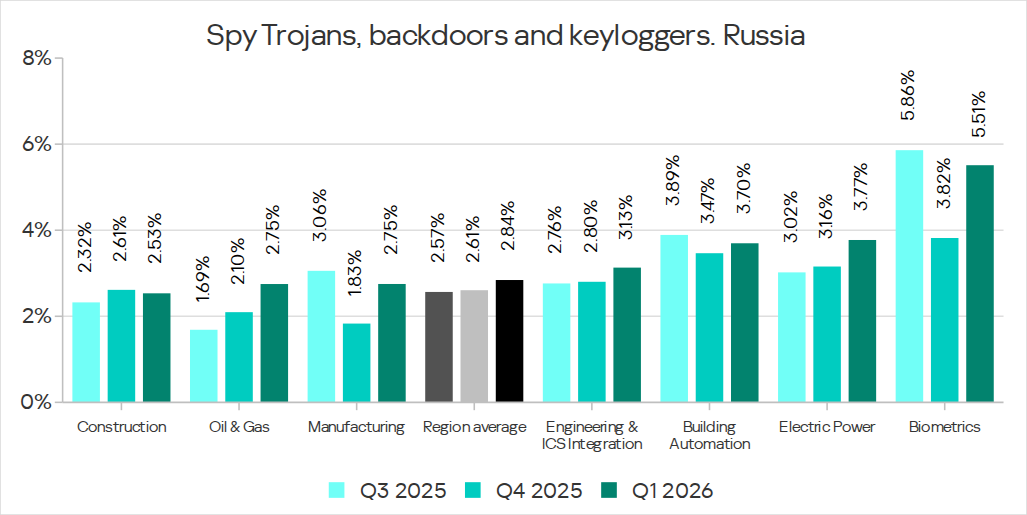
Among the selected industries, the highest percentage of spyware in Russia was recorded in biometric systems. That said, the percentage of ICS computers on which spyware was blocked increased in all industries in the region except construction. The percentage figure has been increasing for two consecutive quarters in the oil and gas industry (by a factor of 1.63 over six months), and for three consecutive quarters in engineering and ICS integration, as well as electric power. In the remaining sectors, the values have been fluctuating.

Percentage of ICS computers on which spyware was blocked in various industries in Russia, Q3 2025–Q1 2026

Percentage of ICS computers on which spyware was blocked in various industries in Russia, Q3 2025–Q1 2026

Denylisted internet resources

The percentage of ICS computers on which denylisted internet resources were blocked increased to 3.54%.

The most notable increase over the quarter occurred in Southeast Asia (4.58%, +0.65 pp). Among the industries in the region, the highest percentage figures for this threat category were recorded in electric power and construction. Over the quarter, the largest increases in percentages figures were observed in the electric power and manufacturing industries.

In North America (Canada), denylisted internet resources (2.14%) showed the greatest increase among all categories β€” by a factor of 1.22.

Among the selected industries across all regions, the highest percentage figures for the denylisted internet resources category were in the electric power (7.11%) and construction (6.25%) industries in Southeast Asia.

Malicious documents (Microsoft Office + PDF)

The percentage figure for this category decreased over two consecutive quarters, reaching its lowest value (1.56%) for the entire period of observations in Q1 2026. It increased just in two regions: Australia and New Zealand (1.12%, +0.04 pp), and Russia (0.62%, +0.01 pp).

Among the selected industries across all regions, the highest percentages for malicious documents were recorded for biometric systems (9.02%) and building automation (6.97%) in Southern Europe. These same industries also lead in similar rankings for malicious scripts and spyware.

Ransomware

The percentage of ICS computers on which ransomware was blocked has decreased for two consecutive quarters, dropping to 0.14%. This is the lowest value among all categories.

The percentage increased in two regions: North America (Canada) (0.11%, +0.04 pp) and slightly in Northern Europe (0.06%, +0.01 pp).

Among the selected industries across all regions, the highest percentages for ransomware were recorded in the oil and gas and manufacturing industries (0.92% and 0.65%, respectively) in Central Asia and the South Caucasus, and in biometric systems (0.89%) in Russia.

Miners in the form of executable files for Windows

The percentage of ICS computers on which miners in the form of executable files for Windows were blocked decreased to 0.59%.

The percentage increased in seven regions. The largest increase was observed in Africa (0.63%, +0.16 pp). Among the selected industries, the largest increases in the region were in the manufacturing and oil and gas industries.

Among the selected industries across all regions, the highest percentages for miners in the form of executable files were recorded in construction (1.99%), biometric systems (1.98%), and the oil and gas industry (1.97%) in Central Asia and the South Caucasus.

Web miners

The percentage of ICS computers on which web miners were blocked has been declining for a year, and in Q1 2026, it reached the lowest value for the entire period under review (0.22%).

At the same time, the percentage increased in seven regions. The largest increases were observed in South Asia (0.28%, +0.11 pp), the Middle East (0.31%, +0.09 pp), and Africa (0.34%, +0.08 pp). Despite the increases, the percentages in these regions for Q1 2026 did not exceed those observed in 2023–2024 and in Q1 2025.

Among the selected industries across all regions, the highest percentages for web miners were recorded for biometric systems (0.97%) in Russia. Biometric systems in South Asia (0.79%) ranked second, and the electric power sector in Southeast Asia (0.76%) ranked third.

Worms

The percentage of ICS computers on which worms were blocked decreased to 1.33%.

The percentage decreased across all regions following an increase in the previous quarter (due to a wave of phishing attacks that distributed the Backdoor.MSIL.XWorm backdoor worm across all regions of the world).

Among the selected industries across all regions, the highest percentage figure for worms was recorded for biometric systems (4.80%) in Central Asia and the South Caucasus. Two industries in Africa – biometric systems (4.04%) and electric power (3.53%) – took the second and third spots, respectively.

Viruses

The percentage of ICS computers on which viruses were blocked decreased to 1.31%.

The top 3 regions by this figure remained the same: Southeast Asia (6.11%, first by a wide margin), Africa (4.15%), and East Asia (2.97%). These same regions are also among the leaders by the percentage of systems affected by AutoCAD malware. The largest increase in this figure was observed in Africa (+0.41 pp).

Among the selected industries across all regions, the highest percentages for viruses were recorded in the construction industry (6.35%) and building automation (5.50%) in Southeast Asia.

Malware for AutoCAD

The percentage of ICS computers on which malware for AutoCAD was blocked increased to 0.30%.

The most notable increase over the quarter was observed in Africa, with the region’s percentage figure rising by 0.47 pp, a very significant increase for this category, and almost doubling (to 0.91%).

Among the selected industries across all regions, the highest percentages for AutoCAD malware were recorded in the construction industry in East Asia (5.58%) and Southeast Asia (3.87%).

Main threat sources

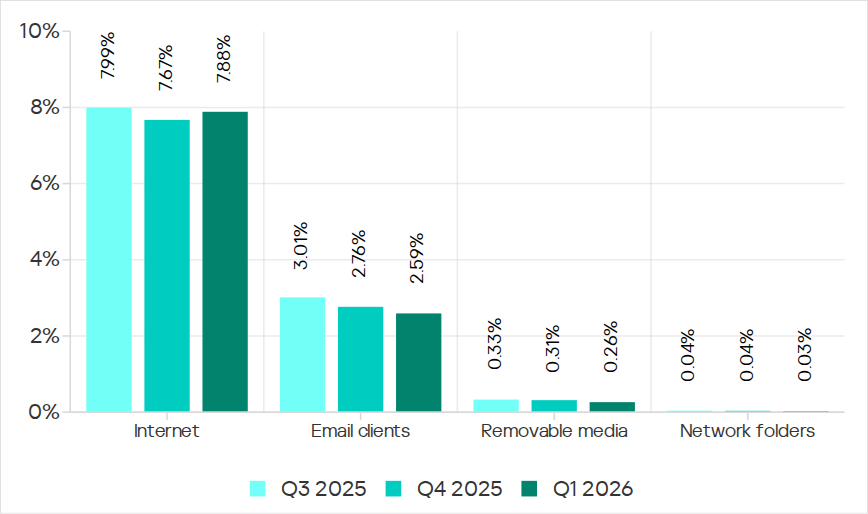
In Q1 2026, the average percentages across all threat sources, except threats from the internet, decreased globally.

Percentage of ICS computers on which malicious objects from various sources were blocked

Percentage of ICS computers on which malicious objects from various sources were blocked

Internet

The percentage of ICS computers on which threats from the internet were blocked increased to 7.88%. However, over the past three years, the percentage figure for internet threats has followed a downward trend.

The largest increases in the percentages were recorded in Southern Europe (8.59%, +0.59 pp), Southeast Asia (10.16%, +0.55 pp), and Northern Europe (4.47%, +0.51 pp).

Among the selected industries across all regions, the highest percentages for threats from the internet were recorded in electric power (13.16%) and construction (12.55%) in Southeast Asia, and in the engineering and ICS integration sector (12.33%) in South Asia.

Email clients

The percentage of ICS computers on which threats delivered via email clients were blocked decreased to 2.59%. This is a three-year low.

The percentage of this threat source increased in three regions: Southern Europe (6.54%, +0.2 pp), East Asia (1.5%, +0.09 pp), and slightly in Russia (0.7%, +0.04 pp).

Among the selected industries across all regions, the highest percentages for email threats were recorded for biometric systems (19.78%) and building automation (12.34%) in Southern Europe. In these two industries, the percentage of ICS computers on which email threats are blocked is higher than the percentage for threats from the internet. A similar situation was observed in two other instances, both in biometric systems (in South America and Southeast Asia).

Removable media

The percentage of ICS computers on which threats were detected when connecting removable media continued to decrease, reaching its lowest value for the period under review (0.26%).

Among the selected industries across all regions, the highest percentages for removable media threats blocked on ICS computers were observed in the electric power sector in Central Asia and the South Caucasus (1.45%), East Asia (1.34%), and Africa (1.16%).

Network folders

The percentage of ICS computers on which threats are blocked in network folders is steadily decreasing. In Q1 2026, it was the lowest for the period under review (0.029%).

East Asia has traditionally led by a wide margin. The percentage for East Asia (0.135%) is 27 times higher than the lowest regional value (recorded in Northern Europe).

The largest increases in the percentages for threats from network folders were observed in Africa (0.037%, +0.006 pp) and South America (0.013%, +0.006 pp).
Among the selected industries across all regions, the construction industry in East Asia, at 0.36%, holds the top positions in the ranking by the percentage of ICS computers on which threats are blocked in network folders.

For more information on industrial threats see the full version of the report.

❌
❌