❌

Normal view

There are new articles available, click to refresh the page.
Before yesterdaySecurelist

Group Policy hijacked: PAYLOAD ransomware weaponizes Active Directory GPO

Executive summary

In April 2026, we at Kaspersky’s Global Emergency Response Team (GERT) responded to a security incident at a manufacturing organization in the Middle East. The threat actor obtained domain admin-equivalent control of the organization’s Active Directory environment and authored a malicious Group Policy Object (GPO) named PAYLOAD, linking it at the domain root. Through that single object, the actor delivered ransom notes, hijacked the desktop wallpaper and lock screen, enforced a logon banner, and disabled the local administrator account across every domain-joined Windows workstation — all without dropping a ransomware binary or encrypting any data. The only ransomware we found in this incident was PAYLOAD sample targeting ESXi on Linux servers. Besides that, data exfiltration was observed originating from the file servers and several additional systems, and was later published on the dark web.

This case is an example of two converging trends that define the 2026 ransomware landscape:

  1. Living-off-the-land abuse of trusted AD infrastructure. Group Policy is a signed, allowlisted, SYSTEM-privileged distribution channel that the majority of endpoint detection and response tools is designed not to inspect. By delivering impact through GPO rather than through malware, the actor sidestepped the entire file- and process-based detection stack.
  2. Encryptionless extortion. Industry telemetry shows extortion-only incidents grow significantly year-on-year. PAYLOAD fits this model; the leverage is operational disruption and the threat of escalation rather than cryptographic denial of data.

We confirmed that no files were encrypted on Windows machines, no malicious binaries were resident on disk, no endpoint persistence was established, and no malicious processes were running at the time of analysis. The entire attack lived inside Active Directory itself. The defensive implication is stark: an organization whose detection strategy depends on catching a ransomware executable would have seen nothing until the first endpoint rebooted and the ransom wallpaper appeared.

In this article, we will describe the GPO attack chain and provide operational advice on how to detect such threats, including detailed remediation recommendations.

Group Policy as an attack surface

Attacks through group policies are nothing new. They can inflict significant, domain-wide damage with multiple malicious capabilities. A Group Policy Object (GPO) is essentially a combination of a Group Policy Container (GPC) in Active Directory and a Group Policy Template (GPT) in SYSVOL. The Group Policy scope depends on whether the GPC is linked to the directory tree at the domain, site, or organization unit (OU) level. A link at the domain root means the policy applies to every computer and user object beneath it. Thus, a GPO compromised at the domain root can affect all in-scope domain users and computers, potentially granting an attacker complete control over the corporate network. What makes GPO abuse even more dangerous is that group policies are processed in a trusted, high-privilege environment, ensuring persistence because endpoint cleanup is not enough to remove them.

We have already discussed GPO architecture and ways it can be compromised in greater detail in an earlier blog post. Other public threat intelligence has also repeatedly documented this technique in ransomware operations. Microsoft observed Ryuk operators distributing ransomware through Group Policy, SYSVOL startup items, and PsExec. LockBit affiliates have been documented modifying SYSVOL Group Policy files, including ScheduledTasks.xml, to support ransomware execution and propagation. BlackCat/ALPHV operators have also abused GPOs to create scheduled tasks and deploy ransomware.

Another notable example of GPO abuse is PAYLOAD ransomware, which weaponizes GPO Preferences and policy settings for pure impact rather than as a launcher for an encryptor. Let’s take a closer look at this attack, which is detailed further below.

Attack timeline

During the April 2026 investigation, we managed to reconstruct the attack timeline as outlined below:

Date Event
11 April Initial access. Threat actor authenticates to the FortiGate SSL VPN using a valid but compromised domain credential.
13 April GPO authored. Malicious GPO, PAYLOAD ({C897F2C7-C2AC-4E6F-BF48-58036FF29E79}) created and linked at the domain root, configuring ransom notes, wallpaper, lock screen, logon banner, and administrator account disablement.
13 April SYSVOL staging. The payload.jpg and hello.txt files written to \\DC.THECOMPANY.local\sysvol\THECOMPANY.local\.
13 April Second GPO. GPO named win Firewall Off ({22099AD2-E062-4F56-B574-5099BBA4E7A6}) linked at the domain root, disabling Windows Firewall on all profiles.
13 April Dormancy. GPO cached on endpoints but computer configuration not yet applied — no endpoint had rebooted since the policy update.
13 April Data exfiltration. Data exfiltration was observed originating from the file servers and several additional systems.
14 April Detonation. Most of the endpoints begin rebooting; computer configuration policies apply. Ransom wallpaper, logon banner, and notes appear. Operational disruption begins.
15 April Response. Kaspersky GERT engaged. Forensic triage of affected workstations and the domain controller initiated.
16 April Assessment. GERT confirms no file encryption, no resident malware, no endpoint persistence.

Next, we will discuss each of these stages in more detail and share the findings from our incident response activities.

Incident overview

Initial access

The entry vector was a compromised valid account (MITRE ATT&CK T1078) used to authenticate through the organization’s FortiGate SSL VPN — an external remote service (T1133). Insufficient logging on the FortiGate appliance prevented us from reconstructing how the credential was originally compromised.

Three hypotheses were considered plausible in the context of the attack, in no particular order:

  • Password spraying or credential stuffing against the SSL VPN portal.
  • Phishing-led credential harvesting.
  • Purchase of pre-compromised credentials from an initial access broker (IAB).

Once on the internal network, the actor operated with the compromised security principal’s privileges. Because the account was able to create and link a GPO at the domain root, it held either domain admin privileges or a delegated equivalent (e.g., membership of Group Policy Creator Owners combined with link rights on the domain object).

FortiGate SSL VPN authentication logs and ESXi/virtualization privilege escalation logs were insufficient to reconstruct the lateral movement and privilege escalation chain between initial VPN access and the GPO write privilege level. The most common real-world routes to GPO control — DCSync, Kerberoasting of privileged service accounts, and Pass-the-Hash/Pass-the-Ticket — could not be confirmed or ruled out.

Execution

Rather than deploying an encryptor, the actor abused the victim’s Active Directory policy infrastructure, resulting in malicious GPOs being configured and linked at the domain root to deliver the observed impact across domain-joined systems. The two GPOs below constitute the entire offensive toolkit observed.

The PAYLOAD GPO

We performed a Resultant Set of Policy (RSOP) analysis, which helped us list all policy settings on the affected workstations. From these results, we reconstructed the following changes delivered by PAYLOAD:

GPO extension/CSE Setting/path Configured value/resulting action
Files (Group Policy Preference) Source SYSVOL\hello.txt → Desktop, C:\, D:\ Dropped as README-payload.txt (ReadOnly)
Registry (Computer) HKLM\SOFTWARE\Microsoft\Windows\CurrentVersion\Policies\System\legalnoticecaption Welcome to Payload!
Registry (Computer) HKLM\…\Policies\System\legalnoticetext (ransom demand text)
Personalization Policy Lock Screen Image \\DC.THECOMPANY.local\sysvol…\payload.jpg
Desktop Policy (User) Wallpaper path \\DC.THECOMPANY.local\sysvol…\payload.jpg
Security Settings (GptTmpl.inf) Accounts: Administrator account status Disabled

The PAYLOAD GPO enabled the following actions:

  1. Drop SYSVOL\hello.txt to the desktop and root directories C:\ and D:\ as a read-only README-payload.txt by tampering with the “Group Policy Files” client-side extension (CSE).
  2. Modify the HKLM\SOFTWARE\Microsoft\Windows\CurrentVersion\Policies\System\ registry key, changing the legalnoticecaption value to "Welcome to Payload!" and the legalnoticetext to the ransom note text through the “Group Policy Registry” CSE.
  3. Set payload.jpg located in the targeted domain controller’s SYSVOL as the lock screen image by altering the personalization policy, and as the wallpaper by altering the desktop policy at the user level.
  4. Revoke administrator rights for the administrator account (locking the account) by editing the Security Settings CSE in the GptTmpl.inf file.

Settings changed by PAYLOAD GPO

Settings changed by PAYLOAD GPO

This activity was enabled entirely through a legitimate group policy mechanism, meaning there is no malware code for security solutions to look for because the malicious logic is contained within the policy configuration.

The win Firewall Off GPO

A second domain-root-linked GPO, named “win Firewall Off”, disabled Windows Firewall across the domain, private and public profiles on all endpoints (T1562.004). Deployed independently of PAYLOAD, this object degraded host defenses and ensured the actor retained unimpeded network reach to endpoints for any follow-on activity.
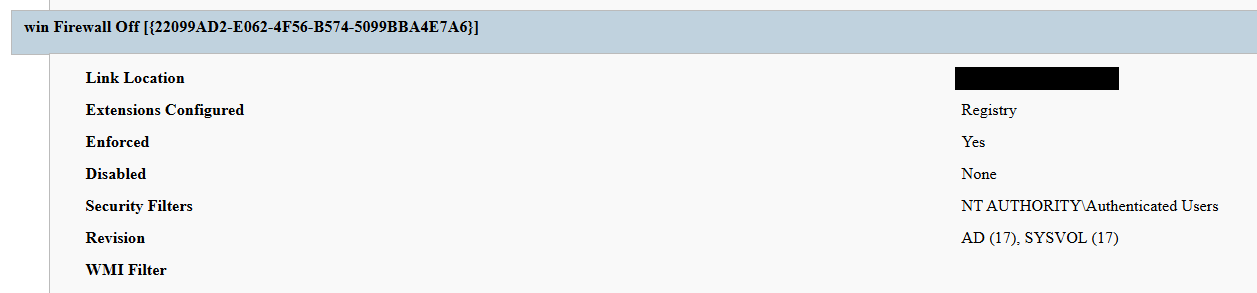
Settings changed by win Firewall Off GPO

Settings changed by win Firewall Off GPO

The one-day delay detonation

The most forensically instructive detail is the one-day gap between GPO creation (13 April) and visible impact (14 April). Analysis of Master File Table (MFT) timestamps and the Group Policy History registry key confirmed the policy was written to SYSVOL and cached on endpoints on 13 April. However, computer configuration settings (wallpaper and lock screen machine policy, security settings, firewall disabling) only apply upon reboot or policy refresh — and no endpoint had rebooted in the interim. The attack therefore remained dormant in the GPO cache for one day before detonating en masse when machines were restarted in accordance with standard procedures.

We have to point out here that this delayed policy application is characteristic of GPO-based operations and has two potential consequences for defenders. Firstly, it may grant the actor a quiet window for exfiltration, persistence, or further staging between weaponization and impact. Secondly, it can be used to sever the temporal link between the cause (a GPO-creation event in the directory log) and the effect (mass user-visible disruption occurring at a later time), complicating timeline reconstruction unless directory service auditing is in place.

Forensic findings

Initial incident response engagement revealed a number of findings associated with the attack that we share below.

  1. No file encryption
    A full review of the MFT on affected workstations found no files bearing a .payload extension characteristic to PAYLOAD ransomware and no evidence of bulk renaming or encryption I/O patterns. The attackers’ objectives were operational disruption and extortion via visual impact and access denial.
  2. No endpoint persistence
    All standard persistence locations were clean:
    • Scheduled tasks — no malicious tasks
    • Run/RunOnce keys — clean
    • Startup folders (user and system) — clean
    • Services — no malicious service installed
    • WMI event subscriptions — none
    • Boot sector/MBR — unmodified

    The attack’s persistence mechanism is the GPO link itself on the domain controller, with no endpoint-resident component.

  3. No active malicious processes
    Live process and memory analysis revealed no injected threads, process hollowing or anomalous outbound connections.
  4. Registry timeline analysis
    Group Policy History, Shadow and State registry keys on the workstation recorded the application of PAYLOAD on 13 April:
    HKLM\…\Group Policy\History\{35378EAC-683F-11D2-A89A-00C04FBBCFA2}\1
    HKLM\…\Group Policy\Shadow\{827D319E-6EAC-11D2-A4EA-00C04F79F83A}\0
    HKLM\…\Group Policy\State\Machine\GPO-List\7
    HKCU\…\Group Policy\History\{7150F9BF-48AD-4da4-A49C-29EF4A8369BA}\1
    HKCU\…\Group Policy\State\S-1-5-21-…\Loopback-GPO-List\5
    The presence of the “Loopback-GPO-List” entry indicates the GPO was processed in loopback mode, ensuring the user configuration (wallpaper) applied regardless of which user logged on to the machine.
  5. SYSVOL artifacts
    Two files were staged on the domain controller’s SYSVOL share and served to endpoints through the Files Group Policy Preference CSE:
    • payload.jpg — the ransom image used for both wallpaper and lock screen.
    • hello.txt — the ransom note, distributed to desktops and drive roots as README-payload.txt.

Detection engineering

Because no malicious binary or process exists, the detection logic should focus on the directory service and SYSVOL indicators. Below are the highest-value telemetry sources for identifying the described malicious activity.

  • Directory service change auditing (DS Access)
    Enable Advanced Audit Policy → DS Access → Audit Directory Service Changes on all domain controllers and set up alerts for the following events:
    Event ID Meaning Hunt focus
    5137 A directory service object was created The account that created new groupPolicyContainer objects must be an authorized GPO administrator
    5136 A directory service object was modified Changes to gPLink on the domain root or sensitive organizational units; changes to gPCMachineExtensionNames/gPCUserExtensionNames/gPCFileSysPath/versionNumber for all GPOs
    5141 A directory service object was deleted GPO deletions (relevant for tamper detection and remediation assessment)

    A gPLink modification at the domain root by a non-standard account is one of the most telling indicators of this attack class.

  • SYSVOL file integrity monitoring
    Monitor \\DC.THECOMPANY.local\sysvol\THECOMPANY.local\Policies\ for unexpected files, particularly image files, text files, scripts, ScheduledTasks.xml, and modified registry.pol/GptTmpl.inf files that were created by sources other than legitimate replication.
  • Endpoint policy application telemetry
    On endpoints, GPO application is logged in the Group Policy Operational log (Microsoft-Windows-GroupPolicy/Operational) and reflected in the History and Shadow registry keys shown above. A sudden domain-wide change to the applied policy set is a strong post-detonation signal.
  • Missing 5136 events
    If the contents of a GPO’s SYSVOL change without a corresponding 5136 event, this can indicate direct SYSVOL/template editing (e.g., via open-source tools such as PowerView or SharpGPOAbuse) that bypasses the normal Group Policy Management Console (GPMC) modification path. While we recommend treating the absence of expected audit events as suspicious, it should be noted that this can be caused by misconfigured auditing.

Anti-forensics and recovery-inhibition capabilities

Confirmed PAYLOAD family capabilities

The Windows endpoint attack described in this report was implemented through malicious Group Policy Objects and did not involve a recovered ransomware executable, resident endpoint malware, confirmed file encryption or active malicious processes at the time of the forensic examination. However, PAYLOAD cryptomalware for Windows does exist, and other sources, including public analysis of its samples, reveal further malicious capabilities of this ransomware that could be used by security teams to enrich detection logic and security policies.

The behaviors documented in this section must therefore be interpreted as family-level capabilities identified through the public reverse engineering of PAYLOAD ransomware samples. They were not confirmed as having executed during the GPO-based incident unless corresponding evidence was identified in the host, memory, process, event-log, or hypervisor.

Windows Event Log clearing

Public reverse engineering of the PAYLOAD Windows variant reveals an optional event log clearing capability (T1685.005, formerly T1070.001). The ransomware dynamically resolves Windows Event Log APIs, enumerates available event log channels, and clears individual channels.

Implementation artifacts include:

  • Runtime loading of wevtapi.dll
  • EvtOpenChannelEnum
  • EvtNextChannelPath
  • EvtClearLog
  • Enumeration of Security, System, Application, and PowerShell logs, and operational channels
  • A command-line option controlling whether log clearing is performed

Clearing event logs reduces the availability of records related to process execution, authentication, PowerShell, service control, and system changes. However, it does not necessarily remove events that were already forwarded to a SIEM, Windows Event Collector, EDR backend, or protected log archive.

Forensic indicators
  • Windows Security Event ID 1102
  • Event logging shutdown or failure events
  • Sudden reductions in event record identifiers
  • Multiple event channels restarting from low record numbers
  • Gaps between endpoint and centrally forwarded telemetry
  • Execution of utilities or APIs associated with log management
  • Direct access to EVTX files (Windows Event Log files) under the Windows event log directory

We should note that these indicators can’t be interpreted on their own. For instance, Event ID 1102 should be correlated with a number of aggravating factors, such as:

  • Event ID 4688 or Sysmon Event ID 1 for process creation
  • Event ID 4624 for the associated administrative logon
  • EDR process trees
  • PowerShell operational logging
  • Windows Event Forwarding records
  • Privileged access management activity

At the same time, the absence of Event ID 1102 does not prove that log clearing did not occur. Direct deletion, truncation, service impairment, or an incomplete audit configuration may produce different evidence.

Security process and service termination

PAYLOAD analysis reveals that the Windows ransomware variant contains logic that targets security processes and services (T1685 and T1489). This capability is intended to stop security products, backup software, database services, and applications that may lock files targeted for encryption.
Process and service termination serves several objectives:

  1. Reduce endpoint detection and response visibility.
  2. Release file handles so data can be modified.
  3. Interrupt backup and recovery services.
  4. Prevent databases and enterprise applications from protecting active data.
  5. Reduce interference with encryption operations.
Forensic indicators
  • Security agent services changing from running to stopped
  • Event ID 7036 service state changes
  • Event ID 7040 service start type changes
  • Event ID 4688 or Sysmon Event ID 1 for service control utilities
  • Sysmon Event ID 5 for terminated processes
  • EDR health degradation affecting many endpoints
  • Repeated termination attempts against security or backup processes
  • Execution of dedicated process killing utilities

VSS deletion, backup and recovery suppression

Public PAYLOAD sample analysis reports the deletion of Windows Volume Shadow Copies before encryption (T1490). This behavior removes local restore points and reduces the victim’s ability to recover files without external backups.

Recovery inhibition is broader than VSS deletion and may include multiple other malicious techniques, including the following:

  • Deleting shadow copies, backup catalogs, and hypervisor snapshots
  • Disabling recovery services
  • Modifying boot recovery settings
  • Compromising backup management platforms
  • Deleting or encrypting backup repositories

In the PAYLOAD Windows sample that is proven to perform encryption, VSS deletion is confirmed to have taken place before encryption. A broader compromise of the backup platform was not established in the investigated incident.

Forensic indicators
  • Execution of shadow copy management utilities
  • Backup catalog deletion attempts
  • Recovery configuration changes
  • Backup service termination
  • Mass snapshot deletions
  • Backup administrator logons outside normal maintenance windows
  • Backup retention or immutability changes
  • Backup jobs failing immediately before disruptive activity

Ecosystem-relevant ransomware techniques

Above, we discussed the techniques specific to PAYLOAD ransomware. In this section, we’ll review other common ransomware techniques, such as BYOVD abuse and ESXi policy weakening, that remain relevant risks in the ransomware ecosystem. However, these techniques should not be attributed to this incident without supporting driver load, process, memory, ESXi, vCenter, or backup platform telemetry. We describe these techniques below as they may prove useful in other ransomware-related forensic investigations.

The examples used in this section are therefore ecosystem-relevant: they are commonly observed in ransomware operations but not conclusively attributed to the analyzed PAYLOAD samples.

ETW suppression and in-memory patching

Event Tracing for Windows (ETW) is a kernel-supported tracing architecture used by Windows components, diagnostic utilities, security products, and endpoint monitoring systems.

Although we didn’t encounter this technique in our case, some ransomware families can patch ETW-related functions inside the ransomware process (T1685, formerly T1562.001). The reported routine changes the memory protection of code pages, overwrites the beginning of selected ETW functions so they return without producing events, restores the original protection, and refreshes the instruction cache.

Reported target functions include EtwEventWrite, EtwEventWriteFull, EtwEventWriteTransfer, and EtwRegister.

This modification applies to the process-local mapping of ntdll.dll. It does not disable ETW globally across Windows, but it can reduce the telemetry generated by the modified process.

Forensic indicators
  • Writable or recently modified executable pages within ntdll.dll
  • Memory protection changes affecting ETW function addresses
  • In-memory code differing from the corresponding clean DLL on disk
  • EDR memory tampering alerts
  • Unexpected calls to memory protection APIs followed by telemetry silence
  • Process execution visible in network or filesystem telemetry but absent from expected ETW-derived sources
  • Inconsistent telemetry between EDR, Sysmon, Windows Event Logs, and network monitoring

It should be noted that telemetry gaps are not conclusive evidence of ETW patching. Other factors include agent upgrades, network outages, endpoint shutdowns, SIEM ingestion failures, collector backpressure, and filtering or licensing changes.

Memory acquisition is the strongest validation source when process-local ETW patching is suspected.

Vulnerable signed driver abuse, BYOVD

Bring Your Own Vulnerable Driver (BYOVD) involves introducing or abusing a legitimately signed but vulnerable kernel driver (T1068 and T1685). The attacker exploits the driver’s exposed functionality to gain kernel-level capabilities, modify protected memory, terminate security processes, remove security callbacks, or bypass operating system security controls.

BYOVD is highly relevant to contemporary ransomware operations. However, the reviewed public PAYLOAD analyses do not provide sufficient evidence to conclude that BYOVD is an intrinsic PAYLOAD capability.

It should therefore be presented as an ecosystem-relevant technique rather than a confirmed PAYLOAD feature.

Forensic indicators
  • Unexpected .sys files written to user-writable or temporary directories
  • New kernel driver services
  • Sysmon Event ID 6
  • Driver hashes matching Microsoft or community vulnerable driver blocklists
  • Invalid, revoked, expired, or unusual driver signatures
  • Driver load followed by EDR termination
  • New privileged processes immediately following driver loading
  • Code Integrity or Defender alerts
  • Service creation events referencing driver files

ESXi security policy weakening

Ransomware operators are increasingly targeting ESXi and vCenter because compromising the virtualization layer provides access to many business-critical virtual machines.

Public research typically describes operators performing the following activities (T1685, T1490 and T1489):

  • Enabling SSH on ESXi hosts
  • Changing root passwords
  • Disabling execInstalledOnly
  • Modifying lockdown mode exceptions
  • Stopping virtual machines
  • Deleting snapshots and backups
  • Changing host firewall policies
  • Copying custom ransomware binaries to hypervisors

On the target organization’s Linux servers we saw an ESXi PAYLOAD variant, which makes this behavior operationally relevant. Nevertheless, the reviewed evidence does not indicate that PAYLOAD operators used any of these policy-weakening actions in the investigated incident.

Forensic indicators
  • Unexpected ESXi SSH enablement
  • Changes to execInstalledOnly
  • Secure Boot enforcement changes
  • Lockdown mode configuration changes
  • Root password changes
  • New or unusual administrator accounts
  • Bulk VM shutdown activity
  • Bulk snapshot deletion
  • New binaries in datastore or temporary paths
  • vCenter tasks originating from unexpected accounts or systems
  • Missing or disabled remote syslog forwarding

Remediation

To contain the described threat and limit possible damage, several remediation steps should be taken. Below, we recommend a four-phase remediation approach for containing this threat and restoring the affected environment.

Phase 1 — domain controller actions (to be performed first)

When dealing with PAYLOAD GPO, the first priority of the remediation plan should be to remove the source GPOs. Until this is done, endpoint cleanup is ineffective because the next policy refresh re-infects cleaned machines.

The immediate domain controller actions to be taken are:

  1. Delete PAYLOAD GPO. Remove {C897F2C7-C2AC-4E6F-BF48-58036FF29E79} via GPMC.
  2. Delete or revert win Firewall Off GPO. Remove {22099AD2-E062-4F56-B574-5099BBA4E7A6}.
  3. Clean SYSVOL. Delete jpg and hello.txt from \\DC.THECOMPANY.local\sysvol\THECOMPANY.local\.
  4. Rotate credentials. Reset the compromised account; audit all privileged accounts and group memberships for unauthorized changes; rotate krbtgt twice if domain admin compromise is confirmed.
  5. Force refresh. Perform gpupdate /force across endpoints after deletion; re-enable local administrator and firewall via clean policy.

Phase 2 — Active Directory and GPO hardening

  • Adopt the AD tiered administration model and confine domain admins to Tier 0 with no interactive logon to workstations and member servers.
  • Separate GPO creation from GPO linking rights, and grant both only to a dedicated, audited administrator role.
  • Enable GPO change auditing (Event IDs 5136, 5137, 5141) and forward to a SIEM.
  • Monitor SYSVOL with file integrity tooling.

Phase 3 — credential and access hardening

  • Enforce phishing-resistant MFA on all VPN and remote access entry points.
  • Deploy Windows LAPS to generate unique, rotated local administrator passwords.
  • Enable Credential Guard to protect LSASS-resident secrets.
  • Adopt Privileged Access Workstations (PAW) for all administration.
  • Implement just-in-time elevation through Privileged Identity Management (PIM) for domain admin.

Phase 4 — detection and monitoring

  • SIEM rule: GPO creation or domain-root gPLink change by a non-standard account.
  • SIEM rule: file creation events under SYSVOL from non-replication sources.
  • Implement enhanced, centrally collected FortiGate SSL VPN logging (auth events, session detail, source IP geolocation, impossible travel check) and detailed perimeter monitoring.
  • Deploy a canary GPO whose application anywhere signals attacker GPO write access.

Conclusion

PAYLOAD demonstrates a maturing tactic of turning the victim’s own trusted infrastructure into a weapon. By weaponizing Group Policy, the actor achieved a domain-wide impact without a single malicious binary on any endpoint, evaded file- and process-based detection entirely, and caused organization-wide disruption within seconds of the first reboot.

The absence of encryption is the most strategically significant finding and is consistent with the 2026 trend toward encryptionless extortion. At Kaspersky GERT, we assess with moderate confidence that the missing encryption reflects one of two scenarios: (1) a deliberate decision to stay below the irreversible data destruction threshold while preserving the option of a follow-on encryption phase, or (2) an operation interrupted before full execution.

The absence of encrypted files must not be mistaken for the absence of a serious compromise — the most critical impact lies in the actor gaining domain admin-level control. This incident proves that a threat actor with domain admin access and a working knowledge of group policy internals can inflict domain-wide disruption equivalent to a ransomware attack without writing a single malicious file to any endpoint.

Detection strategies anchored solely in file- or process-based indicators are blind to this attack class. Effective controls include directory service change auditing, SYSVOL integrity monitoring, and privileged access governance, which allow for GPO protection.

Detection by Kaspersky solutions

Kaspersky security solutions effectively detect the described malicious activity at various stages of the attack. Possible detection scenarios are listed below.
To protect organizations that use our Kaspersky SIEM system, we have prepared a package of correlation rules designed to help detect this type of malicious activity. The rules are now available for customers to download from the SIEM repository; the package name is: [OOTB] Group policy hijacked: PAYLOAD ransomware – ENG.

The “Group policy hijacked: PAYLOAD ransomware” package contains rules that detect suspicious file creation or modification in the SYSVOL shared folder on a domain controller, as well as changes to critical attributes and settings of domain group policies. Some rules may require adjustment if they trigger in response to legitimate activity, such as synchronization between domain controllers or the configuration of a new group policy.

To ensure the detection rules function correctly, verify that events from Windows systems are being received in full, including events with the following identifiers: Sysmon: 11, Security — 4663, 5136, 4657.

We also recommend applying the following rules available in the repository to detect all attack stages.

  • Detection of Windows Event Log clearing to cover up traces of an attack: R050_03_Windows Event Log was cleared
  • Detection of suspicious access to the LSASS process, which may indicate attempts to dump credentials: R262_Suspicious access to the LSASS process
  • Detection of the Volume Shadow Copy service being started, which is used to create shadow copies before deleting them: R231_20_Running the Volume Shadow Copy service
  • Detection of shadow copy deletion: R321_Shadow copy deletion
  • Detection of Windows Defender disablement: R076_01_Windows Defender Antivirus was disabled
  • Detection of attempts to disable or modify the system firewall: R240_03_Disabling system firewall via the registry
  • Detection of a service installation from a non-system folder, which may indicate malware persistence techniques: R281_01_Installation of a service from a non-system folder

For the rules in this list to function correctly, it is necessary to configure Security event auditing for event IDs 4663, 5136, 4657, 7036, and 1102.

In addition to the SIEM system, when audit settings are configured correctly, the process of creating, modifying, and deleting GPOs generates a large number of characteristic artifacts on the domain controller, enabling Kaspersky Endpoint Detection and Response Expert to promptly alert the user to anomalies in the infrastructure.

The creation of a new GPO is covered by the gpo_creation rule, which triggers in response to the corresponding event in the infrastructure. Changes to existing policies are detected by the following rules:

GPO deletion is covered by the gpo_deletion rule.

In the next major version update of Kaspersky EDR Expert, a new event type, GPO, will be introduced, allowing users to track changes to Group Policy Objects.

For information security officers, GPO events will serve as an additional source of context when investigating activity in Active Directory and will help detect changes that could affect the configuration, access rights, and security of endpoints before a potentially malicious policy is deployed.

MITRE ATT&CK mapping

Tactic Technique Observed behavior
Initial Access T1078 — Valid Accounts Compromised domain credential used for VPN authentication
Initial Access T1133 — External Remote Services FortiGate SSL VPN used as entry point
Privilege Escalation T1078.002 — Domain Accounts Account held domain-level GPO create/link rights
Privilege Escalation/Defense Impairment T1484.001 — Group Policy Modification Malicious PAYLOAD GPO created and linked at domain root; re-applies on every refresh/reboot; uses trusted channel to evade EDR
Defense Impairment T1686 — Disable or Modify System Firewall win Firewall Off GPO disables Windows Firewall on all profiles
Impact T1491.001 — Internal Defacement Wallpaper and lock screen replaced with ransom image
Impact T1531 — Account Access Removal Local Administrator account disabled via GPO Security Settings
Collection T1005 — Data from Local System Data exfiltration was observed originating from the file servers
Command and Control T1071 — Application Layer Protocol No live C2 confirmed; delivery achieved entirely via GPO

Indicators of compromise

GPOs
PAYLOAD ransomware GPO: {C897F2C7-C2AC-4E6F-BF48-58036FF29E79}
win Firewall Off GPO: {22099AD2-E062-4F56-B574-5099BBA4E7A6}

File names and MD5 hashes
payload.jpg: Ransom wallpaper and lock screen image (SYSVOL)
hello.txt: Ransom note source (SYSVOL)
README-payload.txt: Ransom note dropped to desktops and drive roots
killer.exe (0108656A3E1ADE6CA4F21B084F5E1208): process killer tool
kill.exe (BEA5E267F24D7DA59F6821BFFDBFF293): process killer tool

IP addresses
37.19.210[.]12
146.70.117[.]239
149.102.229[.]154
104.164.55[.]46
104.28.162[.]228
104.28.163[.]162
64.190.76[.]14
192.42.116[.]50
192.42.116[.]12
192.42.116[.]56
192.42.116[.]97
192.42.116[.]52

Registry keys
HKLM\...\Policies\System\legalnoticecaption = Welcome to Payload!

SYSVOL path
\\DC.THECOMPANY.local\sysvol\THECOMPANY.local\payload.jpg

Event IDs
5137: GPO object creation on DC — review creator account
5136: GPO attribute modification — watch gPLink at domain root
Threat landscape for industrial automation systems. Q2 2026

27 August 2026 at 06:05

All threats

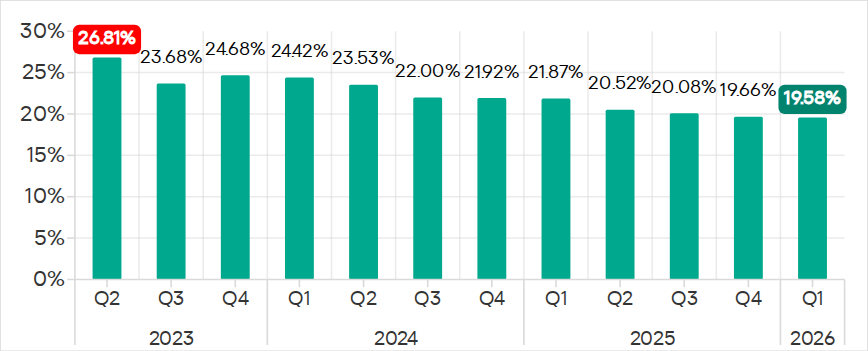
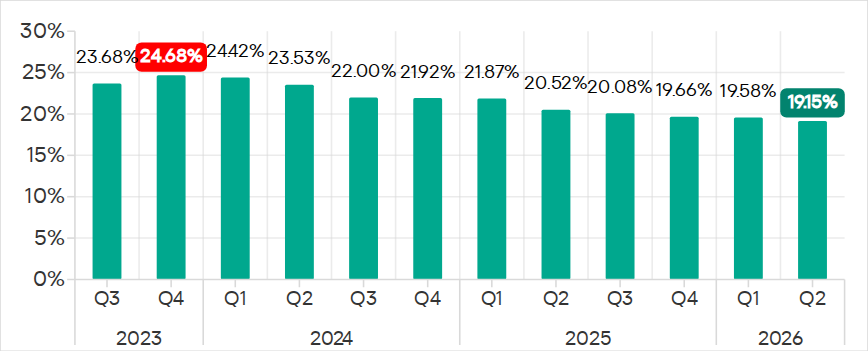
In Q2 2026, the percentage of ICS computers on which malicious objects were blocked continued to decrease, falling to 19.15%, its lowest level since 2022.

Percentage of ICS computers on which malicious objects were blocked, Q3 2023–Q2 2026

Percentage of ICS computers on which malicious objects were blocked, Q3 2023–Q2 2026

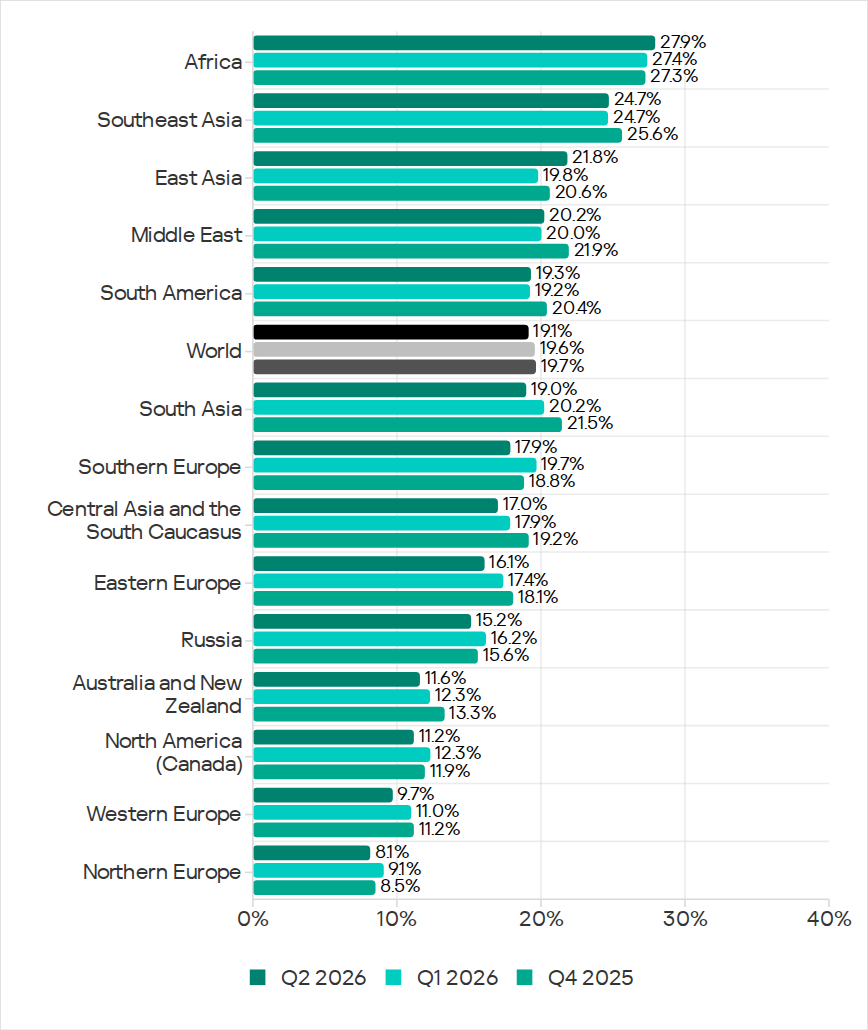
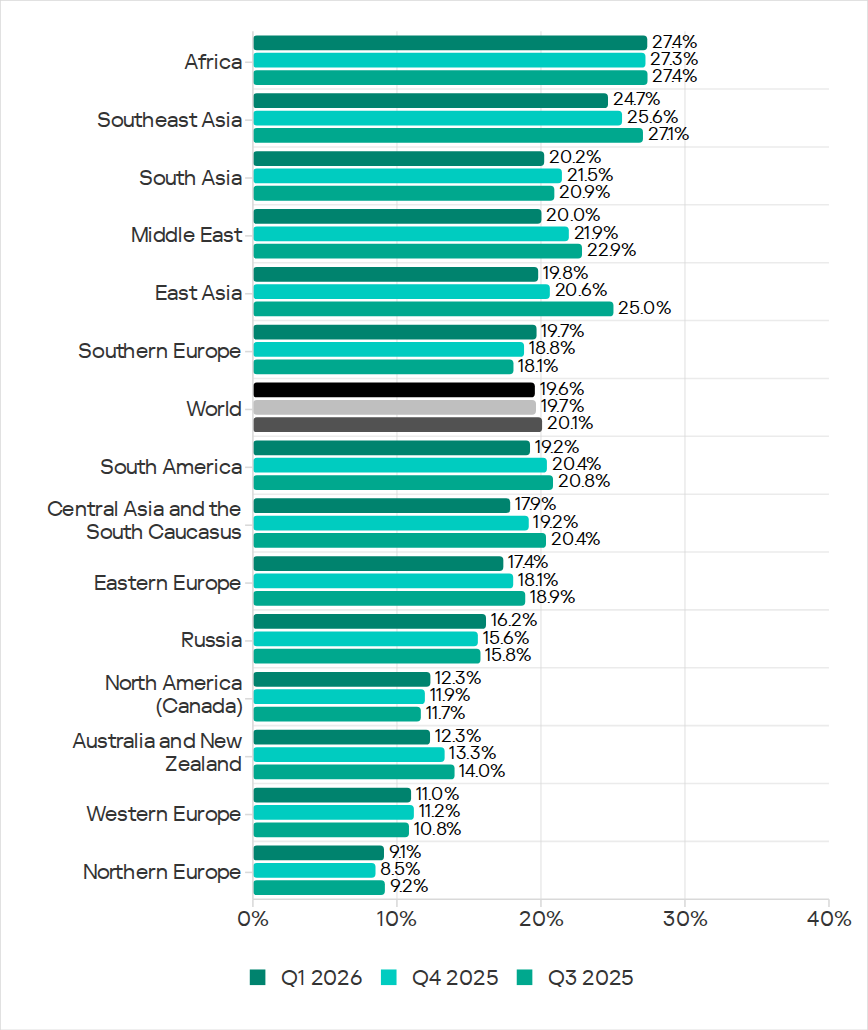
Regionally, the percentages ranged from 8.1% in Northern Europe to 27.9% in Africa.

Regions ranked by percentage of attacked ICS computers

Regions ranked by percentage of attacked ICS computers

The figures increased in five regions over the quarter, most notably in East Asia (by 2.0 pp) and Africa (by 0.5 pp).

East Asia saw increases in percentages for all threats except miners. The region ranked first in terms of growth for malicious scripts and phishing pages, spyware, and viruses. East Asia also led in terms of growth in threats from the internet. The percentage of ICS computers on which email threats were blocked also increased.

Selected industries

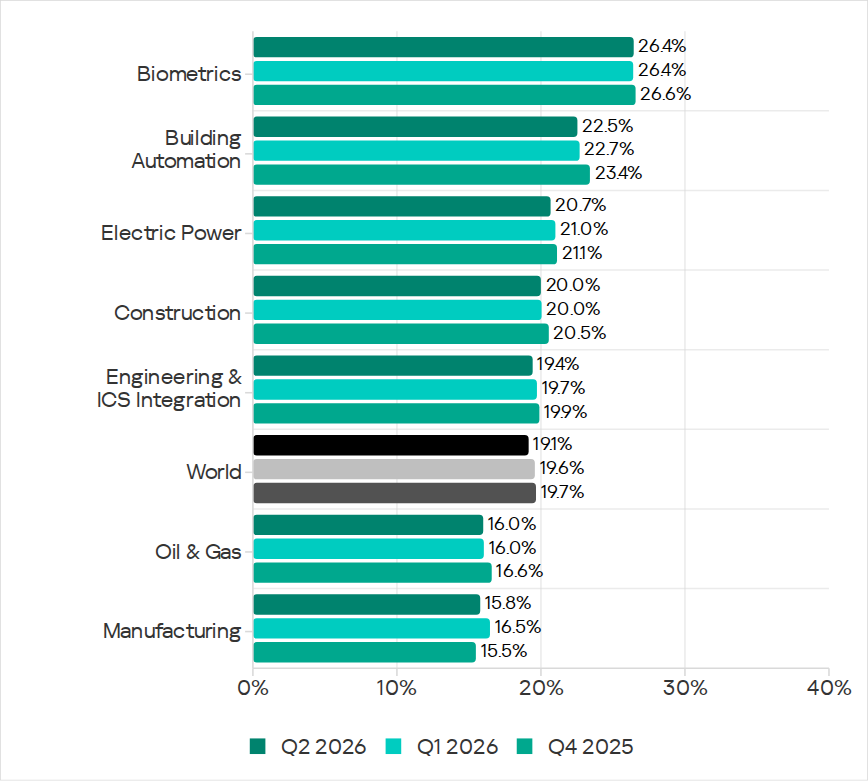
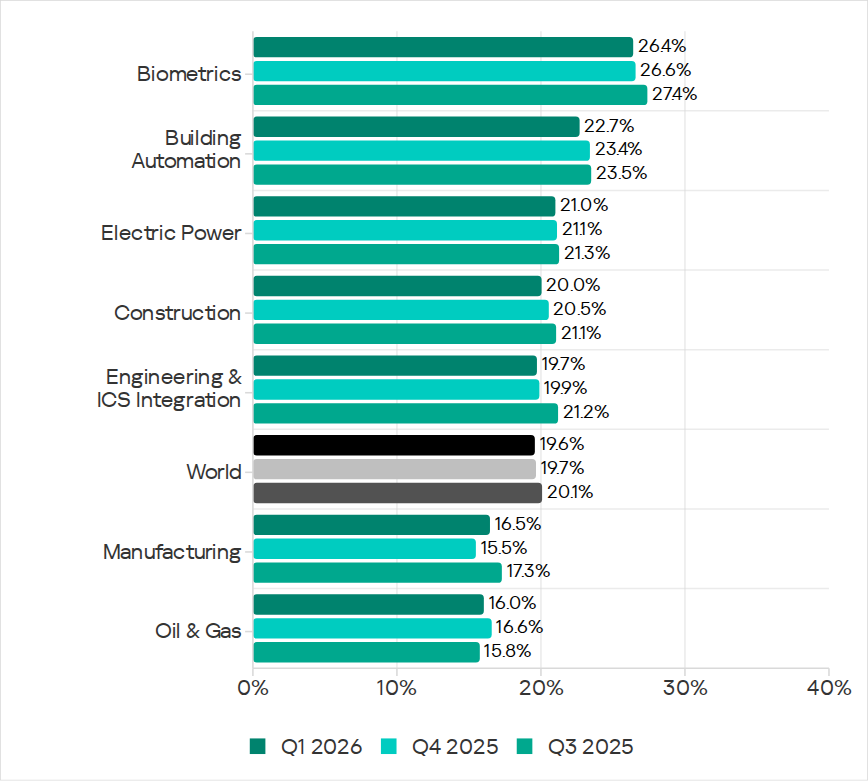
The biometrics sector (26.44%) has traditionally led the rankings of industries and OT infrastructures surveyed in this report in terms of the percentage of ICS computers on which malicious objects were blocked. Biometric systems are characterized by the availability of internet access, extensive email use for data exchange and approvals (e.g. access granting), and, in many cases, minimal cybersecurity controls within the organizations that use them.

Industries ranked by percentage of ICS computers on which malicious objects were blocked

Industries ranked by percentage of ICS computers on which malicious objects were blocked

The biometrics sector ranked first among industries in terms of the following threat categories: malicious scripts and phishing pages, malicious documents, spyware, ransomware, and worms. The sector is also leading among industries in terms of email threats. At the same time, unlike other industries, the percentage of affected ICS computers for email threats in biometrics exceeds that for internet threats.

In all selected industries, the global average follows a downward trend.

Threat categories

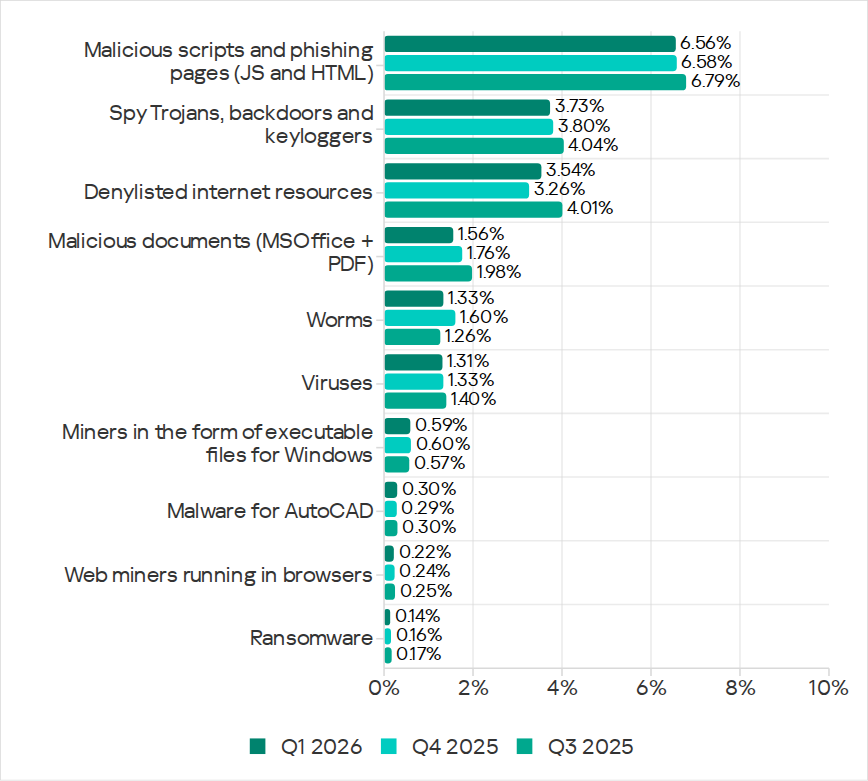
In Q2 2026, Kaspersky security solutions blocked malware from 10,904 different malware families of various categories on industrial automation systems.

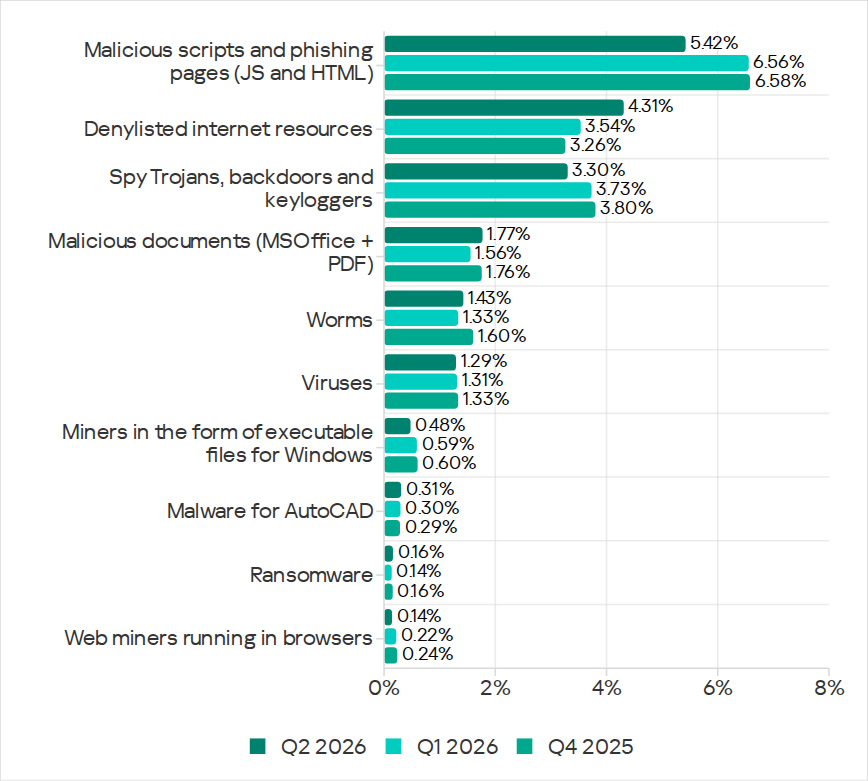
Over the quarter, the percentage of ICS computers on which malicious objects of the following categories were blocked increased: denylisted internet resources, malicious documents, worms, ransomware, and malware for AutoCAD.

Percentage of ICS computers on which the activity of malicious objects from various categories was blocked

Percentage of ICS computers on which the activity of malicious objects from various categories was blocked

Malicious scripts and phishing pages (JS and HTML)

Malicious scripts and phishing pages remained in first place in the threat category rankings based on the percentage of ICS computers on which the respective threats were blocked. In Q2 2026, the global average dropped to 5.42%.

Over the quarter, the figure for this category only increased in East Asia, rising by 0.93 pp to 4.86%. This is the second-highest figure in the region in the last three years.

In East Asia, the percentage of ICS computers affected by malicious scripts and phishing pages increased in all the industries surveyed, except construction. The highest figures were recorded for biometrics (9.01%) and building automation (6.49%).

Denylisted internet resources

In Q2 2026, denylisted internet resources rose in the threat category rankings from third to second place, displacing spyware. Globally, the percentage of ICS computers on which denylisted internet resources were blocked has been increasing for two quarters in row and reached 4.31%.

The figures increased in all regions over the quarter, most notably in Russia (by 1.33 pp). Moreover, Russia ranked first (5.17%) among the regions in terms of denylisted internet resources. Since 2022, the region has topped these rankings twice before, both times in Q2: in 2022 and 2024.

Among the selected industries in Russia, the highest figures for the denylisted internet resources were in the electric power (6.61%) and engineering and ICS integration (5.62%) industries.

Malicious documents (MSOffice + PDF)

Malicious documents ranked fourth in the threat category rankings by the percentage of ICS computers on which they were blocked. The percentage for this category decreased over the previous three quarters, reaching its lowest level in three years. However, in Q2 2026, it increased to 1.77%.

Over the quarter, the figures for malicious documents increased in seven regions, most notably in South America (by 1.35 pp) and Southern Europe (by 0.48 pp). These two regions are among the top three in terms of malicious documents, malicious scripts and phishing pages, as well as threats from email clients.

South America ranked second in the rankings of regions in terms of malicious documents. In Q2 2026, the percentage of ICS computers in the region on which this threat was blocked was 3.56%, which was the fourth highest in three years.

Among the selected industries in South America, the highest percentage of ICS computers on which malicious documents were blocked was in biometrics (6.67%).

Southern Europe ranked first in the rankings of regions in terms of malicious documents. In the previous quarter, the percentage of ICS computers in the region on which this threat was blocked was the lowest in three years, but in Q2 2026 it increased to 3.63%.

Among the selected industries in Southern Europe, the highest percentage of ICS computers on which malicious documents were blocked was once again in biometrics (11.48%).

Spyware

Spyware ranked third in the threat category rankings based on the percentage of ICS computers on which it was blocked. The percentage for this category (3.30%) is the lowest since 2022.

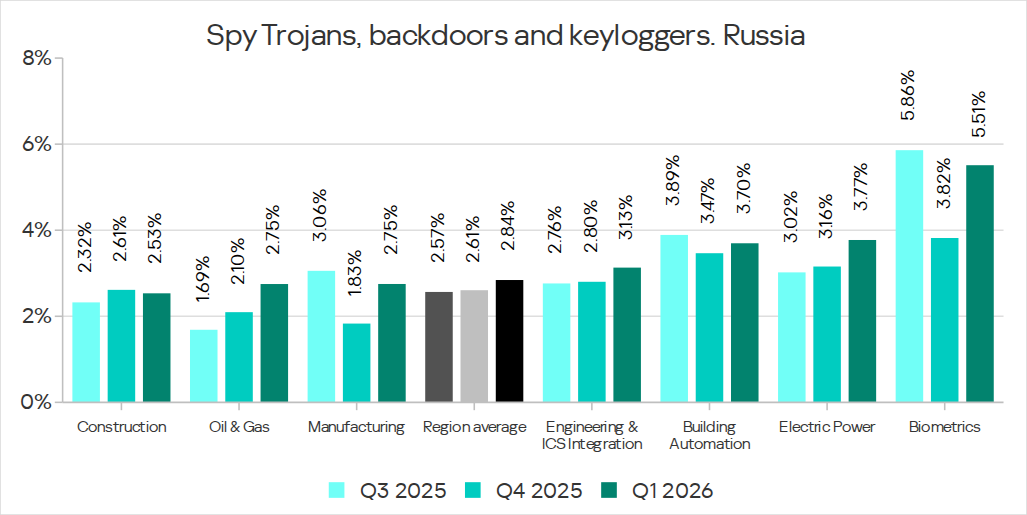
Over the quarter, the figures increased in three regions, most notably in East Asia (by 0.53 pp) and Southeast Asia (by 0.42 pp).

East Asia ranked third based on the figures for spyware (4.77%), behind Africa and Southeast Asia. This is the region’s highest rate since Q2 2025. Among the countries and territories in the region, the highest percentage of ICS computers on which spyware was blocked was in mainland China (6.61%). Among the selected industries in East Asia, the highest figures for spyware were in the electric power (11.75%) and manufacturing (5.87%) industries. In all the industries surveyed, the figures are higher than the regional average.

Southeast Asia ranked second after Africa in the ranking of regions in terms of spyware, with 5.32%. Among the selected industries in Southeast Asia, the highest figures for spyware were in biometrics (8.93%) and manufacturing (7.32%). The figures increased in all industries over the quarter.

Ransomware

The percentage of ICS computers on which ransomware was blocked decreased in the previous three quarters but increased to 0.16% in Q2 2026.

During the quarter, the percentage increased in all regions, except Western and Southern Europe and North America (Canada). Africa led the ranking in terms of growth for this metric.

In Q2 2026, Africa ranked first among the regions in terms of the percentage of ICS computers on which ransomware was blocked (0.29%). The only time the figure in the region was higher in the past three years was Q2 2025 (0.31%).

Among the selected industries in Africa, the highest figures for ransomware were in the electric power industry (0.72%) and biometrics (0.52%). Over the quarter, the figures increased in all industries, except manufacturing and construction. The biggest increase was recorded in the electric power industry.

In Russia, the percentage of ICS computers on which ransomware was blocked in biometric systems has increased for three consecutive quarters, reaching 1.22%. This is the highest level of ransomware across all industries in all regions.

Miners

In Q2 2026, the percentage of ICS computers on which miners were blocked was the lowest since 2021, for both miners in the form of executable files for Windows (0.48%) and web miners running in browsers (0.14%).

The figures for both categories decreased in all regions, except for Africa where figures for miners in the form of executable files for Windows increased slightly.

On average, the oil and gas industry led the rankings among the selected industries both in terms of miners in the form of executable files for the Windows OS (0.66%) and in terms of web miners (0.34%).

Worms

In Q2 2026, the percentage of ICS computers on which worms were blocked increased to 1.43%.

In Q2 2026, the Middle East (2.11%) was second (after Africa) in the rankings of regions in terms of worms, displacing Central Asia and the South Caucasus.

Among the selected industries in the Middle East, the highest percentage of ICS computers on which worms were blocked was in building automation (2.90%). Over the quarter, the figures increased in all industries.

Australia and New Zealand ranked 12th among the regions in terms of the percentage of ICS computers on which worms were blocked (0.41%). Over the past three years, the figure in this region was only higher in Q2 2024 (0.42%). The figures increased in all the surveyed industries in the region, most notably in manufacturing and electric power. As a result, for these industries they exceeded the regional average by 2.9 and 2.3 times, respectively.

Viruses

In Q2 2026, the percentage of ICS computers on which viruses were blocked decreased to 1.29%.

The top three regions for this metric remain unchanged: Southeast Asia (6.03%), Africa (4.22%), and East Asia (3.14%). These same regions lead the rankings in terms of malware for AutoCAD.

The figures increased in three regions: East Asia, Australia and New Zealand, and Africa, where it has been growing for four consecutive quarters and reached its highest value since 2022.

Among the selected industries in Africa, the highest percentage of ICS computers on which viruses were blocked was in construction (5.47%).

East Asia ranked third among the regions in terms of viruses, reaching the highest level in the region for the past three years. Among the countries and administrative regions of East Asia, mainland China is the clear leader in terms of viruses (5.07%).

Among the selected industries in East Asia, the highest percentage of ICS computers on which viruses were blocked was in construction (5.93%).

In Australia and New Zealand, the increase in the percentage of ICS computers on which viruses were blocked was primarily due to a 4.3-fold increase in the figure for the electric power industry: from 0.29% to 1.24%. For a region where the percentage of attacked ICS computers for all threats is 0.12%, this is a very high value.

Malware for AutoCAD

In Q2 2026, the percentage of ICS computers on which malware for AutoCAD was blocked increased to 0.31%.

The most notable increase over the quarter was observed in Africa. After more than doubling in the previous quarter, the figure for the region continued to rise (although not so dramatically), reaching 1.02%.

Among the selected industries across all regions, the highest percentage of ICS computers on which malware for AutoCAD was blocked was in construction in East Asia (6.38%) and in Southeast Asia (4.05%).

Main threat sources

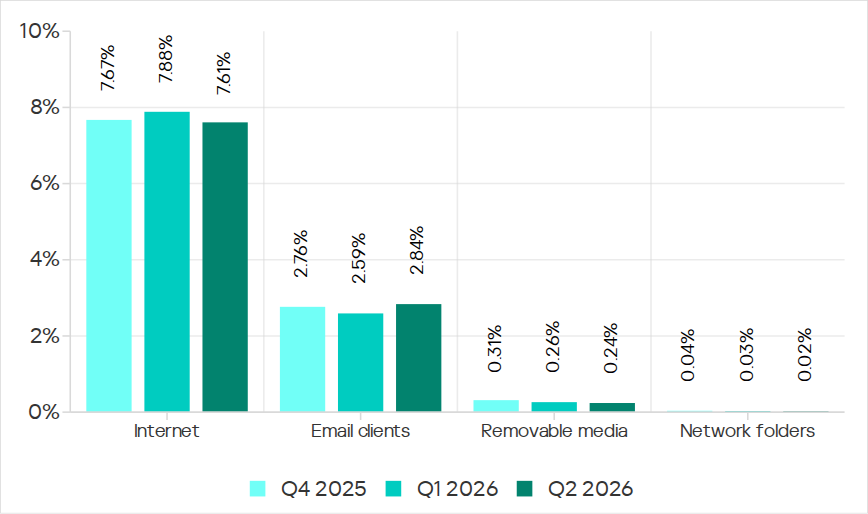
In Q2 2026, of all the threat sources, the percentage increased only for email.

Percentage of ICS computers on which malicious objects from various sources were blocked

Percentage of ICS computers on which malicious objects from various sources were blocked

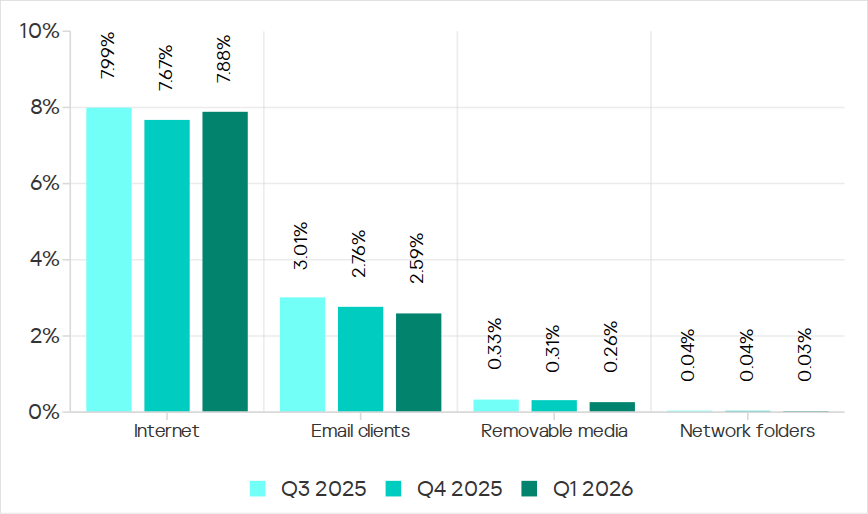
Internet

The percentage of ICS computers on which threats from the internet were blocked decreased to 7.61%, reaching its lowest level since 2021.

Over the quarter, the percentage increased in three regions: East Asia by 0.8 pp (to 6.3%), South Asia by 0.3 pp (to 10.4%), and Russia by 0.3 pp (to 6.4%).

Among the selected industries across all regions, the highest percentage of ICS computers on which threats from the internet were blocked was in biometrics (13.03%) and engineering and ICS integration (12.16%) in South Asia.

Email

The percentage of ICS computers on which email threats were blocked increased to 2.84%.

In Q2 2026, the percentage of ICS computers on which email threats were blocked increased in South America by 1.0 pp (to 5.2%) and in Africa by 0.7 pp (to 4.3%).

Among the selected industries across all regions, the highest percentage of ICS computers on which email threats were blocked was in biometrics (19.14%) and building automation (12.49%) in Southern Europe.

Removable media

The percentage of ICS computers on which threats from removable media were blocked continued to decrease, reaching 0.24%, the lowest value for the period under review.

Among the selected industries across all regions, the highest percentage of ICS computers on which threats from removable media were blocked was in the electric power industry in East Asia (1.34%) and biometrics in Africa (1.29%).

Network folders

The percentage of ICS computers on which threats from network folders were blocked continued to decrease. In Q2 2026, it was the lowest for the period under review, at 0.023%.

The only region to see an increase in the percentage of ICS computers on which threats from network folders were blocked during the quarter was Africa. This was mainly due to an increase in the building automation figure to 0.05%.

Among the selected industries across all regions, the highest percentage of ICS computers on which threats from network folders were blocked was in biometrics (0.23%), building automation (0.17%), and engineering and ICS integration (0.13%) in East Asia.

For more information on industrial threats see the full version of the report.

Exploits and vulnerabilities in Q2 2026

26 August 2026 at 06:00

The vulnerability landscape shifted significantly in Q2 2026. First, the number of registered CVEs reached an unprecedented level. This is driven primarily by the widespread adoption of AI, both for application development and search for security flaws. This resulted in entire new classes of vulnerabilities emerging, particularly in the Linux networking subsystem.

Second, security researchers have been publishing exploits for unpatched vulnerabilities more frequently. Publications like these can generate significant fallout, since they potentially open the door for attackers to target unprotected systems.

Statistics on registered vulnerabilities

This section provides statistical data on registered vulnerabilities. The data comes from Kaspersky’s vulnerability knowledge base, which draws on the CVE database as well as the Russian BDU database and GitHub Advisory (GHSA). As a result, the figures for previous reporting periods may differ from those published in earlier reports.

We examine the number of registered vulnerabilities for each month over the last five years. As the chart below shows, this number continues to surge, a trend reflected across all the databases we track. It’s driven primarily by the widespread adoption of AI tools: as we predicted in our previous report, these tools have played a major role in the discovery of vulnerabilities in third-party software. Meanwhile, these tools often contain security issues of their own. For example, OpenClaw, a popular AI project, ranked 12th among those with the highest number of vulnerabilities discovered and published in Q2, with over 200 CVEs registered during the reporting period. Finally, AI development tools are also contributing to the vulnerability landscape, since the quality of the code they produce can vary widely. Therefore, the rate at which new vulnerabilities are discovered will inevitably keep growing.

Total published vulnerabilities per month from 2022 through 2026 (download)

Next, we analyze the number of new critical vulnerabilities (CVSS > 9.0) over the same period.

Total critical vulnerabilities published per month from 2022 through 2026 (download)

As the chart shows, the number of published critical vulnerabilities jumped sharply in Q2. This is because using AI for vulnerability research makes it possible to analyze massive amounts of previously unexamined code, uncover new attack surfaces, and identify entire classes of vulnerabilities that have gone unnoticed for decades. In particular, AI was used to find a series of Dirty Frag vulnerabilities in the Linux kernel.

Exploitation statistics

This section presents statistics on vulnerability exploitation for Q2 2026. The data draws on open sources and our telemetry.

Windows and Linux vulnerability exploitation

Q2 2026 saw a new precedent in the publication of vulnerabilities in Windows components and exploits for these: researchers no longer waiting for CVE registration, let alone patches. A case in point: a researcher who goes by Nightmare Eclipse (also known as Chaotic Eclipse) published a list of new “named” vulnerabilities across various Windows subsystems. At the time the technical details were published, none of the vulnerabilities had been assigned a CVE identifier:

  • BlueHammer: a local privilege escalation vulnerability in Windows Defender. During signature database updates, a time-of-check to time-of-use (TOCTOU) race condition occurs, allowing an attacker to substitute the directory where temporary update files are written. The researcher published a fully functional exploit for the vulnerability.
  • RedSun: another logical vulnerability in Windows Defender with a working exploit. Suspicious and malicious files marked as “cloud” can be overwritten or restored to their original directory with elevated privileges. The exploit incorporates fragments of algorithms that make it possible to leverage various logical vulnerabilities in Windows, effectively combining a large number of popular exploitation techniques.
  • YellowKey: a vulnerability that lets the user bypass BitLocker full-disk encryption and access system data through the Windows Recovery Environment (WinRE). A fully functional exploit was also published.
  • GreenPlasma: a vulnerability that enables system object injection via the CTF loader for the Collaborative Translation Framework (CTFMON) service in Windows. The original publication included an exploit with limited functionality.
  • RoguePlanet: yet another Windows Defender vulnerability that, like BlueHammer, stems from a TOCTOU issue, this time in the engine responsible for real-time system scanning. The published exploit uses the vulnerability to overwrite the system file wermgr.exe with a malicious one.
  • UnDefend: another vulnerability in the Windows Defender service. This time, the exploit causes a denial of service and blocks updates.

Even though such cases remain isolated for now, we believe they’ll grow into a full-fledged trend. Early publication of exploits gives attackers an advantage over software developers, who are left with no time to fix the issues.

Veteran vulnerabilities in Windows software also remain relevant. These are the ones our solutions most frequently detect exploits for:

  • CVE-2018-0802: a remote code execution (RCE) vulnerability in the Equation Editor component
  • CVE-2017-11882: another RCE vulnerability also affecting Equation Editor
  • CVE-2017-0199: a vulnerability in Microsoft Office and WordPad that allows an attacker to gain control over the system
  • CVE-2023-38831: a vulnerability in WinRAR that involves improper handling of objects within an archive
  • CVE-2025-6218 (formerly ZDI-CAN-27198): another WinRAR vulnerability allowing the specification of relative paths to extract files into arbitrary directories, potentially leading to malicious command execution
  • CVE-2025-8088: a vulnerability similar in exploitation method to CVE-2025-6218. The attackers used NTFS Streams to circumvent controls on the directory into which files are being unpacked

The vulnerabilities listed here can be leveraged to gain initial access to a vulnerable system and for privilege escalation. This underscores the critical importance of timely software updates.

That said, the number of Windows users who encountered exploits declined slightly in Q2, hitting an 18-month low.

Dynamics of the number of Windows users encountering exploits, Q1 2025 – Q2 2026. The number of users who encountered exploits in Q1 2025 is taken as 100% (download)

Linux also hit a rough patch in Q2 2026. Specifically, the period saw the disclosure of the Dirty Frag family of vulnerabilities, which lets an attacker reliably escalate privileges within the operating system.

All the vulnerabilities published in Q2 2026 were, in one way or another, related to the Linux caching subsystem. Here are the ones being most actively exploited:

  • CVE-2026-31431 (Copy Fail): a local privilege escalation vulnerability in the Linux kernel that lets an unprivileged user modify the page cache and gain root privileges. Especially dangerous for cloud and containerized environments
  • CVE-2026-43284, CVE-2026-43500 (Dirty Frag): a family of vulnerabilities in the Linux networking subsystem (IPsec ESP and RxRPC) that lets a local user overwrite the page cache and escalate privileges to root
  • CVE-2026-46300 (Fragnesia): a local privilege escalation vulnerability in the Linux kernel related to packet fragment handling and the page cache mechanism. It lets an unprivileged user gain root privileges and is also classified as part of the Dirty Frag family
  • CVE-2026-31635 (DirtyDecrypt): a Linux kernel vulnerability that lets a local attacker escalate privileges due to improper handling of decryption operations and page cache data modification
  • CVE-2026-43494 (PinTheft): a Linux kernel vulnerability that lets a local user gain elevated privileges due to errors in the memory page pinning mechanism
  • CVE-2026-46331 (pedit COW): a vulnerability in the Linux kernel’s traffic control subsystem (tc-pedit) that exploits a flaw in copy-on-write to modify the page cache and subsequently escalate privileges to root

The vulnerabilities described above were quickly embraced by attackers. At the same time, our solutions continue to detect exploitation attempts targeting older vulnerabilities as well:

  • CVE-2022-0847: a vulnerability known as Dirty Pipe, which enables privilege escalation and the hijacking of running applications
  • CVE-2019-13272: a vulnerability caused by improper handling of privilege inheritance, which can be exploited to achieve privilege escalation
  • CVE-2021-22555: a heap out-of-bounds write vulnerability in the Netfilter kernel subsystem
  • CVE-2023-32233: another Netfilter subsystem vulnerability that allows for Use-After-Free conditions and privilege escalation through improper processing of network requests

Dynamics of the number of Linux users encountering exploits, Q1 2025 – Q2 2026. The number of users who encountered exploits in Q1 2025 is taken as 100% (download)

In Q2 2026, the number of Linux users who encountered exploits declined slightly compared to Q1. Given that a significant share of new vulnerabilities are tied to the operating system’s caching subsystem, we recommend installing patches as quickly as possible, or disabling vulnerable kernel modules if patching isn’t an option.

Most common published exploits

The distribution of published exploits by software type in Q2 2026 includes categories that haven’t appeared in the sample for a long time. For instance, we’re once again seeing exploits targeting SharePoint. It’s worth noting that while several vulnerability write-ups for Exchange and SharePoint were published during the quarter, most turned out to be fake, AI-generated research. While the articles and exploit source code themselves look fairly polished, they describe nonexistent problems in the software or its components — often close to genuinely vulnerable mechanisms — in order to mislead researchers. This type of attack is aimed at increasing the time it takes to detect real vulnerabilities. In some cases, the description of a nonexistent vulnerability came bundled with completely unrelated malware.

Distribution of published exploits by platform, Q1 2026 (download)

Distribution of published exploits by platform, Q2 2026 (download)

Vulnerability exploitation in APT attacks

We analyzed which vulnerabilities were exploited in APT attacks during Q2 2026. The rankings provided below include data based on our telemetry, research, and open sources.

TOP 10 vulnerabilities exploited in APT attacks, Q2 2026 (download)

In Q2 2026, a trend emerged in APT attacks toward exploiting new vulnerabilities right from the moment they’re published. As before, we’re also seeing a large number of zero-day vulnerabilities. The Langflow vulnerability deserves particular attention: it’s one of the first cases of an APT group exploiting AI technology, which many organizations are only just beginning to integrate. Because most of this tech is proprietary, it has a considerable number of security blind spots. Therefore, given the growing number of AI-based automation tools, we strongly recommend going beyond the usual patching and developing secure procedures for credential use and sensitive data handling in systems that rely on agents and LLMs.

C2 frameworks

In this section, we examine the most popular C2 frameworks used by APT groups and analyze the vulnerabilities targeted by the exploits that interacted with C2 agents in APT attacks.

The chart below shows the frequency of known C2 framework usage in attacks during Q2 2026, according to open sources.

TOP 10 C2 frameworks used by APTs to compromise user systems, Q2 2026 (download)

Sliver, Havoc, AdaptixC2, and Metasploit remain the most widely used C2 frameworks. After studying open sources and analyzing samples of malicious C2 agents that contained exploits, we determined that the following vulnerabilities were utilized in APT attacks involving the C2 frameworks mentioned above:

  • CVE-2026-35273: a vulnerability in Oracle PeopleSoft PeopleTools that security vendors classify as server-side request forgery (SSRF). The details of the vulnerability have never been disclosed, although some research covers the post-exploitation steps
  • CVE-2023-46604: an insecure deserialization vulnerability in Apache ActiveMQ that allows arbitrary code execution in the context of the service process
  • CVE-2024-12356 and CVE-2026-1731: command injection vulnerabilities in BeyondTrust software that allow an attacker to send malicious commands even without system authentication
  • CVE-2023-36884: a vulnerability in the Windows Search component that allows commands to be run on the system, bypassing the mark-of-the-web (MoTW) mechanism
  • CVE-2025-53770: an insecure deserialization vulnerability in Microsoft SharePoint that allows for unauthenticated command execution on the server
  • CVE-2025-8088 and CVE-2025-6218: similar directory traversal vulnerabilities in WinRAR that allow files to be extracted from an archive to a predetermined path, potentially without the archiving utility displaying any alerts to the user

These vulnerabilities show that attackers used them for initial access and privilege escalation on vulnerable systems, setting the stage for launching a C2 agent. They include both zero-day vulnerabilities and fairly well-known security issues.

LLM/AI tool vulnerabilities

This section analyzes data published in Kaspersky’s vulnerability knowledge base. We reviewed the Q2 2026 version of the knowledge base.

As mentioned above, AI tools, plugins, and technologies have proven fairly effective at automating the search for problematic code and anomalous behavior. The high speed at which new vulnerabilities are being discovered has naturally created a need to fix them just as quickly. AI is often used for this too, which increases the volume of code being generated. However, neither code written without human involvement nor AI-generated advice is always correct.

The chart below covers registered vulnerabilities in AI tools for 2025–2026.

Number of published vulnerabilities in LLMs, AI tools, and plugins with similar functionality, 2025–2026 (download)

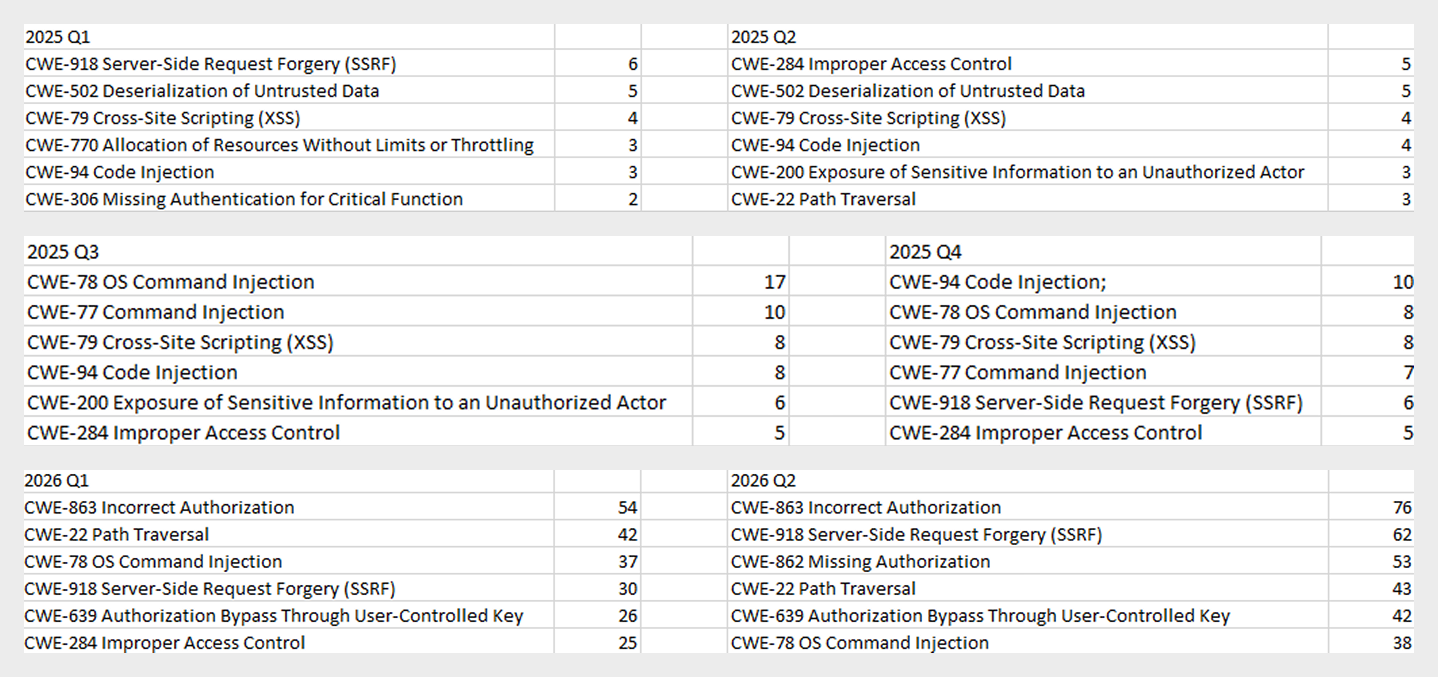
As the charts show, AI tools are racking up a substantial number of registered vulnerabilities, and that number keeps growing quarter over quarter. It’s also worth looking at how AI tool vulnerabilities break down by type, according to the CWE system:

TOP 6 vulnerability types in products that implement or use AI/LLM logic, 2025–2026

TOP 6 vulnerability types in products that implement or use AI/LLM logic, 2025–2026

Interestingly, vulnerabilities of an undetermined type have ranked first in every quarter since the start of 2025. Traditionally-made software has the same issue, and it doesn’t look like the growing number of AI tools will fix it. It’s also notable that the list includes classes CWE developers themselves don’t recommend using for vulnerability classification, since they lump together a whole range of more specific types. CWE-284 is an example of this.

Looking at the most common classes, the key issues found in AI-related software can be summed up as follows:

  • Inadequate access control over critical system objects
  • Improper implementation of authentication and authorization mechanisms
  • Injections

It’s worth noting that injection-related vulnerabilities were relatively rare before AI agents took off (previously, they mostly affected web apps). Recently, though, these security issues have become relevant again.

Looking back at a year and a half of the AI boom, one conclusion stands out regarding registered vulnerabilities: AI tool developers are more focused on expanding functionality than on security. This is worth keeping in mind when using these tools. Let’s look at the projects and applications that either integrated AI tools or offered them as the core product. Below is a list of the those with the highest number of registered vulnerabilities for 2025–2026.

TOP AI/LLM-related projects by number of published vulnerabilities, 2025–2026 (download)

Notable vulnerabilities

This section highlights the most significant vulnerabilities published in Q2 2026 that have publicly available descriptions. Since the above already covers several significant vulnerabilities published during the reporting period, this section consists mainly of LLM/AI tool vulnerabilities.

CVE-2026-25253: a gatewayUrl vulnerability in OpenClaw

The issue stems from the fact that the OpenClaw user interface trusts the value of the gatewayUrl parameter passed in the URL and automatically establishes a WebSocket connection to the specified address. During this connection process, it sends an authentication token without any additional user confirmation.

The attack algorithm exploiting this vulnerability works as follows:

  1. The application obtains a critical connection address from an external source (the gatewayUrl URL parameter), which is controlled by the attacker.
  2. There is no validation before use.
  3. The client automatically initiates a connection to the address specified in the parameter, which belongs to the attacker.
  4. While connected, the application sends credentials (an access token) to the specified address.

If the attacker obtains a valid token, the consequences depend on that token’s level of access within the system. In general, this could lead to:

  • User session compromise
  • Execution of operations on the user’s behalf
  • Modification of the AI agent configuration
  • Unauthorized access to tools and resources connected to the agent
  • Under certain OpenClaw configurations, further compromise of the host running the agent

It’s worth noting that the risk of exploitation arises from a combination of several factors: the automatic connection and token transmission, the lack of address trust verification, and the high privileges granted to the local AI agent.

CVE-2026-41948: a path traversal vulnerability in the Dify AI platform

The vulnerability lets an authenticated user craft a request that enables the application to escape its permitted tenant and gain access to internal REST APIs that weren’t meant for that user. The root cause is insufficient normalization and validation of the URL path before it’s passed to the internal service.

Depending on the Dify configuration, the consequences can include:

  • Unauthorized access to internal service interfaces
  • Breach of isolation between workspaces
  • Exposure of internal service information
  • Conditions favorable to further attacks when combined with other vulnerabilities

The use of Dify in enterprise AI platforms is particularly risky, since internal services there tend to hold elevated privileges.

CVE-2026-45386: an improper access control vulnerability in Open WebUI

In Open WebUI, pin/unpin operations on messages are write operations, since they modify that message’s metadata (is_pinned, pinned_by, pinned_at). In vulnerable versions, however, before performing these actions, the API only checked for read access to the channel (a chat between a user or group and the AI) containing the message, not permission to modify its content. As a result, a user with a role limited to viewing messages could still change a message’s pinned status.

The vulnerability’s mechanism works as follows:

  1. The user initiates an action that changes the state of an object.
  2. The application treats this action as a regular read request.
  3. Only channel view permission is checked.
  4. The application performs a write without verifying the required user authorization.

This violates one of the fundamental principles of access control models — namely, that any operation that changes the state of data must be checked for the appropriate write or moderation permissions, regardless of whether the object itself is readable.

Although the vulnerability doesn’t lead to arbitrary code execution or compromise of sensitive data, it can affect data integrity and collaborative workflows. Potential consequences of exploitation include unauthorized pinning or unpinning of messages, disruption of channel moderators’ and administrators’ activities, changes to the display order of important information, and even the potential spread of false or misleading information by altering the channel containing a pinned message.

Open WebUI is widely used as an interface for interacting with local and enterprise LLMs. In these systems, pinned messages often contain important instructions, announcements, or tips for users. The ability to modify them with minimal privileges can disrupt collaborative workflows, cause confusion, and undermine trust in information published by administrators and moderators.

CVE-2026-45501: a vulnerability in Microsoft Exchange

The vulnerability stems from improper neutralization of user input when generating Exchange web pages. As a result, the browser may interpret specially crafted data as active content instead of plain text.

Although Microsoft categorizes the potential impact of exploiting this vulnerability as spoofing, flaws like this can lead to alteration of displayed content, imitation of trusted interfaces, actions on behalf of the user within an active session, and abuse of user trust.

It’s worth noting that issues like this are still relevant in modern software, given that mechanisms like Content Security Policy and various parsers were specifically created to help developers neutralize dangerous parts of user page content.

Conclusion and advice

Q2 brought the first significant results of AI automation adoption in software development and vulnerability hunting tools. This research shows that beyond traditional patch management, organizations now need real-time monitoring of systems and access controls, since infrastructure and everyday applications now contain far more AI functionality that could lead to compromise.

Accordingly, besides quickly detecting infrastructure vulnerabilities and managing security patches, modern enterprise-grade security solutions need to provide a broad range of preventive measures for tracking the overall health of systems and workstations. Kaspersky Next meets these requirements by combining proactive mechanisms with the ability to respond promptly to emerging threats.

IT threat evolution in Q2 2026. Non-mobile statistics

By: AMR
10 August 2026 at 06:00

IT threat evolution in Q2 2026. Non-mobile statistics
IT threat evolution in Q2 2026. Mobile statistics

The statistics in this report are based on detection verdicts returned by Kaspersky products unless otherwise stated. The information was provided by Kaspersky users who consented to sharing statistical data.

Quarterly figures

In Q2 2026:

  • Kaspersky products blocked nearly 400 million attacks that originated with various online resources.
  • Web Anti-Virus responded to 52 million unique links.
  • File Anti-Virus blocked more than 16 million malicious and potentially unwanted objects.
  • There were 2538 new ransomware variants discovered.
  • More than 71,000 users experienced ransomware attacks.
  • 15% of all ransomware victims whose data was published on threat actors’ data leak sites (DLS) were attacked by Qilin.
  • More than 213,000 users were targeted by miners.

Ransomware

Quarterly trends and highlights

Threat actor disruption

Microsoft has dismantled an illicit malware-signing service used by ransomware operators. Microsoft’s Digital Crimes Unit has shut down a malware-signing-as-a-service (MSaaS) operation run by the threat group Fox Tempest. The illicit service abused the Microsoft Artifact Signing platform to generate digital signature certificates for malicious software. Malware signed by these certificates was observed in campaigns conducted by such ransomware groups as Rhysida, Akira, INC, Qilin, and BlackByte. The service was also leveraged by operators of the Oyster loader as well as the Lumma and Vidar infostealers. To disrupt the operation, Microsoft seized the domain used by the MSaaS platform, revoked all associated certificates, and disabled the related accounts. Additionally, the company filed a lawsuit against Fox Tempest.

Vulnerabilities and attacks

CISA has confirmed that a Windows vulnerability known as BlueHammer is actively being exploited in ransomware attacks. On April 22, the agency updated its Known Exploited Vulnerabilities (KEV) catalog to note the ongoing ransomware exploitation of CVE-2026-33825. The local privilege escalation flaw in Microsoft Defender was originally disclosed earlier in April. Although Microsoft released a fix on April 14, unpatched systems remain vulnerable. CISA did not disclose further details or attribute the attacks to specific threat groups.

Check Point has linked zero-day exploitation of CVE-2026-50751 to the Qilin ransomware group. The critical vulnerability affects Check Point Remote Access VPN and Mobile Access. Attackers began exploiting the flaw as a zero-day on May 7, with activity spiking sharply in early June. While several dozen organizations have been targeted, at least one incident has been definitively tied to Qilin. Check Point also disclosed a related certificate validation flaw (CVE-2026-50752) that affects site-to-site VPN connections relying on the legacy IKEv1 key exchange protocol.

Researchers assess with high confidence that the PayoutsKing group is leveraging the legitimate QEMU emulator to deploy hidden, Alpine Linux-based virtual machines on compromised hosts. Because security solutions often lack visibility inside virtualized environments, the threat actors use this technique to evade detection. Inside the VM image, the operators deploy various tools — such as credential theft software — and configure the virtual machine as a backdoor managed via a reverse SSH tunnel to their command-and-control infrastructure. While the technique is not new, and we’ve detailed it before, it remains relatively rare in ransomware attacks.

The most prolific groups

This section highlights the most prolific ransomware gangs by number of victims added to each group’s DLS. Qilin reclaimed the top spot (accounting for 14.57% of total listings) after placing second last quarter. It is followed by the Akira ransomware (7.80%) and the DragonForce RaaS group (6.88%).

Number of each group’s victims according to its DLS as a percentage of all groups’ victims published on all the DLSs under review during the reporting period (download)

Number of new ransomware variants

In Q2, Kaspersky solutions detected four new ransomware families and 2538 new modifications. This signals a continued stabilization following spikes seen in Q1 and Q4 of last year.

Number of new ransomware modifications, Q2 2025 — Q2 2026 (download)

Number of users attacked by ransomware Trojans

Our solutions protected a total of 71,860 unique users from ransomware during Q2. Ransomware activity peaked in April, with 31,206 targeted users recorded during that month.

Number of unique users attacked by ransomware Trojans, Q2 2026 (download)

TOP 10 countries and territories attacked by ransomware Trojans

Country/territory* %**
1 South Korea 0.87
2 Pakistan 0.76
3 China 0.71
4 Libya 0.49
5 Tajikistan 0.46
6 Turkmenistan 0.38
7 Cameroon 0.38
8 Indonesia 0.36
9 Bangladesh 0.36
10 Mozambique 0.34

* Excluded are countries and territories with relatively few (under 50,000) Kaspersky users.
** Unique users whose computers were attacked by ransomware Trojans as a percentage of all unique users of Kaspersky products in the country/territory.

TOP 10 most common families of ransomware Trojans

Name Verdict %*
1 (generic verdict) Trojan-Ransom.Win32.Gen 28.02
2 WannaCry Trojan-Ransom.Win32.Wanna 7.14
3 (generic verdict) Trojan-Ransom.Win32.Crypren 6.27
4 (generic verdict) Trojan-Ransom.Win32.Agent 4.89
5 (generic verdict) Trojan-Ransom.Win32.Encoder 4.65
6 (generic verdict) Trojan-Ransom.Python.Agent 3.07
7 (generic verdict) Trojan-Ransom.Win32.Crypmod 2.70
8 (generic verdict) Trojan-Ransom.MSIL.Agent 2.45
9 PolyRansom/VirLock Virus.Win32.PolyRansom / Trojan-Ransom.Win32.PolyRansom 2.31
10 (generic verdict) Trojan-Ransom.Win32.Phny 2.12

* Unique Kaspersky users attacked by the specific ransomware Trojan family as a percentage of all unique users attacked by this type of threat.

Miners

Number of new miner variants

In Q2 2026, Kaspersky solutions detected 6067 new miner variants, almost twice the number for the previous reporting period.

Number of new miner modifications, Q2 2026 (download)

Number of users attacked by miners

In Q2, we detected attacks using miner programs on the computers of 213,003 unique Kaspersky users worldwide.

Number of unique users attacked by miners, Q2 2026 (download)

TOP 10 countries and territories attacked by miners

Country/territory* %**
1 Mali 1.56
2 Senegal 1.54
3 Tanzania 1.32
4 Panama 1.04
5 Bangladesh 1.03
6 Ethiopia 0.87
7 Costa Rica 0.67
8 Bolivia 0.67
9 Côte d’Ivoire 0.65
10 Kazakhstan 0.62

* Excluded are countries and territories with relatively few (under 50,000) Kaspersky users.
** Unique users whose computers were attacked by miners as a percentage of all unique users of Kaspersky products in the country/territory.

Attacks on macOS

Quarterly highlights

In April, Aikido researchers reported a new attack by the GlassWorm stealer, which was distributed via malicious IDE extensions on the Open VSX Registry. The payload operated by installing a secondary malicious extension across all installed IDE environments on the host machine. Ultimately, this second-stage implant exfiltrated crypto wallet data, environment variables, and other secrets. It also installed a RAT on the infected device.

In May, Socket researchers uncovered a supply chain compromise involving the popular npm package art-template. As a result of the breach, the weaponized package injected the Coruna exploit kit into web applications it was used to build. Coruna targets iOS devices.

In June, Palo Alto Networks’ Unit 42 discovered FlutterShell, a new backdoor family that targets macOS devices. Developed with the Flutter framework, the malware leverages the WebView engine to load web pages that contain malicious JavaScript. On the client side, the backdoor registers bridge functions invoked by the loaded JavaScript that allow threat actors to execute arbitrary payloads on the victim’s device. Notably, the malicious applications successfully passed Apple notarization. Although the specific samples analyzed functioned primarily as adware, the underlying architecture permits the delivery of far more sophisticated malicious payloads.

TOP 20 threats to macOS

* Unique users who encountered this malware as a percentage of all attacked users of Kaspersky security solutions for macOS (download)

* Data for the previous quarter may differ slightly from previously published data due to some verdicts being retrospectively revised.

Detections of PasivRobber spyware continued their downward trend. Meanwhile, adware and traffic-routing utilities (categorized as NetTool) rose to the top of the rankings. Additionally, Q2 saw a noticeable spike in detections for the DirtyCow exploit frequently leveraged for iPhone jailbreaking.

TOP 10 countries and territories by share of attacked users

Country/territory %* Q1 2026 %* Q2 2026
Brazil 1.13 1.13
China 1.04 1.28
Hong Kong 0.92 0.49
Singapore 0.85 0.19
France 0.62 1.18
Mexico 0.43 0.72
India 0.41 0.42
Thailand 0.40 0.24
Germany 0.33 0.71
The Netherlands 0.31 0.62

* Unique users who encountered threats to macOS as a percentage of all unique Kaspersky users in the country/territory.

IoT threat statistics

This section presents statistics on attacks targeting Kaspersky IoT honeypots. The geographic data on attack sources is based on the IP addresses of attacking devices.

In Q2 2026, the breakdown of attacking devices and sessions that targeted Kaspersky honeypots by protocol was as follows:

Distribution of attacked services by number of unique IP addresses of attacking devices (download)

The share of SSH attacks saw a slight uptick compared to the previous quarter.

Distribution of cybercriminal sessions in Kaspersky honeypots (download)

TOP 10 threats delivered to IoT devices

Share of each threat delivered to an infected device as a result of a successful attack, out of the total number of threats delivered (download)

As is typically the case, Mirai botnet variants continue to dominate the IoT threat landscape. Activity of another prominent botnet, Prometei, also saw an increase.

Attacks on IoT honeypots

the Netherlands, Germany, and The United States accounted for the highest proportions of SSH-based attacks during this period. While the top three countries remained the same as last quarter, their relative rankings shifted.

Country/territory Q1 2026 Q2 2026
The Netherlands 17.57% 21.18%
Germany 10.34% 16.73%
United States 23.74% 6.76%
Bulgaria 1.10% 5.50%
Sweden 2.09% 4.93%
Panama 6.34% 4.67%
Luxembourg 0.16% 4.62%
Romania 5.82% 4.06%
Vietnam 3.50% 3.91%
India 6.05% 2.78%

The percentage of Telnet-based attacks originating from Pakistan continued to climb, knocking China down to second place.

Country/territory Q1 2026 Q2 2026
Pakistan 27.31% 36.60%
China 39.54% 35.62%
Russian Federation 8.25% 8.75%
India 4.66% 4.19%
Brazil 3.30% 3.34%
United States 0.45% 3.03%
Indonesia 6.71% 1.52%
Philippines 0.36% 0.95%
France 0.17% 0.84%
Thailand 0.55% 0.66%

Attacks via web resources

The statistics in this section are based on detection verdicts by Web Anti-Virus, which protects users when suspicious objects are downloaded from malicious or infected web pages. These malicious pages are purposefully created by cybercriminals. Websites that host user-generated content, such as message boards, as well as compromised legitimate sites, can become infected.

TOP 10 countries and territories that served as sources of web-based attacks

The following statistics show the distribution by country/territory of the sources of internet attacks blocked by Kaspersky products on user computers (web pages redirecting to exploits, sites containing exploits and other malware, botnet C&C centers, and so on). One or more web-based attacks could originate from each unique host.

To determine the geographic source of web attacks, we matched the domain name with the real IP address where the domain is hosted, then identified the geographic location of that IP address (GeoIP).

In Q2 2026, Kaspersky solutions blocked 399,312,961 attacks launched from internet resources worldwide. Web Anti-Virus was triggered by 52,850,592 unique URLs.

Web-based attacks by country/territory, Q1 2026 (download)

Countries and territories where users faced the greatest risk of online infection

To assess the risk of malware infection via the internet for users’ computers in different countries and territories, we calculated the share of Kaspersky users in each location on whose computers Web Anti-Virus was triggered during the reporting period. The resulting data provides an indication of the aggressiveness of the environment in which computers operate in different countries and territories.

This ranked list includes only attacks by malicious objects classified as Malware. Our calculations leave out Web Anti-Virus detections of potentially dangerous or unwanted programs, such as RiskTool or adware.

Country/territory* %**
1 Bangladesh 11.71
2 India 7.40
3 Tajikistan 7.13
4 Venezuela 7.05
5 New Zealand 6.58
6 Vietnam 6.34
7 Taiwan 6.28
8 Belgium 6.24
9 France 5.97
10 Hungary 5.92
11 Nepal 5.91
12 Portugal 5.86
13 Italy 5.77
14 Costa Rica 5.72
15 Canada 5.65
16 Qatar 5.61
17 Dominican Republic 5.52
18 Palestine 5.48
19 Greece 5.47
20 UAE 5.43

* Excluded are countries and territories with relatively few (under 10,000) Kaspersky product users.
** Unique users targeted by web-based Malware attacks as a percentage of all unique users of Kaspersky products in the country/territory.

On average during the quarter, 4.54% of users’ computers worldwide were subjected to at least one Malware web attack.

Local threats

Statistics on local infections of user computers are an important indicator. They include objects that penetrated the target computer by infecting files or removable media, or initially made their way onto the computer in non-open form. Examples of the latter are programs in complex installers and encrypted files.

Data in this section is based on analyzing statistics produced by anti-virus scans of files on the hard drive at the moment they were created or accessed, and the results of scanning removable storage media. The statistics are based on detection verdicts from the On-Access Scan (OAS) and On-Demand Scan (ODS) modules of File Anti-Virus and include detections of malicious programs located on user computers or removable media connected to the computers, such as flash drives, camera memory cards, phones, or external hard drives.

In Q2 2026, our File Anti-Virus detected 16,986,351 malicious and potentially unwanted objects.

Countries and territories where users faced the highest risk of local infection

For each country and territory, we calculated the percentage of Kaspersky users whose computers had the File Anti-Virus triggered at least once during the reporting period. These statistics reflect the level of personal computer infection in different countries.

Note that this ranked list includes only attacks by malicious objects classified as Malware. Our calculations leave out File Anti-Virus detections of potentially dangerous or unwanted programs, such as RiskTool or adware.

Country/territory* %**
1 Turkmenistan 46.38
2 Cuba 29.70
3 Tajikistan 28.46
4 Afghanistan 28.19
5 Yemen 27.85
6 Burundi 26.82
7 Mozambique 25.01
8 Republic of the Congo 24.88
9 Syria 23.17
10 Uzbekistan 22.49
11 China 21.92
12 Nicaragua 21.60
13 Cameroon 21.47
14 Bangladesh 20.43
15 Democratic Republic of the Congo 20.25
16 Algeria 19.78
17 Uganda 19.48
18 Ethiopia 18.57
19 Tanzania 18.54
20 Mali 18.53

* Excluded are countries and territories with relatively few (under 10,000) Kaspersky users.
** Unique users on whose computers Malware local threats were blocked, as a percentage of all unique users of Kaspersky products in the country/territory.

On average worldwide, Malware local threats were detected at least once on 10.93% of users’ computers during Q2.

Russia scored 10.78% in these rankings.

IT threat evolution in Q2 2026. Mobile statistics

10 August 2026 at 06:00

IT threat evolution in Q2 2026. Mobile statistics
IT threat evolution in Q2 2026. Non-mobile statistics

The mobile section of the quarterly cyberthreat report includes statistics on malware, adware, and potentially unwanted software for Android, as well as descriptions of the most notable threats for Android and iOS discovered during the reporting period. These statistics are based on detection alerts from Kaspersky products, collected from users who consented to provide statistical data to Kaspersky Security Network.

The quarter in figures

According to Kaspersky Security Network, in Q2 2026:

  • More than 1.99 million attacks on mobile devices utilizing malware, adware, or unwanted mobile software were blocked.
  • The Trojan-Banker category was the most prevalent mobile malware threat with a 30.77% share of total detected applications.
  • More than 304,000 malicious installation packages were discovered, including:
    • 93,574 packages were related to mobile banking Trojans;
    • 570 packages were related to mobile ransomware Trojans.

Quarterly highlights

Attacks on mobile devices involving malware, adware, or unwanted software continued their downward trend, falling to 1,996,823 in Q2 from 2,676,328 the previous quarter.

Attacks on users of Kaspersky mobile solutions, Q4 2024 — Q2 2026 (download)

We noted a downward trend in attacks driven by specific strains of pre-installed Trojans — a shift likely tied to the rollout of patched vendor firmware.

In Q2, our telemetry uncovered multiple malicious loaders hosted directly on Google Play. As highlighted in a prior report (link in Russian), one such instance involved a PDF reader app trojanized to drop the Anatsa banking malware. Upon execution, the app presented users with a fake request to install an update, which served as a front to stage the banking Trojan on the victim’s device.

Another notable case involves a loader we detected in the Cleanova app alongside several others. The malware sent requests to a command-and-control server containing telemetry gathered from various SDKs that track the installation source. A malicious payload was returned only for certain sources. This is a fairly interesting method for bypassing app store review processes while ensuring precise victim targeting. If an analytics SDK indicates that an arbitrary installation originated from a source outside the threat actors’ scope, the malicious logic remains dormant. This effectively hides the malware from app store scanners.

Mobile threat statistics

In Q2, the number of Android malware samples totaled 304,128. It remained steady compared to the previous reporting period.

Detected malicious and potentially unwanted installation packages, Q2 2025 — Q2 2026 (download)

The detected installation packages were distributed by type as follows:

Detected mobile apps by type, Q1 — Q2 2026* (download)

* Data for the previous quarter may differ slightly from previously published data due to certain verdicts being retrospectively revised.

While the number of newly discovered banking Trojan variants fell precipitously, they continued to dominate the threat landscape as they did in Q1. Notably, the share of Creduz malware family among identified banking samples has grown significantly despite low activity in victim telemetry. This discrepancy suggests the threat actors are actively iterating on the malware — likely testing new features or bypasses — by generating a high volume of builds before staging a broader campaign.

Share* of users attacked by the given type of malicious or potentially unwanted apps out of all targeted users of Kaspersky mobile products, Q1 — Q2 2026 (download)

* The total may exceed 100% if the same users experienced multiple attack types.

Within the adware category, the sharpest declines were observed in the HiddenAd and MobiDash families. Meanwhile, the proportion of users targeted by Trojan-Dropper malware increased, primarily driven by surges in banking droppers such as Trojan-Dropper.AndroidOS.Banker and Trojan-Dropper.AndroidOS.Mamont. The corresponding drop in the Trojan-Banker category is partially explained by a shift in tactics: several banking Trojans which are now being packed were subsequently reclassified as droppers.

TOP 20 most frequently detected types of mobile malware

Note that the malware rankings below exclude riskware or potentially unwanted software, such as RiskTool or adware.

Verdict %* Q1 2026 %* Q2 2026 Difference in p.p. Change in ranking
Backdoor.AndroidOS.Triada.ag 7.09 9.35 +2.25 0
DangerousObject.Multi.Generic. 5.84 5.65 -0.19 0
DangerousObject.AndroidOS.GenericML. 5.51 5.25 -0.26 0
Trojan.AndroidOS.Boogr.gsh 2.15 3.33 +1.18 +9
Backdoor.AndroidOS.Triada.z 3.08 3.23 +0.15 +3
Trojan-Banker.AndroidOS.Mamont.hl 1.10 2.48 +1.38 +22
Trojan.AndroidOS.Fakemoney.v 3.44 2.31 -1.13 -2
Trojan-Spy.AndroidOS.Btmob.e 0.00 2.27 +2.27
Trojan.AndroidOS.Triada.fe 2.98 2.18 -0.81 0
Trojan-Dropper.AndroidOS.Banker.dd 0.01 2.16 +2.15
Trojan.AndroidOS.Triada.hf 2.23 1.93 -0.29 +1
Backdoor.AndroidOS.Triada.ad 1.40 1.93 +0.53 +8
Backdoor.AndroidOS.Keenadu.a 2.73 1.88 -0.85 -3
Backdoor.AndroidOS.Triada.ab 1.72 1.79 +0.07 +2
Trojan-Banker.AndroidOS.Mamont.iv 1.03 1.63 +0.60 +16
Trojan.AndroidOS.Generic. 1.32 1.47 +0.15 +7
Backdoor.AndroidOS.Triada.ae 1.76 1.44 -0.31 -2
Trojan.AndroidOS.Fakemoney.ej 0.00 1.43 +1.43
Trojan.AndroidOS.Triada.ii 2.07 1.41 -0.66 -5
Trojan-Spy.AndroidOS.Agent.asa 0.02 1.38 +1.36

* Unique users who encountered this malware as a percentage of all attacked users of Kaspersky mobile solutions.

The distribution of top malware families in Q2 largely mirrors the rankings from the previous reporting period. Newer variants of the Mamont banking Trojan climbed the leaderboards, displacing older iterations. This shift points to ongoing, active development of new variants by the threat actors behind the malware.

Mobile banking Trojans

In Q2, the total volume of Trojan-Banker applications dropped sharply compared to the previous quarter, totaling 93,574 installation packages.

Number of installation packages for mobile banking Trojans detected by Kaspersky, Q2 2025 — Q2 2026 (download)

Against the backdrop of this trend, the distribution shifted heavily toward Creduz Trojans. However, as noted earlier, this shift was not reflected in real-world attack metrics: virtually the entire leaderboard by proportion of targeted users continues to be dominated by diverse Mamont variants.

TOP 10 mobile bankers

Verdict %* Q1 2026 %* Q2 2026 Difference in p.p. Change in ranking
Trojan-Banker.AndroidOS.Mamont.hl 3.27 11.13 +7.86 +6
Trojan-Banker.AndroidOS.Mamont.iv 3.08 7.33 +4.25 +6
Trojan-Banker.AndroidOS.Mamont.mv 0.00 5.12 +5.12
Trojan-Banker.AndroidOS.Agent.ws 3.78 4.99 +1.22 +2
Trojan-Banker.AndroidOS.Mamont.mg 0.35 4.71 +4.36 +62
Trojan-Banker.AndroidOS.Faketoken.pac 2.56 4.10 +1.54 +6
Trojan-Banker.AndroidOS.Mamont.jo 15.75 3.73 -12.02 -6
Trojan-Banker.AndroidOS.Mamont.mc 0.83 3.51 +2.67 +26
Trojan-Banker.AndroidOS.Mamont.lf 0.00 2.79 +2.79
Trojan-Banker.AndroidOS.Agent.eq 0.89 2.58 +1.69 +23

* Unique users who encountered this malware as a percentage of all users of Kaspersky mobile security solutions who encountered banking threats.

Threat landscape for industrial automation systems. Q1 2026

7 July 2026 at 06:00

All threats

The percentage of ICS computers on which malicious objects were blocked continued to decrease, reaching 19.6% in Q1 2026. This is the lowest value in three years, and it is 1.4 times lower than in Q2 2023.

Percentage of ICS computers on which malicious objects were blocked, Q2 2023–Q1 2026

Percentage of ICS computers on which malicious objects were blocked, Q2 2023–Q1 2026

Regionally, the percentages ranged from 9.1% in Northern Europe to 27.4% in Africa.

Regions ranked by percentage of attacked ICS computers

Regions ranked by percentage of attacked ICS computers

The percentage of ICS computers on which malicious objects were blocked increased in five regions over the quarter, most notably in Southern Europe, Northern Europe, and Russia.

In Q1 2026, Southern Europe led the way in growth for internet and email threats. The region also saw the fastest growth in spyware, as well as malicious scripts and phishing pages.

In Russia, the percentage of ICS computers on which malicious objects were blocked exceeded the figures for the previous two quarters. Russia saw an increase in the percentage for threats from the internet, and a slight increase in the figure for threats from email clients (Russia is one of three regions where this figure did not decrease).

Among the threat categories, the greatest increases were observed in the percentages for denylisted internet resources, as well as spyware (distributed in the region via the internet and email clients).

Selected industries

Biometric systems (26.4%) traditionally rank top among the industries and OT infrastructure types covered in this report in terms of the percentage of ICS computers on which malicious objects were blocked. These systems are characterized by internet access, extensive email use for data exchange and approvals (such as access granting), and, in many cases, minimal cybersecurity controls within the organizations that use these systems.

Industries ranked by the percentage of ICS computers on which malicious objects were blocked

Industries ranked by the percentage of ICS computers on which malicious objects were blocked

Biometric systems rank first among industries in terms of email threats. At the same time, unlike other industries, the percentage for email threats in biometric systems exceeds that for internet threats.

In all selected industries, the global average follows a downward trend. In Q1 2026, the percentage of ICS computers on which malicious objects were blocked increased only in the manufacturing sector — by 1.0 pp. The percentages for this industry increased across 10 regions, with the most notable increases in Western Europe, Northern Europe, and Russia.

Threat categories

In Q1 2026, Kaspersky security solutions blocked malware from 10,052 different malware families of various categories on industrial automation systems.

Over the quarter, the percentage of ICS computers on which denylisted internet resources were blocked increased (after decreasing over the previous two quarters), and there was a slight increase in the percentage for AutoCAD malware.

Percentage of ICS computers on which the activity of malicious objects from various categories was prevented

Percentage of ICS computers on which the activity of malicious objects from various categories was prevented

Malicious scripts and phishing pages (JS and HTML)

Malicious scripts and phishing pages retained their to spot among threat categories by the percentage of ICS computers on which these threats were blocked. The global average in Q1 2026 was 6.56%.

Over the quarter, the percentages increased in four regions. The most significant change was observed in Southern Europe (9.85%, +0.94 pp). The figures for malicious scripts in the region increased over three consecutive quarters.

Among the selected industries, across all regions, the highest percentages for the malicious scripts and phishing pages category were recorded for biometric systems (19.59%) and building automation (15.43%) in Southern Europe. These same industries lead in similar rankings for malicious documents and spyware.

Spyware

The percentage of ICS computers on which spyware was blocked decreased over two consecutive quarters, dropping to 3.73%. Despite the decline, spyware has ranked second among threat categories by the percentage of attacked computers for three consecutive quarters.

The percentages increased in five regions over the quarter, most notably in Southern Europe (5.46%, +0.35 pp) and Russia (2.84%, +0.24 pp).

In Southern Europe, the percentage of ICS computers on which spyware was blocked increased in all the selected industries except manufacturing. The greatest increase was observed in biometric systems.

Among the selected industries, the highest percentage of spyware in Russia was recorded in biometric systems. That said, the percentage of ICS computers on which spyware was blocked increased in all industries in the region except construction. The percentage figure has been increasing for two consecutive quarters in the oil and gas industry (by a factor of 1.63 over six months), and for three consecutive quarters in engineering and ICS integration, as well as electric power. In the remaining sectors, the values have been fluctuating.

Percentage of ICS computers on which spyware was blocked in various industries in Russia, Q3 2025–Q1 2026

Percentage of ICS computers on which spyware was blocked in various industries in Russia, Q3 2025–Q1 2026

Denylisted internet resources

The percentage of ICS computers on which denylisted internet resources were blocked increased to 3.54%.

The most notable increase over the quarter occurred in Southeast Asia (4.58%, +0.65 pp). Among the industries in the region, the highest percentage figures for this threat category were recorded in electric power and construction. Over the quarter, the largest increases in percentages figures were observed in the electric power and manufacturing industries.

In North America (Canada), denylisted internet resources (2.14%) showed the greatest increase among all categories — by a factor of 1.22.

Among the selected industries across all regions, the highest percentage figures for the denylisted internet resources category were in the electric power (7.11%) and construction (6.25%) industries in Southeast Asia.

Malicious documents (Microsoft Office + PDF)

The percentage figure for this category decreased over two consecutive quarters, reaching its lowest value (1.56%) for the entire period of observations in Q1 2026. It increased just in two regions: Australia and New Zealand (1.12%, +0.04 pp), and Russia (0.62%, +0.01 pp).

Among the selected industries across all regions, the highest percentages for malicious documents were recorded for biometric systems (9.02%) and building automation (6.97%) in Southern Europe. These same industries also lead in similar rankings for malicious scripts and spyware.

Ransomware

The percentage of ICS computers on which ransomware was blocked has decreased for two consecutive quarters, dropping to 0.14%. This is the lowest value among all categories.

The percentage increased in two regions: North America (Canada) (0.11%, +0.04 pp) and slightly in Northern Europe (0.06%, +0.01 pp).

Among the selected industries across all regions, the highest percentages for ransomware were recorded in the oil and gas and manufacturing industries (0.92% and 0.65%, respectively) in Central Asia and the South Caucasus, and in biometric systems (0.89%) in Russia.

Miners in the form of executable files for Windows

The percentage of ICS computers on which miners in the form of executable files for Windows were blocked decreased to 0.59%.

The percentage increased in seven regions. The largest increase was observed in Africa (0.63%, +0.16 pp). Among the selected industries, the largest increases in the region were in the manufacturing and oil and gas industries.

Among the selected industries across all regions, the highest percentages for miners in the form of executable files were recorded in construction (1.99%), biometric systems (1.98%), and the oil and gas industry (1.97%) in Central Asia and the South Caucasus.

Web miners

The percentage of ICS computers on which web miners were blocked has been declining for a year, and in Q1 2026, it reached the lowest value for the entire period under review (0.22%).

At the same time, the percentage increased in seven regions. The largest increases were observed in South Asia (0.28%, +0.11 pp), the Middle East (0.31%, +0.09 pp), and Africa (0.34%, +0.08 pp). Despite the increases, the percentages in these regions for Q1 2026 did not exceed those observed in 2023–2024 and in Q1 2025.

Among the selected industries across all regions, the highest percentages for web miners were recorded for biometric systems (0.97%) in Russia. Biometric systems in South Asia (0.79%) ranked second, and the electric power sector in Southeast Asia (0.76%) ranked third.

Worms

The percentage of ICS computers on which worms were blocked decreased to 1.33%.

The percentage decreased across all regions following an increase in the previous quarter (due to a wave of phishing attacks that distributed the Backdoor.MSIL.XWorm backdoor worm across all regions of the world).

Among the selected industries across all regions, the highest percentage figure for worms was recorded for biometric systems (4.80%) in Central Asia and the South Caucasus. Two industries in Africa – biometric systems (4.04%) and electric power (3.53%) – took the second and third spots, respectively.

Viruses

The percentage of ICS computers on which viruses were blocked decreased to 1.31%.

The top 3 regions by this figure remained the same: Southeast Asia (6.11%, first by a wide margin), Africa (4.15%), and East Asia (2.97%). These same regions are also among the leaders by the percentage of systems affected by AutoCAD malware. The largest increase in this figure was observed in Africa (+0.41 pp).

Among the selected industries across all regions, the highest percentages for viruses were recorded in the construction industry (6.35%) and building automation (5.50%) in Southeast Asia.

Malware for AutoCAD

The percentage of ICS computers on which malware for AutoCAD was blocked increased to 0.30%.

The most notable increase over the quarter was observed in Africa, with the region’s percentage figure rising by 0.47 pp, a very significant increase for this category, and almost doubling (to 0.91%).

Among the selected industries across all regions, the highest percentages for AutoCAD malware were recorded in the construction industry in East Asia (5.58%) and Southeast Asia (3.87%).

Main threat sources

In Q1 2026, the average percentages across all threat sources, except threats from the internet, decreased globally.

Percentage of ICS computers on which malicious objects from various sources were blocked

Percentage of ICS computers on which malicious objects from various sources were blocked

Internet

The percentage of ICS computers on which threats from the internet were blocked increased to 7.88%. However, over the past three years, the percentage figure for internet threats has followed a downward trend.

The largest increases in the percentages were recorded in Southern Europe (8.59%, +0.59 pp), Southeast Asia (10.16%, +0.55 pp), and Northern Europe (4.47%, +0.51 pp).

Among the selected industries across all regions, the highest percentages for threats from the internet were recorded in electric power (13.16%) and construction (12.55%) in Southeast Asia, and in the engineering and ICS integration sector (12.33%) in South Asia.

Email clients

The percentage of ICS computers on which threats delivered via email clients were blocked decreased to 2.59%. This is a three-year low.

The percentage of this threat source increased in three regions: Southern Europe (6.54%, +0.2 pp), East Asia (1.5%, +0.09 pp), and slightly in Russia (0.7%, +0.04 pp).

Among the selected industries across all regions, the highest percentages for email threats were recorded for biometric systems (19.78%) and building automation (12.34%) in Southern Europe. In these two industries, the percentage of ICS computers on which email threats are blocked is higher than the percentage for threats from the internet. A similar situation was observed in two other instances, both in biometric systems (in South America and Southeast Asia).

Removable media

The percentage of ICS computers on which threats were detected when connecting removable media continued to decrease, reaching its lowest value for the period under review (0.26%).

Among the selected industries across all regions, the highest percentages for removable media threats blocked on ICS computers were observed in the electric power sector in Central Asia and the South Caucasus (1.45%), East Asia (1.34%), and Africa (1.16%).

Network folders

The percentage of ICS computers on which threats are blocked in network folders is steadily decreasing. In Q1 2026, it was the lowest for the period under review (0.029%).

East Asia has traditionally led by a wide margin. The percentage for East Asia (0.135%) is 27 times higher than the lowest regional value (recorded in Northern Europe).

The largest increases in the percentages for threats from network folders were observed in Africa (0.037%, +0.006 pp) and South America (0.013%, +0.006 pp).
Among the selected industries across all regions, the construction industry in East Asia, at 0.36%, holds the top positions in the ranking by the percentage of ICS computers on which threats are blocked in network folders.

For more information on industrial threats see the full version of the report.

OpenClaw: risks for the users and how to mitigate them

By: Kaspersky
1 July 2026 at 02:42

OpenClaw, which was previously known as Clawdbot and Moltbot, is today one of the most successful and fast‑growing ecosystems for AI agents, recognized worldwide. The project quickly became popular with users because of its flexibility and ability to solve fairly complex tasks that previously required a lot of time for automation and execution. A dedicated marketplace appeared quickly after the project started gaining traction, where developers and users began publishing tools that integrate with OpenClaw. Currently, employees all over the world use OpenClaw to automate their tasks, often unaware of risks this practice introduces to them and their employers.

In this article we will examine several security aspects of OpenClaw, look at how attackers can target this system, which vulnerabilities are already known, and how to protect your organization against these issues.

OpenClaw skills

The project’s success was ensured by the fact that the agent accepts natural language instructions, does not require knowledge of programming languages, and allows the use of skills, which expand its capabilities. The overall architecture of OpenClaw can be seen below:

The OpenClaw overall architecture

The OpenClaw overall architecture

As shown in the diagram, the system is designed to be used with agent skills. These skills can reside locally on the system where the agent is installed or they can be obtained from external sources. At the time of writing this article, a dedicated hub named “ClawHub” is used for sharing skills with other users.

One of the key features of OpenClaw skills is that they are easy to create and do not require coding. A skill is in essence a set of commands written in natural language, although it can contain code. Currently, there is a general description of the skill format: it is usually a text file named SKILL.md, although more complex variants may exist. The primary requirement for these files is that they use a plaintext format. To illustrate what this looks like, here is a fragment of a skill:

Openclaw skill example

Openclaw skill example

The applications for OpenClaw skills are quite broad and can include everyday tasks like checking email, performing routine operations and calculations on a computer, as well as more complex pipelines that handle testing, research, or software development. For most actions, the agent requires access to the operating system’s file system, as well as to the tokens and keys of the systems it will interact with. All necessary data are usually provided by users either through environment variables or in plaintext files located alongside the agent.

Since many skills enable automation of work processes, employees worldwide actively use them. This fact, combined with the widespread adoption of the system and the overall popularity of artificial‑intelligence technologies, has attracted attackers to the project.

OpenClaw vulnerabilities

In less than two years, around 530 vulnerabilities have been discovered both in OpenClaw itself and in the underlying technologies. That said, the publication of OpenClaw vulnerabilities in the CVE database began only in February 2026. Below is a breakdown of these vulnerabilities by severity.

Registered vulnerabilities (download)

As shown in the chart, the number of high-severity vulnerabilities is quite large. Most of these vulnerabilities fundamentally involve issues with storing sensitive data and operating with excessively high privileges. Each of them can be exploited to hijack the agent or inject commands that it will execute.

Malicious skills

Besides exploiting vulnerabilities and deceiving users, there are more specific attack vectors against OpenClaw, namely, skills.

Research logically draws a parallel between supply‑chain attacks and the distribution of malicious skills. However, unlike usual supply-chain attacks, creating malicious skills is trivial because there is no longer a need to develop custom malware. Despite this, until February 7, 2026, no skills had undergone even a basic security check, which allowed malicious skills to appear immediately. Our scan of the skill hub in April identified 24 accounts that were distributing more than 600 malicious skills. Overall, open‑source intelligence indicates that over 1100 malicious accounts have been created since January.

Following the investigations and a lengthy effort to clean the skill repository of malicious entries, it was announced that files would undergo preliminary scanning with VirusTotal (VT) and NVIDIA’s SkillSpector. On the one hand, this is a more responsible approach to publishing skills; on the other, because OpenClaw is primarily an agent that executes a set of instructions, detecting malicious activity moves to a different level. Now it is necessary not only to analyze a file for dangerous commands that should be blocked, but also to examine all possible malicious behaviors that could be triggered by a harmful instruction within a skill. An example of a malicious command in natural language:

Example of a malicious command within a skill action

Example of a malicious command within a skill action

An example of a malicious command using a part of a bash command:

Malicious command inside a skill

Malicious command inside a skill

The example in the image and similar malicious skills are detected by Kaspersky products as HEUR:Trojan.ANSI.MalClaw.gen.

In addition, Kaspersky products monitor malicious OpenClaw skill activity on the system. Below are detection statistics from our systems that have identified malicious OpenClaw client behavior. The data for June cover the first half of the month.

Statistics on Kaspersky product detections of OpenClaw malware (download)

As shown in the chart, even despite the measures taken to counter the publication of malicious skills, attacks continue. Therefore, it is important to employ layered protection that isolates the OpenClaw agent from critical data and infrastructure systems. We also recommend checking all skills that enter the organization’s perimeter. For this purpose, Kaspersky Scan Engine is suitable. This solution is designed to protect web applications, proxy servers, network attached storage, and mail gateways. It can be integrated into almost any application, and it is easy to deploy and manage.

Malicious skill detected by Scan Engine

Malicious skill detected by Scan Engine

Additionally, monitor network accesses used by the agent. For this purpose, the project already provides a sandboxing subsystem and various wrappers for working with APIs and services. Last but not least, develop a comprehensive AI policy and make sure your employees never use third-party tools that they are not explicitly allowed to use.

❌
❌